What this report finds: The vast majority (over 70%) of federal labor standards investigations of farms conducted by the Wage and Hour Division (WHD) of the U.S. Department of Labor detect violations—things like wage theft and inadequate housing, as well as other violations of laws designed to protect farmworkers. Farm labor contractors, the fastest-growing segment of farm employment, are the worst violators, accounting for one-fourth of all federal wage and hour violations detected in agriculture and one-half of violations detected in two of the biggest states for farm employment, California and Florida. A relative handful of “bad apples” account for a large share of all violations and the back wages owed as a result of investigations. However, there is a very low probability—1.1%—that any farm employer will be investigated by WHD in any given year.
Why it matters: Farmworkers—the low-paid workers who are essential to keeping Americans fed during the COVID-19 pandemic—are not being protected effectively by federal labor standards enforcement. Most farmworkers either lack an immigration status or have a temporary status, which makes it difficult in practice for them to complain about workplace violations. And data show that WHD is too underfunded and understaffed to adequately protect workers. This lack of enforcement capacity, combined with the fact that their immigration status makes farmworkers vulnerable to exploitation, means that the violations detected in agriculture by WHD are likely a small share of the actual violations taking place. Farm employers can violate wage and hour laws and reasonably expect that those violations will never be detected.
What we can do about it: Policymakers should provide adequate resources to fund wage and hour staffing and enforcement; enforcement efforts should target the biggest violators—farm labor contractors—as well as repeat violators; and officials should consider stiffer penalties that are sufficient to deter future violations.
Introduction, summary, and findings
Farmworkers in the United States earn some of the lowest wages in the labor market and experience an above-average rate of workplace injuries (Costa 2020; BLS 2020). No one knows the exact number of workers employed for wages on U.S. farms during the year, although there are multiple estimates. The Quarterly Census of Employment and Wages (QCEW) shows that average annual employment of farmworkers who are employed on farms that report to state unemployment insurance (UI) agencies was 1.3 million in 2019 (BLS-QCEW 2020a), but estimated that there were an additional 400,000 “wage and salary” farmworkers not included in QCEW data (BLS-QCEW 2020b), suggesting average employment of 1.7 million in 2019.
The QCEW reports average employment, which underestimates the number of unique farmworkers due to seasonality and turnover. The Census of Agriculture (COA) asks farmers (i.e. farm employers or farm owners) how many workers they employ directly; in 2017, farmers reported hiring 2.4 million farmworkers. However, the COA does not report workers who are brought to farms by nonfarm employers such as nonfarm labor contractors, and double counts workers employed by two farms, so 2.4 million is not a count of unique farm workers. The Current Population Survey included a December supplement through the 1980s, and it reported about 2.5 million farmworkers when annual average employment ranged between about 1.1 million to 1.3 million, suggesting about two unique workers per year-round equivalent job, or 2.5 million to 3.4 million workers today based on QCEW data (Rural Migration News 2020b).
The U.S. Department of Labor’s National Agricultural Workers Survey (NAWS) reports the characteristics of crop farmworkers, excluding those who are migrants employed through the H-2A temporary work visa program for agriculture (a “nonimmigrant” visa program), but not their number. H-2A is a temporary work visa program that allows farm employers
to hire migrant guestworkers if they anticipate a shortage of U.S. workers to fill temporary and seasonal jobs. Half of the non-H-2A crop workers were unauthorized immigrants in 2015–2016 (U.S. DOL-ETA 2018), and there were more than 200,000 H-2A workers employed in the United States in 2019, who worked for an average of six months out of the year, representing roughly one-tenth of farmworkers employed on U.S. crop farms (Costa and Martin 2020). Both unauthorized and H-2A workers have limited labor rights and are vulnerable to wage theft and other abuses due to their immigration status (Bernhardt et al. 2009; Apgar 2015). This leaves 40% of the workforce who are U.S. citizens and legal immigrants with full rights and agency in the labor market, so most farmworkers are vulnerable to violations of their rights because of their immigration status.
The U.S. Department of Labor’s (DOL) Wage and Hour Division (WHD) is the federal agency that protects the rights of farmworkers in terms of wage and hour laws—also known as employment laws—including those that protect H-2A “guest” workers. WHD labor standards enforcement actions are intended to ensure that the rights of workers are protected, and to level the playing field for employers, so that employers who underpay workers or engage in other cost-reducing behavior in violation of employment laws do not gain a competitive advantage over law-abiding employers. WHD aims to “promote and achieve compliance with labor standards to protect and enhance the welfare of the nation’s workforce” by enforcing 13 federal labor standards laws, including the Fair Labor Standards Act (FLSA), which requires minimum wages and overtime pay, and regulates the employment of workers who are younger than 18, as well as the Family and Medical Leave Act, and laws governing government contracts, consumer credit, and the use of polygraph testing, etc. (U.S. DOL-WHD 2020c).
WHD also enforces two laws and their implementing regulations specific to agricultural employment. One is the Migrant and Seasonal Agricultural Worker Protection Act (MSPA), the major federal law that protects U.S. farmworkers. The other is the statute that establishes the H-2A program, a temporary work visa program that allows farm employers to hire migrant guestworkers if they anticipate a shortage of U.S. workers to fill temporary and seasonal jobs.
Federal labor law exempts farmworkers from some basic protections that cover most other workers in the U.S. labor market, including from the National Labor Relations Act—the federal law that provides the right to form and join unions, and to engage in protected, concerted activities to improve workplace conditions. Farmworkers are covered by the FLSA, but not the FLSA’s overtime provisions that require most workers to be paid time and a half after working eight hours in a day or 40 hours in a week.1
The WHD in 2019 had just under 1,500 employees, including 780 investigators, and a budget of $229 million to investigate 10.2 million U.S. establishments with 148 million employees (BLS-QCEW 2020a; U.S. DOL 2020; U.S. DOL-WHD 2020e). The number of workers that each WHD investigator is responsible for has risen dramatically. In 1978, there was one WHD investigator for every 69,000 workers; by 2018, one investigator was responsible for 175,000 workers (Hamaji et al. 2019), highlighting persistent WHD underfunding and understaffing.
WHD may order employers to pay back wages owed to underpaid employees, file suits to recover back wages and an equal amount as liquidated damages, and assess civil money penalties that aim to remove the incentive to violate employment laws. WHD also may seek injunctive relief from federal courts to mandate employer compliance and prosecute egregious violations criminally. When investigating workplace violations, WHD does not take immigration status into account, and can award back pay to farmworkers who are not authorized to be employed in the United States.
Ensuring compliance with labor standards in a low-wage sector with vulnerable and exploitable workers such as agriculture is difficult for any enforcement agency, but especially the underfunded WHD. Former WHD Administrator David Weil concluded that there “will never be sufficient resources to staff agencies to the level required to assure complete compliance with workplace laws, so there will always be a need for enforcement agencies to use their [limited] resources to achieve greatest impact.” (Weil 2018, 20). As a result, Weil introduced strategic enforcement, moving from responding to individual worker complaints to having half or more of WHD investigations be proactive or directed at firms likely to violate wage and hour laws. WHD also used such enforcement tools as the “hot goods” provision, which allows WHD to prohibit the shipment and distribution of goods produced in violation of FLSA’s minimum wage, overtime, or child labor requirements (Weil 2014a).
The COVID-19 pandemic has exacerbated the already-extreme vulnerabilities of farmworkers, who are considered “essential” workers and who work in person rather than remotely. Federal and state workplace safety agencies, as well as employer associations and buyers of farm commodities, have developed guidelines to protect essential workers by reorganizing work, travel, and housing, and providing workers with protective personal equipment. However, following these federal guidelines is not mandatory, and there are widespread concerns that limited access to the social safety net, combined with crowded conditions at work and in housing, could encourage sick employees to work and allow COVID-19 to spread rapidly among farmworkers (Costa and Martin 2020; Botts and Cimini 2020; Bottenmiller Evich, Bustillo, and Crampton 2020). COVID-19 cases are not always reported by industry and occupation, but media reports suggest there have been numerous outbreaks among farmworkers, and food processing and meatpacking workers (Dorning and Skerritt 2020; Douglas 2020).
The COVID-19 pandemic makes it more important than ever that farm employers comply with labor standards and protect farmworkers
This report analyzes federal data from WHD databases on wage and hour violations to understand labor standards enforcement efforts in the agricultural sector. The data represent only WHD investigations and violations of the law detected by WHD, but not all labor and employment law violations in agriculture. The immigration status of farmworkers, fear of retaliation and deportation, and even the perception that WHD will not take action or will fail to obtain meaningful remedies can contribute to farmworkers not reporting violations.
We analyze data on back wages and civil money penalties (CMPs) that may reflect negotiations and settlements between WHD and farm employers, which means that WHD investigators initially may have sought more back wages or higher CMPs. We also do not know whether the back wages or higher CMPs assessed eventually were paid to workers.
This report does not review health and safety issues on farms or analyze the limited enforcement data from the DOL’s Occupational Safety and Health Administration (OSHA), which enforces the Occupational Health and Safety Act.2 It deals only with federal enforcement, not the enforcement of state labor and employment laws that may provide more protections for farmworkers, as in California and New York. Some state governments do very little to enforce state wage and hour laws—or nothing at all—and in these states, the federal WHD may be the only government agency enforcing employment laws on farms, which may influence where WHD focuses its efforts geographically.
The purpose of this report is to analyze enforcement data to help stakeholders better understand the results of WHD enforcement, including where violations occurred, which laws were violated, and the penalties that were assessed over the past two decades. We hope the analysis will inform and spark a discussion about how to improve labor standards enforcement on farms, and help increase protections for farmworkers.
Major findings
Following are seven major findings from the report:
- Investigations of employers that violate federal wage and hour laws designed to protect farmworkers detect millions in wage theft every year and lead to millions in civil money penalties against agricultural employers.
- The U.S. Department of Labor’s Wage and Hour Division (WHD) conducted more than 31,000 investigations of U.S. employers in agriculture between fiscal years 2000 and 2019, an average of 1,500 per year. As a result of these investigations, employers were ordered to pay $76 million in back wages to 154,000 farmworkers and to pay $63 million in civil money penalties for violations (in constant 2019 dollars). In 2019, average back wages owed per worker were $572 for violations of the Migrant and Seasonal Agricultural Worker Protection Act, $485 for violations of the H-2A visa program, and $813 for violations of the Fair Labor Standards Act. Violations of these laws include things like wage theft and providing inadequate housing as well as violations related to transportation, employer disclosures, and record-keeping.
- In 2019, WHD investigators found that agricultural employers owed farmworkers a total of $6.0 million in back wages and assessed violating employers $6.3 million in civil money penalties. Both back wages owed and civil money penalties assessed as a result of investigations peaked in fiscal year 2013, at $8.5 and $8.0 million, respectively (all in constant 2019 dollars).
- In 2019, WHD investigators found that employers owed $1.3 million in back wages to 2,300 workers based on violations of the Migrant and Seasonal Agricultural Worker Protection Act (MSPA), which is the major federal law that protects U.S. farmworkers, and these employers were assessed $2.9 million in civil money penalties for MSPA violations (all in constant 2019 dollars). The year 2019 was the peak year for both back wages owed and civil money penalties assessed for MSPA violations detected by investigations.
- In 2019, WHD investigators found that employers owed $2.4 million in back wages to 5,000 workers based on violations of the H-2A visa program (nonimmigrant visas for temporary or seasonal farmworkers); employers were assessed $2.8 million in civil money penalties for H-2A violations. In 2019, the number of violations detected in the H-2A program by WHD was a record 12,000. Both back wages owed and civil money penalties assessed for H-2A violations peaked in fiscal year 2013, at $4.9 and $6.6 million, respectively (all in constant 2019 dollars).
- Agriculture accounts for a much higher share of investigations and violations than its share of total U.S. employment. Average farmworker employment among employers that report to state unemployment insurance agencies was 1.3 million, about 1% of total U.S. employment in 2019. However, over the past 15 years, agriculture accounted for 7% of all federal wage and hour investigations and 3% of the 10 million violations found—three times agriculture’s share of employment.
- The back wages recovered for farmworkers whose rights have been violated may just be the tip of the iceberg since WHD is underfunded and understaffed. The number of WHD investigations in U.S. agriculture fell to 1,125 in 2019, an average of less than 100 a month, and less than half of the 2,431 investigations in 2000. Given that WHD investigates roughly 1,200 agricultural employers each year out of the 107,000 farm employers that report to state unemployment insurance agencies, a farm employer’s probability of being investigated in any given year is 1.1%. Funding for WHD and the number of WHD investigators has declined in recent years, and the 780 investigators in 2019 were fewer than five decades ago, helping to explain fewer investigations.
- Despite the reduction in the number of investigations and staff at WHD, the vast majority of investigations of farm employers detect violations, a sign that these employers are not complying with federal wage and hour laws. Some 70% of investigations conducted by WHD in agriculture detected violations, including 40% that detected one to four violations and 30% that detected five or more violations.
- Farm labor contractors—nonfarm employers acting as staffing firms for farm employers—were the most egregious violators between 2005 to 2019. These employers represent 14% of agricultural employment nationwide but accounted for 24% of all agricultural violations from 2005 to 2019. Farm labor contractors also represented a higher share of agricultural violations than their share of employment in the two major farm labor states, California and Florida—where they accounted for approximately half of all violations over the 2005–2019 period. Farmworkers who are employed by farm labor contractors are more likely to suffer wage and hour violations than those who are hired directly by farms.
- Violations of federal wage and hour laws vary across areas and commodities. The share of wage and hour violations detected by county and commodity does not necessarily correspond to the share of agricultural employment in that county or commodity. In other words, some counties with relatively lower agricultural employment nevertheless may have a disproportionally high share of violations, and vice versa.
- A number of “bad apple” employers make life tough for farmworkers. Among the employers that were investigated, the 5% that committed the most violations accounted for half or more of all violations in a particular agricultural industry or commodity, including among farm labor contractors.
Questions for further investigation
Our analysis raises several key questions that merit further investigation with respect to better protecting farmworkers, including:
- Does the low probability of being investigated encourage violations of employment laws? Since only 1.1% of farm employers are investigated in any given year, farm employers reasonably can expect they will never be investigated.
- Without increased funding for WHD, could changes in enforcement strategy improve compliance and worker protections? What is the optimal balance between investigations in areas with more and fewer farmworkers, and between complaint-driven and strategic enforcement that targets likely violators? What are the lessons of WHD’s strategic enforcement strategy during Administrator David Weil’s tenure between 2014 and 2016?
- Are the penalties assessed by WHD for violations sufficient to change behavior and deter others from violating employment laws? If not, what penalties would encourage compliance and deter violations?
- What can be done to improve compliance among the bad apple employers and farm labor contractors who account for the most violations? Should public policy aim to reduce the growth of the farm labor contractor model of farm employment?
- Could more education of workers and employers improve compliance?
Recommendations
We offer the following recommendations for enforcement agencies that could improve compliance with employment laws and better protect farmworkers:
- FLCs and farms that use FLCs deserve increased scrutiny. Given their disproportionate share of violations, compliance could be incentivized with:
- larger fines and more significant sanctions, and making other employers aware of them
- adequate enforcement of the joint employment standard under the FLSA to encourage farms to ensure that the FLCs who bring workers to their farms are in compliance.
- Among all employers and FLCs, examining whether the severity of sanctions is sufficient; increasing the value of civil money penalties should be considered in order to shift penalties from a cost of doing business to an incentive for compliance.
- WHD should continue to assess and refine strategic enforcement strategies that aim to improve compliance among employers prone to violate employment laws.
- Repeat violators of employment laws could be required to submit certified payroll data to WHD (as the Davis-Bacon Act requires of government contractors), and be subjected to random payroll audits.
- Statistical analysis of labor standards enforcement data can formalize investigator rules of thumb about which employers are most likely to violate employment laws, and help investigators more quickly detect irregularities in payroll data. For example, databases that record the average productivity of workers would be helpful to determine whether “ghost” farmworkers on employer payrolls explain extra-high hourly earnings.
- More could be done to build on the good work done by advocates and unions to educate farmworkers about their rights and the process of reporting violations, perhaps with new and innovative methods like mobile phone apps.
WHD funding and enforcement: Investigations in agriculture and total fines between fiscal years 2000 and 2019
The analysis in this section is based on aggregate data from the enforcement database of the U.S. Department of Labor’s (DOL) Wage and Hour Division (WHD). WHD conducted more than 31,000 investigations in U.S. agriculture between fiscal years 2000 and 2019, an average of 1,500 per year, and ordered $76 million to be paid in back wages to 154,000 farmworkers, and assessed $63 million in civil money penalties for violations (in constant 2019 dollars) (U.S. DOL-WHD 2020a).
Figure A shows a clear downward trend in the number of WHD investigations at agricultural worksites over the past two decades, from more than 2,000 a year in the early 2000s to 1,100 per year the last two fiscal years.
Wage and Hour Division investigations of agricultural employers, fiscal years 2000–2019
| Fiscal Year | Inspections of agricultural employers |
|---|---|
| 2000 | 2,431 |
| 2001 | 2,300 |
| 2002 | 2,176 |
| 2003 | 1,495 |
| 2004 | 1,630 |
| 2005 | 1,449 |
| 2006 | 1,410 |
| 2007 | 1,666 |
| 2008 | 1,600 |
| 2009 | 1,377 |
| 2010 | 1,277 |
| 2011 | 1,527 |
| 2012 | 1,659 |
| 2013 | 1,673 |
| 2014 | 1,430 |
| 2015 | 1,361 |
| 2016 | 1,275 |
| 2017 | 1,307 |
| 2018 | 1,076 |
| 2019 | 1,125 |
Source: Authors’ analysis of U.S. Department of Labor, Wage and Hour Division, Agriculture data table (U.S. DOL-WHD 2020a).
What explains fewer investigations of farm employers? While labor enforcement priorities vary by administration, funding for WHD has lagged behind the growth of the U.S. labor force. In inflation-adjusted dollars, WHD’s budget in 2020 was $13 million less than it was in 2012.3 Figure B shows that in 2019 there were only 780 WHD investigators enforcing federal labor standards, 32 fewer than in 1973 (U.S. DOL-WHD 2020e). Hamaji et al. (2019) note that in 1978, there was one WHD investigator for every 69,000 U.S. workers; by 2018, there was one investigator for every 175,000 U.S. workers.
Number of Wage and Hour Division investigators, U.S. Department of Labor, 1973–2019
| Year | Investigators on board at years’ end |
|---|---|
| 1973 | 812 |
| 1974 | 869 |
| 1975 | 921 |
| 1976 | 964 |
| 1977 | 980 |
| 1978 | 1,232 |
| 1979 | 1,087 |
| 1980 | 1,059 |
| 1981 | 953 |
| 1982 | 914 |
| 1983 | 928 |
| 1984 | 916 |
| 1985 | 950 |
| 1986 | 908 |
| 1987 | 951 |
| 1988 | 952 |
| 1989 | 970 |
| 1990 | 938 |
| 1991 | 865 |
| 1992 | 835 |
| 1993 | 804 |
| 1994 | 800 |
| 1995 | 809 |
| 1996 | 781 |
| 1997 | 942 |
| 1998 | 942 |
| 1999 | 938 |
| 2000 | 949 |
| 2001 | 945 |
| 2002 | 898 |
| 2003 | 850 |
| 2004 | 788 |
| 2005 | 773 |
| 2006 | 751 |
| 2007 | 732 |
| 2008 | 731 |
| 2009 | 894 |
| 2010 | 1,035 |
| 2011 | 1,024 |
| 2012 | 1,067 |
| 2013 | 1,040 |
| 2014 | 976 |
| 2015 | 995 |
| 2016 | 974 |
| 2017 | 912 |
| 2018 | 835 |
| 2019 | 780 |
Note: Numbers represent Wage and Hour Division investigators on staff at the end of each year.
Source: Authors' analysis of Wage and Hour Division data on the number of investigators (U.S. DOL-WHD 2020e).
Nonetheless, Figure C shows that the total back wages owed for all violations of federal employment laws has been on a generally upward trend, peaking at $8.4 million in FY2013, the same year that civil money penalty assessments peaked at $8.0 million. Annual back wages and CMPs were between $3.8 million and $6.7 million over the past five years.4 Figure D shows that the number of farmworkers who were owed back wages peaked at 12,000 in FY2014, and was just under 9,000 in FY2019.
Back wages and civil money penalties assessed (in millions of dollars) against agricultural employers by the Wage and Hour Division, fiscal years 2000–2019
| Fiscal year | Back wages | Civil money penalties |
|---|---|---|
| 2000 | $1.98 | $2.04 |
| 2001 | 2.50 | 1.83 |
| 2002 | 2.89 | 1.69 |
| 2003 | 3.40 | 1.58 |
| 2004 | 1.65 | 2.24 |
| 2005 | 1.75 | 1.40 |
| 2006 | 2.15 | 1.03 |
| 2007 | 3.94 | 1.79 |
| 2008 | 2.52 | 1.60 |
| 2009 | 1.68 | 1.50 |
| 2010 | 3.71 | 1.30 |
| 2011 | 3.25 | 2.21 |
| 2012 | 5.88 | 5.10 |
| 2013 | 8.45 | 8.02 |
| 2014 | 4.87 | 3.35 |
| 2015 | 4.66 | 5.46 |
| 2016 | 5.16 | 3.77 |
| 2017 | 5.26 | 4.53 |
| 2018 | 4.28 | 6.66 |
| 2019 | 6.06 | 6.33 |
Note: Data are inflation adjusted to 2019 dollars.
Source: Authors’ analysis of U.S. Department of Labor, Wage and Hour Division, Agriculture data table (U.S. DOL-WHD 2020a).
Employees receiving back wages resulting from Wage and Hour Division investigations of agricultural employers, fiscal years 2000–2019
| Fiscal Year | Employees receiving back wages |
|---|---|
| 2000 | 5,255 |
| 2001 | 9,356 |
| 2002 | 5,823 |
| 2003 | 7,778 |
| 2004 | 3,711 |
| 2005 | 3,984 |
| 2006 | 2,968 |
| 2007 | 8,670 |
| 2008 | 5,399 |
| 2009 | 5,527 |
| 2010 | 8,601 |
| 2011 | 6,567 |
| 2012 | 11,068 |
| 2013 | 11,847 |
| 2014 | 12,031 |
| 2015 | 10,025 |
| 2016 | 10,549 |
| 2017 | 7,304 |
| 2018 | 9,015 |
| 2019 | 8,972 |
Source: Authors’ analysis of U.S. Department of Labor, Wage and Hour Division, Agriculture data table (U.S. DOL-WHD 2020a).
Three states with large agricultural sectors accounted for 41% of WHD agricultural investigations over the past two decades: Florida had 18%, Texas 12%, and California 11%. North Carolina and New York each had 5% of investigations, and Georgia, New Jersey, New Mexico, Pennsylvania, and Virginia each accounted for 3%.
Violations of the Migrant and Seasonal Agricultural Worker Protection Act
Over the past two decades, back wages owed to farmworkers and civil money penalties assessed have been rising for violations of the United States’ main law protecting farmworkers, and for violations of regulations governing H-2A, the main temporary work visa program for farmworkers.
About 45% of the agricultural investigations over the past two decades found violations of the Migrant and Seasonal Agricultural Worker Protection Act (MSPA), the major federal law that protects U.S. farmworkers. In the peak year of FY2014, more than half of investigations revealed violations of MSPA; there were an average 14 violations on the farms with MSPA violations. Over the past 20 years, the average number of MSPA violations per farm with violations was eight.
Table 1 presents data on MSPA investigations, violations, and penalties, and shows that back wages owed to workers for MSPA violations peaked at $1.3 million in FY2019, when civil money penalties for MSPA violations also peaked at $2.9 million. In FY2019, employers were ordered to provide back pay to 2,253 workers, an average of about $570 each.
Enforcement of the Migrant and Seasonal Agricultural Worker Protection Act (MSPA): Back wages and civil money penalties assessed by the Wage and Hour Division resulting from violations of MSPA, fiscal years 2000–2019
| Fiscal year | Cases with violations | Total violations under MSPA | Ave violations per case | Employees receiving back wages | Back wages ($2019) | Average back wages owed per employee ($2019) | Civil monetary penalties assessed ($2019) |
|---|---|---|---|---|---|---|---|
| Total or average | 14,094 | 119,045 | 8 | 52,760 | $10,012,400 | $190 | $24,718,400 |
| 2000 | 853 | 4,422 | 5 | 1,114 | $156,200 | $140 | $1,295,900 |
| 2001 | 941 | 10,745 | 11 | 6,356 | $532,900 | $84 | $1,061,900 |
| 2002 | 948 | 5,994 | 6 | 1,835 | $552,500 | $301 | $1,116,400 |
| 2003 | 740 | 6,008 | 8 | 1,994 | $371,100 | $186 | $836,200 |
| 2004 | 794 | 4,295 | 5 | 1,129 | $369,800 | $328 | $1,283,700 |
| 2005 | 616 | 3,430 | 6 | 1,330 | $129,200 | $97 | $772,500 |
| 2006 | 615 | 3,105 | 5 | 1,007 | $193,600 | $192 | $776,500 |
| 2007 | 812 | 5,350 | 7 | 1,497 | $222,000 | $148 | $1,460,500 |
| 2008 | 747 | 5,275 | 7 | 2,557 | $367,700 | $144 | $909,800 |
| 2009 | 636 | 4,979 | 8 | 2,061 | $390,100 | $189 | $960,700 |
| 2010 | 626 | 4,876 | 8 | 1,883 | $379,700 | $202 | $761,900 |
| 2011 | 654 | 5,578 | 9 | 2,558 | $461,300 | $180 | $1,008,700 |
| 2012 | 767 | 7,129 | 9 | 3,688 | $841,800 | $228 | $1,156,500 |
| 2013 | 822 | 8,255 | 10 | 4,336 | $699,700 | $161 | $992,300 |
| 2014 | 756 | 10,745 | 14 | 6,213 | $802,700 | $129 | $1,028,800 |
| 2015 | 707 | 7,802 | 11 | 3,569 | $695,200 | $195 | $905,100 |
| 2016 | 608 | 7,696 | 13 | 3,792 | $724,700 | $191 | $1,031,800 |
| 2017 | 548 | 3,876 | 7 | 1,274 | $260,400 | $204 | $1,682,400 |
| 2018 | 492 | 4,905 | 10 | 2,314 | $573,000 | $248 | $2,801,500 |
| 2019 | 412 | 4,580 | 11 | 2,253 | $1,288,800 | $572 | $2,875,400 |
Note: Dollar amounts reported in this table have been adjusted for inflation to constant 2019 dollars using the CPI-U-RS. As a result, the dollar amounts presented here may differ from the amounts reported in the source data. Totals may not sum due to rounding.
Source: Authors’ analysis of U.S. Department of Labor, Wage and Hour Division, Agriculture data table (U.S. DOL-WHD 2020a).
Table 1 also shows that the total back wages owed and CMPs assessed for MSPA violations have fluctuated quite a bit over the past two decades, but increased significantly in FY2019, when back wages peaked at over $1 million for the first time. Over that time frame, WHD assessed nearly $25 million in CMPs for MSPA violations, which exceeded the amount of back wages owed to workers for MSPA violations, $10 million.5
Violations of the H-2A regulations
WHD enforces H-2A regulations that protect labor standards for migrant workers with H-2A visas and U.S. workers vis-à-vis the H-2A program. The H-2A workers’ share of the total farm labor workforce has grown rapidly over the past decade. In 2019, more than 200,000 H-2A workers were employed in the United States, for an average of six months each.6 Numerous reports from advocates, journalists, and government audits have revealed violations of employment laws that protect H-2A workers, who rarely complain because they lose their right to be in the United States if they lose their jobs (see, for example, Garrison, Bensinger, and Singer-Vine 2015; GAO 2017; Bauer and Stewart 2013). This means the H-2A violations detected by WHD investigators likely underreport the true extent of wage and hour violations by H-2A employers.7
About 11% of the agricultural investigations conducted over the past two decades found employer violations of H-2A regulations. The share of investigations that detect violations is rising, reaching 38% in FY2019, while there was an average of 34 violations per investigation that found at least one H-2A violation.
Table 2 shows that back wages owed to workers based on H-2A violations (which may have been owed to H-2A workers and/or U.S. or unauthorized workers) peaked at $4.9 million in FY2013, while CMPs for H-2A violations peaked in the same year at $6.6 million. The number of workers receiving back wages for H-2A violations peaked at almost 5,000 in FY2019, when the average employee who received back wages for an H-2A violation was awarded $485. The highest back wages assessed per employee was in FY2013, when an average of $1,100 was owed to each of the 4,400 workers who were owed back pay. Over the past two decades, the total CMPs assessed by WHD amounted to more than $31 million for H-2A violations, which exceeded total back wages of more than $24 million.8
Enforcement of the H-2A visa program: Back wages and civil money penalties assessed by the Wage and Hour Division resulting from H-2A violations, fiscal years 2000–2019
| Fiscal year | Cases with violations | Total violations under H-2A | Average violations per case | Employees receiving back wages | Back wages ($2019) | Average back wages per employee ($2019) | Civil monetary penalties assessed ($2019) |
|---|---|---|---|---|---|---|---|
| Total or average | 3,343 | 113,836 | 34 | 41,869 | $24,276,900 | $580 | $31,268,700 |
| 2000 | 68 | 1,100 | 16 | 307 | $136,800 | $446 | $203,400 |
| 2001 | 102 | 9,739 | 95 | 1,185 | $675,000 | $570 | $374,300 |
| 2002 | 121 | 3,606 | 30 | 1,043 | $289,800 | $278 | $247,100 |
| 2003 | 76 | 3,440 | 45 | 937 | $502,700 | $537 | $433,400 |
| 2004 | 79 | 1,910 | 24 | 560 | $189,100 | $338 | $242,000 |
| 2005 | 73 | 2,415 | 33 | 947 | $476,400 | $503 | $375,200 |
| 2006 | 86 | 1,084 | 13 | 265 | $277,600 | $1,048 | $73,600 |
| 2007 | 95 | 3,270 | 34 | 1,826 | $544,000 | $298 | $95,700 |
| 2008 | 114 | 3,314 | 29 | 1,064 | $762,400 | $717 | $524,400 |
| 2009 | 117 | 4,152 | 35 | 1,487 | $478,700 | $322 | $369,500 |
| 2010 | 100 | 3,730 | 37 | 954 | $436,200 | $457 | $419,600 |
| 2011 | 170 | 5,987 | 35 | 1,548 | $926,600 | $599 | $889,500 |
| 2012 | 216 | 10,214 | 47 | 3,228 | $2,014,000 | $624 | $3,644,900 |
| 2013 | 232 | 11,171 | 48 | 4,440 | $4,889,800 | $1,101 | $6,565,400 |
| 2014 | 173 | 6,954 | 40 | 2,971 | $1,491,000 | $502 | $1,911,200 |
| 2015 | 207 | 7,935 | 38 | 2,496 | $1,732,400 | $694 | $4,231,600 |
| 2016 | 235 | 6,079 | 26 | 3,572 | $1,546,500 | $433 | $2,368,500 |
| 2017 | 330 | 7,314 | 22 | 3,717 | $2,480,400 | $667 | $2,343,100 |
| 2018 | 318 | 8,438 | 27 | 4,328 | $2,007,500 | $464 | $3,119,900 |
| 2019 | 431 | 11,984 | 28 | 4,994 | $2,419,800 | $485 | $2,836,600 |
Note: Dollar amounts reported in this table have been adjusted for inflation to constant 2019 dollars using the CPI-U-RS. As a result, the dollar amounts presented here may differ from the amounts reported in the source data. Totals may not sum due to rounding.
Source: Authors’ analysis of U.S. Department of Labor, Wage and Hour Division, Agriculture data table (U.S. DOL-WHD 2020a).
Figure E is based on the same data as Table 2 and shows the fluctuation of back wages owed based on H-2A violations between fiscal years 2000 and 2019. There is no statistically significant trend in the amount of back wages owed to workers based on H-2A violations between fiscal years 2000 and 2019.9 H-2A workers are in the United States an average of six months, and they earn roughly $2,000 to $3,000 a month, or $12,000 to $18,000 during their average six months in the United States, so back wages of $485 (the average in FY2019) equal 3% to 4% of total earnings during their term of employment.
Average back wages assessed to workers per H-2A violation, fiscal years 2000–2019
| Fiscal year | Average back wages per employee |
|---|---|
| 2000 | $446 |
| 2001 | $570 |
| 2002 | $278 |
| 2003 | $537 |
| 2004 | $338 |
| 2005 | $503 |
| 2006 | $1,048 |
| 2007 | $298 |
| 2008 | $717 |
| 2009 | $322 |
| 2010 | $457 |
| 2011 | $599 |
| 2012 | $624 |
| 2013 | $1,101 |
| 2014 | $502 |
| 2015 | $694 |
| 2016 | $433 |
| 2017 | $667 |
| 2018 | $464 |
| 2019 | $485 |
Note: Dollar amounts reported in this figure have been adjusted for inflation to constant 2019 dollars using the CPI-U-RS. As a result, the dollar amounts presented here may differ from the amounts reported in the source data.
Source: Authors’ analysis of U.S. Department of Labor, Wage and Hour Division, Agriculture data table (U.S. DOL-WHD 2020a).
Violations of other employment laws
WHD enforces the Fair Labor Standards Act (FLSA) and other employment laws, and WHD investigators found more than 114,000 violations of MSPA and H-2A rules on 9,330 farm establishments over the past two decades (see Table 3). Farm employers were ordered to pay nearly $42 million in back wages to 71,600 farmworkers, and they were assessed almost $6 million in civil money penalties. Violations of the FLSA are grouped together with other violations in the data, so we cannot distinguish them from other employment law violations.
Enforcement of the Fair Labor Standards Act (FLSA) and other employment laws: Back wages and civil monetary penalties assessed by the Wage and Hour Division resulting from FLSA and other violations, fiscal years 2000–2019
| Fiscal Year | Cases with violations | Total other violations (excluding OSHA) | Average violations per case | Employees receiving back wages | Back wages ($2019) | Average back wages per employee ($2019) | Civil monetary penalties assessed ($2019) |
|---|---|---|---|---|---|---|---|
| Total or Average | 9,330 | 114,209 | 12 | 71,574 | $41,741,836 | $583 | $5,812,536 |
| 2000 | 490 | 5,594 | 11 | 3,405 | $1,686,714 | $495 | $469,463 |
| 2001 | 399 | 4,254 | 11 | 3,023 | $1,290,809 | $427 | $252,743 |
| 2002 | 437 | 4,917 | 11 | 3,234 | $2,046,841 | $633 | $219,876 |
| 2003 | 386 | 6,320 | 16 | 5,467 | $2,523,629 | $462 | $196,580 |
| 2004 | 401 | 3,733 | 9 | 2,383 | $1,094,632 | $459 | $498,793 |
| 2005 | 366 | 2,521 | 7 | 1,810 | $1,143,251 | $632 | $184,230 |
| 2006 | 351 | 2,944 | 8 | 1,895 | $1,675,186 | $884 | $106,720 |
| 2007 | 426 | 6,422 | 15 | 5,589 | $3,173,022 | $568 | $153,886 |
| 2008 | 396 | 3,032 | 8 | 2,372 | $1,390,051 | $586 | $121,955 |
| 2009 | 422 | 3,438 | 8 | 2,133 | $808,472 | $379 | $134,786 |
| 2010 | 406 | 12,166 | 30 | 6,424 | $2,890,384 | $450 | $83,953 |
| 2011 | 450 | 4,364 | 10 | 2,958 | $1,859,571 | $629 | $146,359 |
| 2012 | 531 | 6,300 | 12 | 4,743 | $3,023,412 | $637 | $235,441 |
| 2013 | 641 | 6,685 | 10 | 3,637 | $2,860,367 | $786 | $362,770 |
| 2014 | 608 | 5,838 | 10 | 4,309 | $2,574,113 | $597 | $382,899 |
| 2015 | 566 | 8,345 | 15 | 4,855 | $2,230,751 | $459 | $264,208 |
| 2016 | 580 | 11,226 | 19 | 5,316 | $2,890,541 | $544 | $336,169 |
| 2017 | 561 | 4,322 | 8 | 2,635 | $2,523,721 | $958 | $453,201 |
| 2018 | 477 | 5,049 | 11 | 2,491 | $1,704,014 | $684 | $704,590 |
| 2019 | 436 | 6,739 | 15 | 2,895 | $2,352,358 | $813 | $503,914 |
Note: Violations of the Fair Labor Standards Act (FLSA) are grouped together with other violations in the DOL data we utilized, except for MSPA and H-2A violations, therefore we cannot distinguish FLSA violations from other employment law violations (other than MSPA and H-2A, which are presented in Tables 1 and 2). Dollar amounts reported in this table have been adjusted for inflation to constant 2019 dollars using the CPI-U-RS. As a result, the dollar amounts presented here may differ from the amounts reported in the source data. Totals may not sum due to rounding.
Source: Authors’ analysis of U.S. Department of Labor, Wage and Hour Division, Agriculture data table (U.S. DOL-WHD 2020a).
Two decades of aggregate WHD data on farm labor enforcement reveal three major patterns
Our analysis of WHD’s aggregate data on enforcement from fiscal years 2000 and 2019 revealed three notable patterns.
First, as shown in Figure A, the number of WHD investigations in U.S. agriculture has fallen below 1,200 a year—to an average of less than 100 a month—in the last two years. Nevertheless, the data show that agriculture accounts for a much higher share of investigations and violations than its share of employment. The Census of Agriculture (COA) reported more than 500,000 farm employers in the United States in 2017 (Rural Migration News 2019), and 107,000 agricultural establishments were registered with state unemployment insurance agencies in 2019, according to the Quarterly Census of Employment and Wages (QCEW) (BLS-QCEW 2020a). Average farmworker employment according to the QCEW was 1.3 million, about 1% of total U.S. employment in 2019. However, agriculture accounted for 7% of all federal wage and hour investigations and 3% of the 10 million federal wage and hour law violations found over the past 15 years—three times agriculture’s share of employment (BLS-QCEW 2020a; U.S. DOL-WHD 2020a).
Using the QCEW number of establishments as a reference for the number of agricultural employers, means the probability of any single farm ever being investigated for federal employment law violations in a given year is low: 1.1%. The QCEW number of agricultural establishments includes only those required to register and pay unemployment insurance taxes, and is thus only a fifth of the agricultural employers in the COA. Thus, our estimate of 1.1% likely overstates the likelihood that an agricultural employer will be investigated.
Second, violations of MSPA are found on almost half of the farms inspected, and the civil money penalties assessed for MSPA violations are more than twice the amount of back wages owed to farmworkers.
Third, the share of agricultural investigations that find violations of H-2A regulations is rising sharply. Between fiscal years 2000 and 2019, H-2A violations resulted in back wages owed that average $7,300 per farm with violations, and $9,400 per farm in CMP assessments.10 However, U.S. farmers pay about $40 billion a year in wages to farmworkers (USDA 2017). Given that total wage bill, the $6 million in back wages and $6.3 million in CMPs that employers were required to pay In fiscal 2019 (see Figure C) were a miniscule share of the annual overall wage bill.
A note about the data
Figures A, C, and E, and Tables 1–3 in the preceding section are generated from summary statistics on the WHD website that include a warning: “Wage and Hour investigations, including those in agriculture, often involved the concurrent enforcement of multiple statutes. Therefore, duplication may exist in the data” (U.S. DOL-WHD 2020a). The analysis in the following sections is based on a separate WHD enforcement database that “contains all concluded WHD compliance actions since FY 2005” (U.S. DOL-WHD 2020f). There are differences between the summary statistics data and the enforcement database, so there may be discrepancies between the summary analysis and the detailed analysis that follows.
Fifteen years of detailed data on the outcomes of farm labor investigations
This section draws on the analysis of a WHD database that summarizes the outcomes of more than 294,000 investigations between fiscal years 2005 and 2019 in both the public and private sectors (U.S. DOL-WHD 2020f). Entries for each investigation include the employer’s contact information, NAICS industry code, and details of the investigation, such as the number of violations found, how many workers were affected, what back wages were owed, and the civil money penalties assessed on employers.
Federal farm labor investigations between fiscal years 2005 and 2019
The 294,000 investigations over 15 years in all U.S. industries found more than 10 million violations. About 5% of all violations in the database, 530,000, were found at a single Wells Fargo Bank branch in Roseville, Minnesota, in 2012–2013.
Some 19,250 WHD investigations between fiscal years 2005 and 2019, about 6.5% of all investigations, had an agricultural NAICS industry code associated with them, from 1111 for Oilseed and Grain Farming to 115310 for Support Activities for Forestry. More than 10% of the 17,000 farming operations that were investigated were visited multiple times. These agricultural investigations detected a total of 229,000 violations of the three major federal labor standards laws or regulations that apply on farms: the FLSA (22% of all violations), MSPA (30%), and H-2A program rules (33%).
Figure F shows the number of MSPA, H-2A, and FLSA violations in agriculture detected by WHD from fiscal years 2005 to 2019, and finds the number of detected violations of all three laws peaked during fiscal years 2011, 2012, or 2013. The number of detected violations in all three categories reached a record low in fiscal 2019, declining as the number of investigations in agriculture declined.
In 2019, the number of employment law violations detected by the Wage and Hour Division (WHD) among agricultural employers dropped to the lowest point in 15 years: Number of MSPA, H-2A, and FLSA violations detected by WHD investigations in agriculture, fiscal years 2005–2019
| Fiscal year | MSPA violations | H-2A violations | FLSA violations |
|---|---|---|---|
| 2005 | 3,933 | 1,782 | 2,029 |
| 2006 | 4,336 | 4,587 | 5,708 |
| 2007 | 4,790 | 7,604 | 2,463 |
| 2008 | 4,380 | 7,853 | 3,440 |
| 2009 | 6,421 | 7,116 | 2,508 |
| 2010 | 5,115 | 7,349 | 6,637 |
| 2011 | 7,085 | 11,856 | 4,449 |
| 2012 | 11,551 | 7,277 | 7,882 |
| 2013 | 12,700 | 3,940 | 7,816 |
| 2014 | 6,521 | 7,738 | 5,799 |
| 2015 | 4,920 | 5,995 | 4,497 |
| 2016 | 3,256 | 4,479 | 1,532 |
| 2017 | 2,659 | 6,280 | 1,862 |
| 2018 | 2,545 | 4,196 | 1,451 |
| 2019 | 659 | 1,636 | 708 |
Note: MSPA stands for the Migrant and Seasonal Worker Protection Act, H-2A is the H-2A work visa program for temporary agricultural workers, and FLSA stands for the Fair Labor Standards Act.
Source: Authors' analysis of U.S. Department of Labor, Wage and Hour Compliance Action Data (U.S. DOL-WHD 2020f).
Figure G groups the number of violations found per investigation during the FY2005–FY2019 period, from zero to more than five violations per investigation. When looked at this way, the data reveal a U-shape among the violators, with almost 30% of investigations bunched at the zero and 31% bunched at more than five violations; those two ends of the spectrum account for almost two-thirds of the violations, while 17% of investigations found one violation and 23%, nearly a quarter, found two to four violations. However, overall, the data show that 70% of all investigations detected violations, while 30% detected zero violations. In addition, it should be noted that this figure does not account for the severity of the violations or the amounts assessed. In other words, some investigations that detected one or two violations may have detected egregious violations and found employers owing large amounts of back pay, while investigations that detected with five or more violations may have resulted in smaller amounts of back wages owed.
Over 70% of federal investigations of agricultural employers detected wage and hour violations: Violations detected during investigations of agricultural employers, by number of violations found per investigation, fiscal years 2005–2019
| Number of violations | Share of investigations |
|---|---|
| 0 violations | 29.5% |
| 1 violation | 16.7% |
| 2–4 violations | 22.7% |
| 5+ violations | 31.1% |
Note: Data include H-2A, MSPA, FLSA, and all other types of employment law violations in the agricultural sector.
Source: Authors' analysis of U.S. Department of Labor, Wage and Hour Compliance Action Data (U.S. DOL-WHD 2020f).
We reviewed the average number of violations per investigation by state. Figure H shows that the highest number of average violations detected per investigation were not in the five states with the most farm employment. In other words, the WHD investigations that detected the most violations per investigation were not always in the states with the most farmworker employment. It stands to reason that the distribution of violations may be related to the distribution of resources among regional WHD offices, and/or it may be related to differing approaches and priorities among regional WHD offices.
Average number of employment law violations detected by the Wage and Hour Division per investigation that discovered violations among agricultural employers, by state, fiscal years 2005–2019
| State | Average violations per investigation |
|---|---|
| Alabama | 11.6 |
| Alaska | NA |
| Arizona | 55.9 |
| Arkansas | 28.1 |
| California | 24.7 |
| Colorado | 24.0 |
| Connecticut | 14.2 |
| Delaware | 5.3 |
| Washington D.C. | NA |
| Florida | 15.3 |
| Georgia | 21.4 |
| Hawaii | NA |
| Idaho | 55.7 |
| Illinois | 15.7 |
| Indiana | 5.9 |
| Iowa | 67.1 |
| Kansas | 23.5 |
| Kentucky | 17.1 |
| Louisiana | 23.1 |
| Maine | 13.2 |
| Maryland | 9.6 |
| Massachusetts | 14.6 |
| Michigan | 14.9 |
| Minnesota | 24.6 |
| Mississippi | 24.8 |
| Missouri | 68.1 |
| Montana | 10.5 |
| Nebraska | 24.8 |
| Nevada | 65.3 |
| New Hampshire | 12.7 |
| New Jersey | 13.2 |
| New Mexico | 8.8 |
| New York | 13.1 |
| North Carolina | 46.2 |
| North Dakota | 10.4 |
| Ohio | 11.6 |
| Oklahoma | 12.3 |
| Oregon | 51.3 |
| Pennsylvania | 9.7 |
| Rhode Island | 4.1 |
| South Carolina | 8.9 |
| South Dakota | 19.0 |
| Tennessee | 18.2 |
| Texas | 9.7 |
| Utah | 32.9 |
| Vermont | 8.3 |
| Virginia | 15.0 |
| Washington | 42.7 |
| West Virginia | 14.2 |
| Wisconsin | 9.2 |
| Wyoming | 14.6 |
Note: Major farm employment states are California, Texas, Florida, Washington, and North Carolina. Data include H-2A, MSPA, FLSA, and all other types of employment law violations in the agricultural sector.
Source: Authors' analysis of U.S. Department of Labor, Wage and Hour Compliance Action Data (U.S. DOL-WHD 2020f).
Farm labor contractors between fiscal years 2005 and 2019
Farm labor contractors (FLCs) are nonfarm employers that act as staffing firms for farm employers. For FLCs, which correspond to NAICS code 115115, average employment was 181,000 in 2019, according to the QCEW (BLS-QCEW 2020a); FLCs are a subset of the Support Activities for Crop Production category (NAICS 1151), which had average employment of 342,000, meaning that FLCs accounted for 53% of U.S. crop support services employment.
FLCs accounted for 14% of total average employment in UI-covered agriculture of 1.3 million in 201911—including employment in both crops and animal agriculture—but accounted for one-quarter of all employment law violations detected in agriculture (24%). Thus, the share of agricultural employment law violations committed by farm labor contractors was 10 percentage points greater than the FLC share of average annual agricultural employment. In practical terms, that means that farmworkers employed by FLCs or on farms that use FLCs are more likely to suffer wage and hour violations than farmworkers who are employed by farms directly.
We found that 75% of all WHD investigations of FLCs detected violations, while 25% of investigations detected zero violations. We grouped the number of violations detected per investigation of FLCs, as shown in Figure I. The share of investigations of FLCs that found zero violations, at 25%, was significantly less than the share of investigations of FLCs that found five or more violations, 36%. Nearly two-fifths of investigations detected either one violation or two to four violations.
We reviewed the average number of violations detected by investigations of FLCs by state. Figure J shows that when violations committed by FLCs are found as the result of an investigation, the highest number of average violations per investigation were not in the five states with the most agricultural employment.
Three-fourths of federal investigations of farm labor contractors detected wage and hour violations: Violations detected during investigations of farm labor contractors, by number of violations found per investigation, fiscal years 2005–2019
| Number of violations | Share of investigations |
|---|---|
| 0 Violations | 25.3% |
| 1 Violation | 15.9% |
| 2–4 Violations | 22.9% |
| 5+ Violations | 35.9% |
Source: Authors' analysis of U.S. Department of Labor, Wage and Hour Compliance Action Data (U.S. DOL-WHD 2020f).
Average number of employment law violations detected by the Wage and Hour Division per investigation that discovered violations among farm labor contractors, by state, fiscal years 2005–2019
| State | Average farm labor contractor violations per investigation |
|---|---|
| Alabama | 46.0 |
| Alaska | NA |
| Arizona | 67.8 |
| Arkansas | 31.1 |
| California | 25.9 |
| Colorado | 43.0 |
| Connecticut | 2.0 |
| Delaware | NA |
| Washington D.C. | NA |
| Florida | 16.2 |
| Georgia | 19.3 |
| Hawaii | NA |
| Idaho | 24.1 |
| Illinois | 3.0 |
| Indiana | 11.6 |
| Iowa | 167.0 |
| Kansas | 25.2 |
| Kentucky | 5.8 |
| Louisiana | 3.7 |
| Maine | 10.5 |
| Maryland | 3.0 |
| Massachusetts | 2.0 |
| Michigan | 9.7 |
| Minnesota | 8.0 |
| Mississippi | 10.2 |
| Missouri | 10.0 |
| Montana | NA |
| Nebraska | 29.9 |
| Nevada | NA |
| New Hampshire | NA |
| New Jersey | 11.3 |
| New Mexico | 4.7 |
| New York | 2.1 |
| North Carolina | 8.5 |
| North Dakota | NA |
| Ohio | 3.7 |
| Oklahoma | 8.6 |
| Oregon | 59.7 |
| Pennsylvania | 29.4 |
| Rhode Island | NA |
| South Carolina | 9.3 |
| South Dakota | 22.0 |
| Tennessee | 13.2 |
| Texas | 8.1 |
| Utah | NA |
| Vermont | NA |
| Virginia | 2.3 |
| Washington | 47.6 |
| West Virginia | NA |
| Wisconsin | 3.0 |
| Wyoming | NA |
Note: Major farm employment states are California, Texas, Florida, Washington, and North Carolina.
Source: Authors' analysis of U.S. Department of Labor, Wage and Hour Compliance Action Data (U.S. DOL-WHD 2020f).
FLCs bring workers to farms, but we do not have data on the commodities grown on the farms where FLC employees work. We know that most FLC employees work on fruit and vegetable farms, since these commodities require the most seasonal workers that FLCs specialize in providing. For this reason, we cannot directly compare FLC violations with violations committed by crop farms, or citrus farms, because crop and citrus farms both may hire workers directly and use FLCs to obtain workers.
However, if we consider FLCs as a unique NAICS code (115115) and compare the FLC code to others, then FLCs top the list when it comes to federal wage and hour violations, followed by Vegetable and Melon Farming (NAICS 1112) employers, at about 15% of all agricultural violations, and where average employment of 93,000 was 7% of the 1.3 million total UI-covered agricultural employment in 2019. Ten percent of violations were in Poultry and Egg Production (1123), almost all associated with a single employer, Perdue Foods. Four six-digit NAICS industries each accounted for 4% of all employment law violations: Berry (except Strawberry) Farming (111334); Apple Orchards (111331); All Other Miscellaneous Crop Farming (111998); and Broilers and Other Meat Type Chicken Production (11232).
Violations by state and county between fiscal years 2005 and 2019
Agricultural employment is concentrated on farms that produce labor-intensive commodities in a handful of states, and in particular, counties within these states. For example, the five states with the highest agricultural employment include more than half of all farm jobs, and the five leading farm counties in California include more than half of the state’s farm jobs. In this section, we examine how employment law violations in agriculture are distributed by state and by county, and take a closer look at Florida and California, and particular counties in California. We also highlight the commodities (by NAICS codes) where federal wage and hour laws are most likely to be violated.
California and Florida had the most violations, and the biggest violators are FLCs
California and Florida each accounted for 14% of the employment law violations detected as the result of WHD investigations nationwide, followed by North Carolina with 10% (due in large part to Perdue Farms), Texas and Washington with 5% each, and Oregon with 4%. These six states accounted for 52% of all employment law violations found in agriculture. In the two states with the highest shares of violations, FLCs accounted for the largest share of the violations detected by WHD investigators. Figure K shows that FLCs accounted for 48% of the total violations in California during fiscal years 2005 to 2019, and Figure L shows that FLCs accounted for 50% of the total violations detected in Florida over the same period.
Employer violations detected in California by the Wage and Hour Division among all agricultural employers and farm labor contractors, fiscal years 2005–2019
| Year | Violations by all agricultural employers | Violations by farm labor contractors |
|---|---|---|
| 2005 | 1,233 | 972 |
| 2006 | 4,166 | 918 |
| 2007 | 1,931 | 1,189 |
| 2008 | 2,911 | 1,469 |
| 2009 | 2,202 | 1,645 |
| 2010 | 1,577 | 363 |
| 2011 | 2,909 | 1,949 |
| 2012 | 4,589 | 1,556 |
| 2013 | 5,420 | 3,348 |
| 2014 | 3,079 | 1,302 |
| 2015 | 2,181 | 947 |
| 2016 | 2,113 | 1,490 |
| 2017 | 1,902 | 570 |
| 2018 | 2,794 | 733 |
| 2019 | 315 | 240 |
Note: Violations by California farm labor contractor are a subset of employment law violations detected among all agricultural employers in California.
Source: Authors' analysis of U.S. Department of Labor, Wage and Hour Compliance Action Data (U.S. DOL-WHD 2020f).
Employer violations detected in Florida by the Wage and Hour Division among all agricultural employers and farm labor contractors, fiscal years 2005–2019
| Year | Violations by all agricultural employers | Violations by farm labor contractors |
|---|---|---|
| 2005 | 1,225 | 670 |
| 2006 | 1,484 | 686 |
| 2007 | 4,469 | 1,643 |
| 2008 | 1,989 | 1,021 |
| 2009 | 2,034 | 1,020 |
| 2010 | 2,886 | 545 |
| 2011 | 4,045 | 1,726 |
| 2012 | 4,633 | 2,765 |
| 2013 | 2,380 | 1,084 |
| 2014 | 3,744 | 1,986 |
| 2015 | 3,338 | 2,360 |
| 2016 | 1,871 | 1,182 |
| 2017 | 1,837 | 974 |
| 2018 | 1,412 | 1,112 |
| 2019 | 989 | 455 |
Note: Violations by Florida farm labor contractor are a subset of employment law violations detected among all agricultural employers in Florida..
Source: Authors' analysis of U.S. Department of Labor, Wage and Hour Compliance Action Data (U.S. DOL-WHD 2020f).
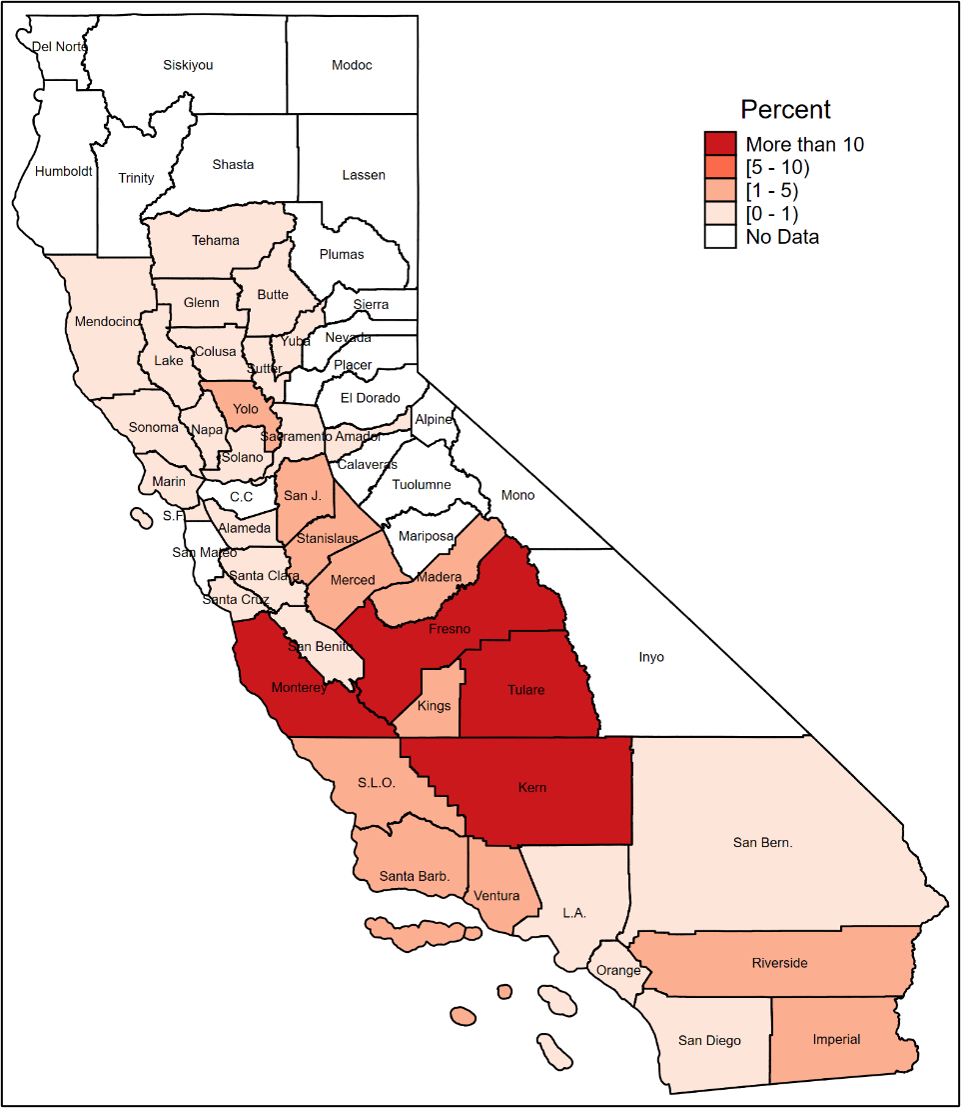
Figures M1–M3 compare each California county’s share of agricultural employment and its share of employment law violations detected by WHD. Counties with a small share of agricultural employment can have a larger share of employment law violations—in other words, the correlation between the two is far from perfect. For example, Siskiyou and Lassen counties have a far higher share of the employment law violations than their shares of agricultural employment, while the major farm employment counties of Fresno, Kern, and Tulare have a smaller share of violations than their shares of agricultural employment.
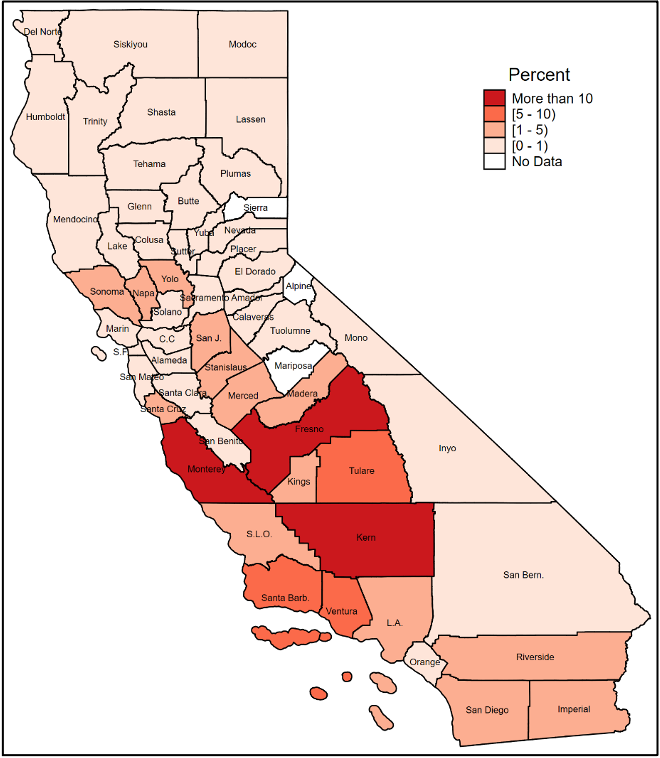
Comparing each county’s share of FLC violations with its share of FLC employment tells a similar story. FLC employment is concentrated in the state’s major farm employment counties of Kern, Tulare, Fresno, and Monterey, and these counties also have a high share of all employment law violations committed by FLCs. However, Figures N1–N3 show that, with the exception of Tulare County, the share of FLC violations in leading farm counties is lower than their share of FLC employment, but counties such as Los Angeles and San Bernardino, with relatively small shares of FLC employment, had higher shares of FLC violations. A handful of other counties, scattered primarily throughout the Central Valley, also had a larger share of FLC violations relative to their share of FLC employment.
Percent of total federal employment law violations detected by the Wage and Hour Division among agricultural employers in California, by county, fiscal years 2005–2019
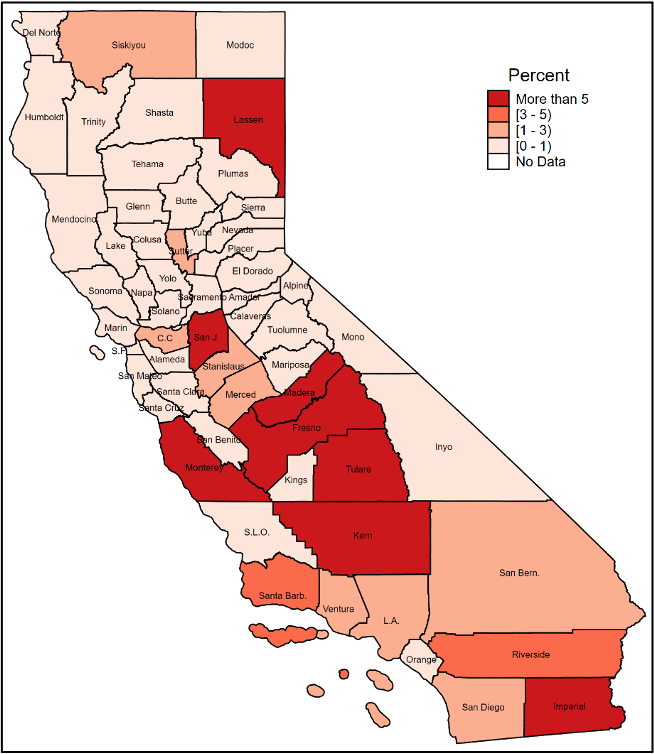
Note: The county-level data in this figure were constructed from data that identifies the Zip code where the employer was located. Some California Zip codes cross county boundaries and, as a result, some investigations could not be assigned to a county.
Source: Authors' analysis of U.S. Department of Labor, Wage and Hour Compliance Action Data (U.S. DOL-WHD 2020f).
Ratio of California county share of federal employment law violations detected by the Wage and Hour Division among agricultural employers to the share of agricultural employment in the county, fiscal years 2005–2019
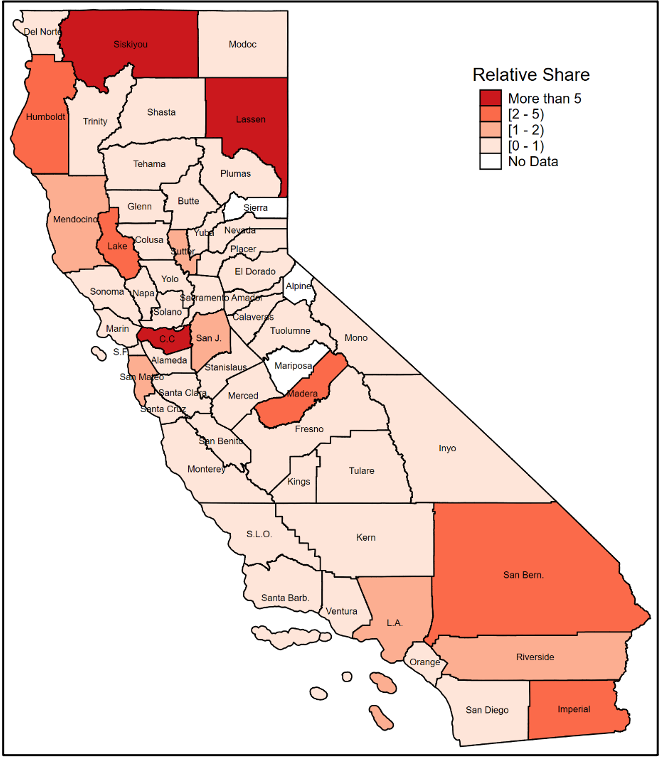
Note: The figure depicts the ratio of each county's share of farm labor violations that were detected between fiscal years 2005 and 2019 relative to the county’s share of agricultural employment. Values less than 1 indicate that a county has a smaller share of violations compared to its share of employment. Larger values indicate that the agricultural employers who were investigated within a county were generally less compliant with employment laws.
Source: Authors' analysis of U.S. Department of Labor, Wage and Hour Compliance Action Data (U.S. DOL-WHD 2020f) and Bureau of Labor Statistics, Quarterly Census of Employment and Wages data for North American Industry Classification System code 11, agriculture, in 2018 (BLS-QCEW 2020a).
Percent of total federal employment law violations detected by the Wage and Hour Division among farm labor contractors in California, by county, fiscal years 2005–2019

Note: The county-level data in this figure were constructed from data that identifies the Zip code where the employer was located. Some California Zip codes cross county boundaries and, as a result, some investigations could not be assigned to a county.
Source: Authors' analysis of U.S. Department of Labor, Wage and Hour Compliance Action Data (U.S. DOL-WHD 2020f).
Ratio of California county share of federal employment law violations detected by the Wage and Hour Division among farm labor contractors to the share of agricultural employment in the county, fiscal years 2005–2019
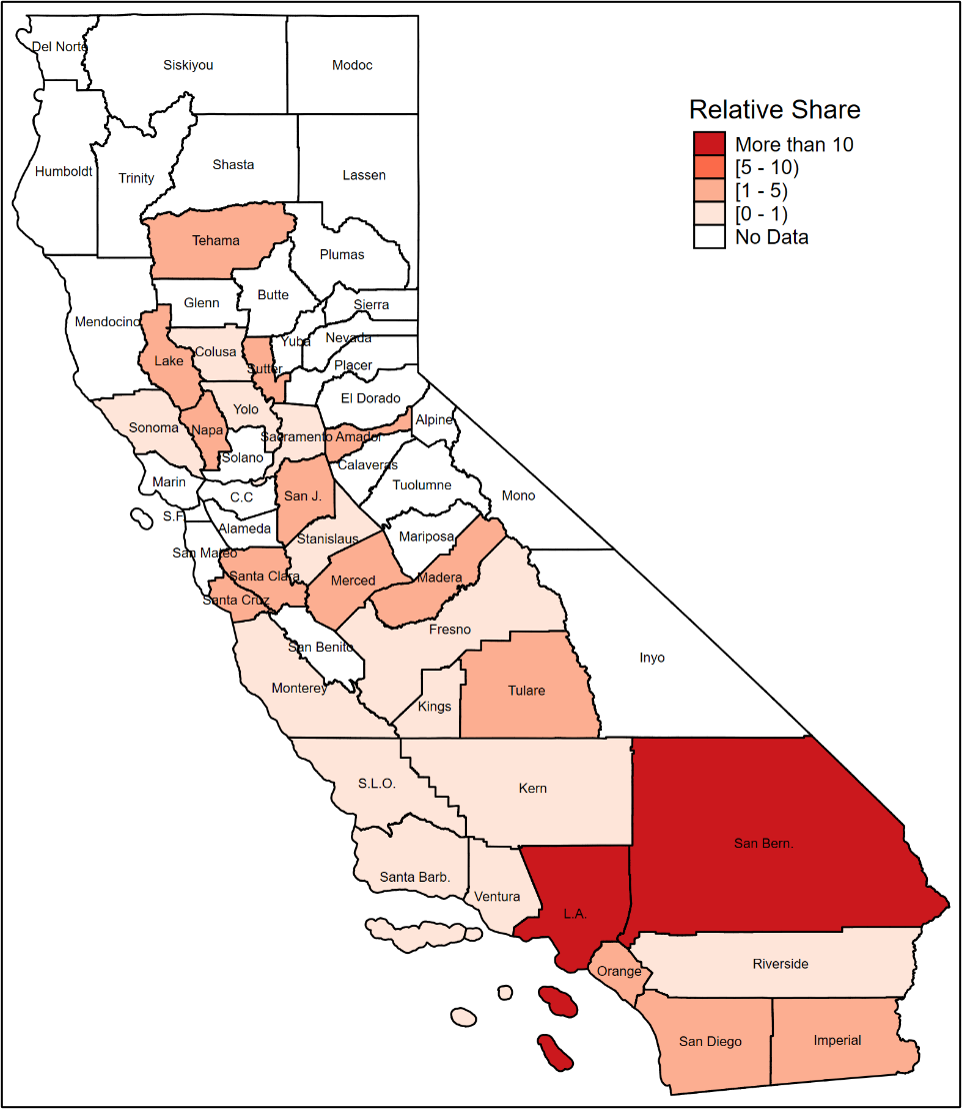
Note: The figure depicts the ratio of each county's share of farm labor violations that were detected among FLCs between fiscal years 2005 and 2019 relative to each county's share of FLC employment in 2018. Values less than 1 indicate that a county has a smaller share of violations compared to its share of employment. Larger values indicate that the FLCs who were investigated within a county were generally less compliant with employment laws. Mountainous counties in the north and east of California have few or no FLCs.
Source: Authors' analysis of U.S. Department of Labor, Wage and Hour Compliance Action Data (U.S. DOL-WHD 2020f) and Bureau of Labor Statistics, Quarterly Census of Employment and Wages data for North American Industry Classification System code 11, agriculture, in 2018 (BLS-QCEW 2020a).
Probability of finding violations in California agriculture
During the Obama administration and under the leadership of WHD Administrator David Weil, the WHD developed a more strategic approach to labor standards enforcement, emphasizing investigations in industries and areas where there were likely to be employment law violations. We used the enforcement data to examine the probability that violations would be found among employers of particular commodities in California, as reflected in their NAICS codes.
Table 4 shows the probability that a violation is detected during an investigation by commodity or NAICS category.12 FLCs are not a commodity because they supply farmworkers to employers who grow many commodities, but they are included for comparison purposes. The highest probability of finding a violation is 72% for fruit and tree nut farming, followed by 64% for vegetable and melon farming investigated. More than half of greenhouse, nursery, and floriculture operations that were investigated, and more than half of animal production and aquaculture that were investigated, had one or more employment law violations.13 In the case of FLCs, almost 85% of California FLCs that were investigated had at least one employment law violation, as did 72% of other crop support service employers that were investigated (excluding FLCs). In sum, most agricultural investigations find violations, and farms that utilize FLCs are where the probability of finding violations is the highest. (If the violations committed by FLCs were categorized under their corresponding commodities, an even higher share of fruit and vegetable farms would have had violations.)
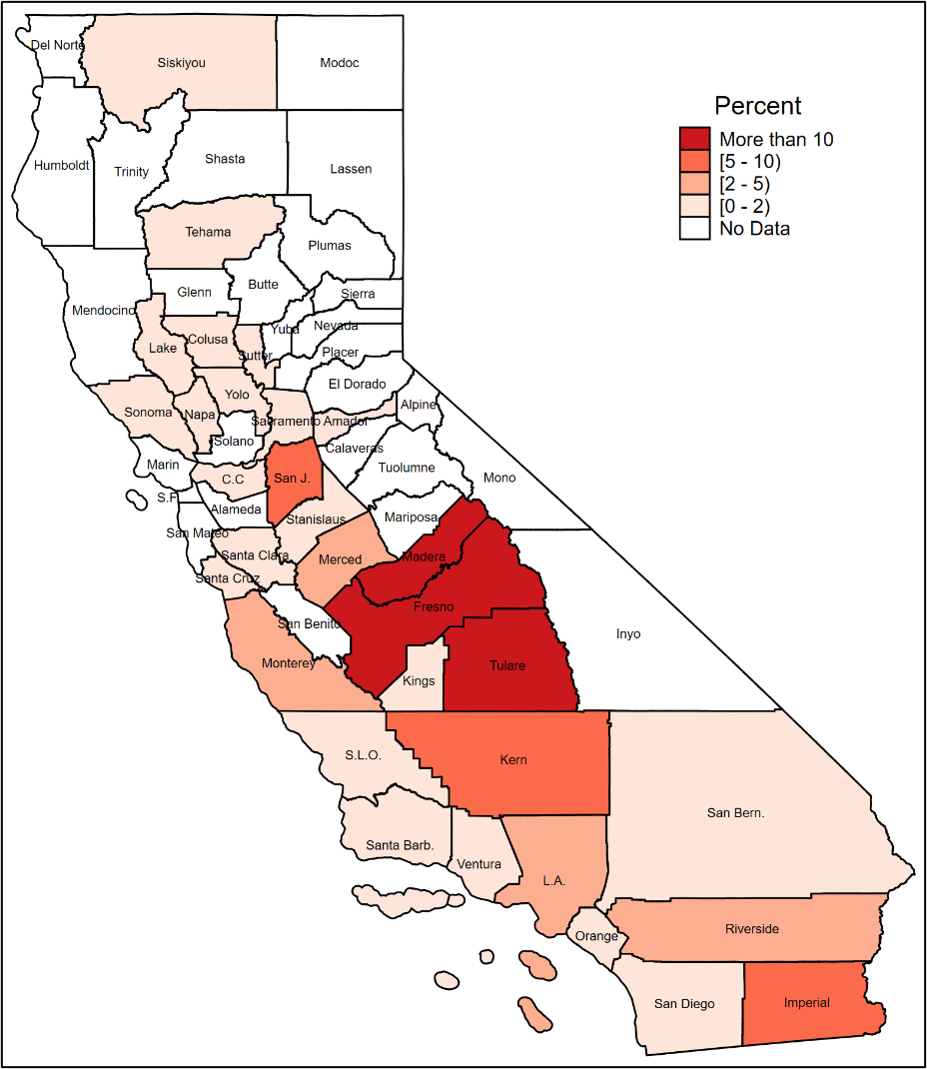
We calculated the probability that an investigation would find at least one violation in the top 10 agricultural counties in California.14 Table 5 shows that more than half of all agricultural investigations in each of these California counties found violations, ranging from roughly 60% of investigations in Imperial and Ventura counties to 80% or 90% in Fresno and Tulare counties.
Probability that federal employment law violations will be detected during an investigation by the Wage and Hour Division in California, by commodity or type of employment, fiscal year 2005–2019
| Commodity or type of employment | Probability of finding a violation |
|---|---|
| Vegetable and melon farming | 0.641*** |
| (0.029) | |
| Fruit and tree nut farming | 0.719*** |
| (0.018) | |
| Greenhouse, nursery, and floriculture production | 0.533*** |
| (0.065) | |
| Other crops | 0.644*** |
| (0.047) | |
| Animal production and aquaculture | 0.545*** |
| (0.067) | |
| Support activities for crop production (non-FLC) | 0.718*** |
| (0.035) | |
| Farm Labor Contractors | 0.845*** |
| (0.012) | |
| Number of violations | 2,132 |
Note: Heteroskedastic-robust are standard errors in parentheses. * p < .1, ** p < .05, *** p < .01. A p-value of less than .01 indicates that there is less than a 1% chance of falsely rejecting the null hypothesis that a coefficient is equal to zero. In other words, if p < .01, it is highly unlikely that the true share of employers within a North American Industry Classification System (NAICS) code that are guilty of at least one violation is equal to zero. Commodity and type of employment reflect corresponding NAICS codes associated with violations, or a combination of codes listed here: Vegetables and melon farming (1112); Fruit, tree, and nut farming (1113); Greenhouse, nursery, and floriculture production (1114); Animal production and aquaculture (112); Support activities for crop production (non-FLC) (1151 excluding 115115); and Other crops (1119, 1131, 11199, 111199, 111940, 111991, 111998). Non-FLC crop support services include cotton ginning, soil preparation, crop harvesting by machine, other post-harvest activities, and farm management services.
Source: Authors' analysis of U.S. Department of Labor, Wage and Hour Compliance Action Data (U.S. DOL-WHD 2020f).
Probability that federal employment law violations will be detected during an investigation by the Wage and Hour Division in California, by county, fiscal years 2005–2019
| California county | Probability of finding a violation |
|---|---|
| Fresno | 0.835*** |
| (0.025) | |
| Imperial | 0.614*** |
| (0.049) | |
| Kern | 0.766*** |
| (0.035) | |
| Monterey | 0.741*** |
| (0.038) | |
| Riverside | 0.623*** |
| (0.041) | |
| San Diego | 0.705*** |
| (0.069) | |
| San Joaquin | 0.635*** |
| (0.036) | |
| Santa Barbara | 0.788*** |
| (0.071) | |
| Tulare | 0.899*** |
| (0.026) | |
| Ventura | 0.581*** |
| (0.053) | |
| Number of violations | 1,222 |
Note: Heteroskedastic-robust are standard errors in parentheses. * p < .1, ** p < .05, *** p < .01. A p-value of less than .01 indicates that there is less than a 1% chance of falsely rejecting the null hypothesis that a coefficient is equal to zero. In other words, if p < .01, it is highly unlikely that the true share of employers within a county that are guilty of at least one violation is equal to zero. Non-FLC crop support services include cotton ginning, soil preparation, crop harvesting by machine, other post-harvest activities, and farm management services.
Source: Authors' analysis of U.S. Department of Labor, Wage and Hour Compliance Action Data (U.S. DOL-WHD 2020f).
Investigations and fines of repeat violators
One useful metric to determine whether WHD’s enforcement efforts are succeeding in educating and encouraging employers to follow the law is the degree to which individual employers continue to violate the law or come into compliance after repeat investigations. The WHD data allow us to track violations and fine amounts over time for employers that were investigated multiple times.
Our analysis of these data does not find any consistent compliance patterns for individual employers in terms of back wages owed per employee after repeat investigations. For example, some farm employers were investigated multiple times and never found to owe back wages, while others owed back wages in 75% or more of investigations. However, none of the employers investigated more than five times owed back wages after each investigation.
To illustrate this lack of a pattern, we show several agricultural employers in the Rio Grande Valley of Texas that were investigated more than 50 times between fiscal years 2005 and 2019. Figure O shows that J&D Produce (Little Bear) was investigated nearly 120 times, with two investigations finding average back wages owed to each affected employee of $46 and $113. Figure P shows that Frontera Produce was investigated more than 50 times and was assessed back wages of $471 per affected employee in only one investigation. Figure Q shows that Rio Fresh was investigated more than 60 times, and four times was found to owe back wages of $72, $28, $45, and $54 per affected employee—rather small amounts.
No consistent pattern of compliance for repeat violators: J&D Produce in Texas was investigated over 100 times during fiscal years 2005–2019
| Investigation number | Avg back wages per employee |
|---|---|
| 1 | $0 |
| 2 | $0 |
| 3 | $0 |
| 4 | $0 |
| 5 | $0 |
| 6 | $0 |
| 7 | $0 |
| 8 | $0 |
| 9 | $0 |
| 10 | $0 |
| 11 | $0 |
| 12 | $0 |
| 13 | $0 |
| 14 | $0 |
| 15 | $0 |
| 16 | $0 |
| 17 | $0 |
| 18 | $0 |
| 19 | $0 |
| 20 | $0 |
| 21 | $0 |
| 22 | $0 |
| 23 | $0 |
| 24 | $0 |
| 25 | $0 |
| 26 | $0 |
| 27 | $0 |
| 28 | $0 |
| 29 | $0 |
| 30 | $0 |
| 31 | $0 |
| 32 | $0 |
| 33 | $0 |
| 34 | $0 |
| 35 | $0 |
| 36 | $0 |
| 37 | $0 |
| 38 | $0 |
| 39 | $46 |
| 40 | $0 |
| 41 | $0 |
| 42 | $0 |
| 43 | $0 |
| 44 | $0 |
| 45 | $0 |
| 46 | $0 |
| 47 | $0 |
| 48 | $0 |
| 49 | $0 |
| 50 | $0 |
| 51 | $0 |
| 52 | $0 |
| 53 | $0 |
| 54 | $0 |
| 55 | $0 |
| 56 | $0 |
| 57 | $0 |
| 58 | $0 |
| 59 | $0 |
| 60 | $0 |
| 61 | $0 |
| 62 | $0 |
| 63 | $0 |
| 64 | $0 |
| 65 | $0 |
| 66 | $0 |
| 67 | $0 |
| 68 | $0 |
| 69 | $0 |
| 70 | $0 |
| 71 | $0 |
| 72 | $0 |
| 73 | $0 |
| 74 | $0 |
| 75 | $0 |
| 76 | $0 |
| 77 | $0 |
| 78 | $0 |
| 79 | $0 |
| 80 | $0 |
| 81 | $0 |
| 82 | $0 |
| 83 | $0 |
| 84 | $0 |
| 85 | $0 |
| 86 | $0 |
| 87 | $0 |
| 88 | $0 |
| 89 | $0 |
| 90 | $0 |
| 91 | $0 |
| 92 | $0 |
| 93 | $0 |
| 94 | $0 |
| 95 | $0 |
| 96 | $0 |
| 97 | $0 |
| 98 | $0 |
| 99 | $0 |
| 100 | $0 |
| 101 | $0 |
| 102 | $0 |
| 103 | $0 |
| 104 | $0 |
| 105 | $0 |
| 106 | $0 |
| 107 | $0 |
| 108 | $0 |
| 109 | $113 |
| 110 | $0 |
| 111 | $0 |
| 112 | $0 |
| 113 | $0 |
| 114 | $0 |
| 115 | $0 |
| 116 | $0 |
Note: Dollar amounts are adjusted for inflation to constant 2019 dollars using the CPI-U-RS. Number of Wage and Hour Division investigations and average back wages per employee owed for this employer between FY05 and FY19.
Source: Authors' analysis of U.S. Department of Labor, Wage and Hour Compliance Action Data (U.S. DOL-WHD 2020f).
No consistent pattern of compliance for repeat violators: Frontera Produce in Texas was investigated over 50 times during fiscal years 2005–2019
| Investigation number | Avg back wages per employee |
|---|---|
| 1 | $0 |
| 2 | $0 |
| 3 | $0 |
| 4 | $0 |
| 5 | $0 |
| 6 | $0 |
| 7 | $0 |
| 8 | $0 |
| 9 | $0 |
| 10 | $0 |
| 11 | $0 |
| 12 | $0 |
| 13 | $0 |
| 14 | $0 |
| 15 | $0 |
| 16 | $0 |
| 17 | $0 |
| 18 | $0 |
| 19 | $471 |
| 20 | $0 |
| 21 | $0 |
| 22 | $0 |
| 23 | $0 |
| 24 | $0 |
| 25 | $0 |
| 26 | $0 |
| 27 | $0 |
| 28 | $0 |
| 29 | $0 |
| 30 | $0 |
| 31 | $0 |
| 32 | $0 |
| 33 | $0 |
| 34 | $0 |
| 35 | $0 |
| 36 | $0 |
| 37 | $0 |
| 38 | $0 |
| 39 | $0 |
| 40 | $0 |
| 41 | $0 |
| 42 | $0 |
| 43 | $0 |
| 44 | $0 |
| 45 | $0 |
| 46 | $0 |
| 47 | $0 |
| 48 | $0 |
| 49 | $0 |
| 50 | $0 |
| 51 | $0 |
| 52 | $0 |
| 53 | $0 |
Note: Dollar amounts are adjusted for inflation to constant 2019 dollars using the CPI-U-RS. Number of Wage and Hour Division investigations and average back wages per employee owed for this employer between FY05 and FY19.
Source: Authors' analysis of U.S. Department of Labor, Wage and Hour Compliance Action Data (U.S. DOL-WHD 2020f).
No consistent pattern of compliance for repeat violators: Rio Fresh in Texas was investigated almost 70 times during fiscal years 2005–2019
| Investigation number | Avg back wages per employee |
|---|---|
| 1 | $0 |
| 2 | $0 |
| 3 | $0 |
| 4 | $0 |
| 5 | $0 |
| 6 | $0 |
| 7 | $0 |
| 8 | $0 |
| 9 | $0 |
| 10 | $0 |
| 11 | $0 |
| 12 | $0 |
| 13 | $0 |
| 14 | $0 |
| 15 | $0 |
| 16 | $72 |
| 17 | $0 |
| 18 | $0 |
| 19 | $0 |
| 20 | $0 |
| 21 | $0 |
| 22 | $0 |
| 23 | $0 |
| 24 | $0 |
| 25 | $0 |
| 26 | $0 |
| 27 | $0 |
| 28 | $0 |
| 29 | $0 |
| 30 | $0 |
| 31 | $0 |
| 32 | $0 |
| 33 | $0 |
| 34 | $0 |
| 35 | $28 |
| 36 | $0 |
| 37 | $0 |
| 38 | $0 |
| 39 | $0 |
| 40 | $0 |
| 41 | $0 |
| 42 | $0 |
| 43 | $0 |
| 44 | $0 |
| 45 | $45 |
| 46 | $54 |
| 47 | $0 |
| 48 | $0 |
| 49 | $0 |
| 50 | $0 |
| 51 | $0 |
| 52 | $0 |
| 53 | $0 |
| 54 | $0 |
| 55 | $0 |
| 56 | $0 |
| 57 | $0 |
| 58 | $0 |
| 59 | $0 |
| 60 | $0 |
| 61 | $0 |
| 62 | $0 |
| 63 | $0 |
| 64 | $0 |
| 65 | $0 |
| 66 | $0 |
Note: Dollar amounts are adjusted for inflation to constant 2019 dollars using the CPI-U-RS. Number of Wage and Hour Division investigations and average back wages per employee owed for this employer between FY05 and FY19.
Source: Authors' analysis of U.S. Department of Labor, Wage and Hour Compliance Action Data (U.S. DOL-WHD 2020f).
Figures O–Q show there was no pattern to back wages owed per affected employee for farms that were investigated multiple times. For example, J&D Produce was investigated more than 40 times before any back wages were found to be owed, and then investigated another 60 times before more back wages were found to be owed. The data do not indicate a declining pattern of back wages owed as farms came into compliance; sometimes zero back wages were owed after an investigation, punctuated by one or two subsequent investigations that found back wages owed.
Stockton, California-based FLC Jose M. Magdaleno was the most investigated agricultural employer in the state. Figure R shows that the first five investigations of Magdaleno found back wages of up to $320 per employee due, after which there were 10 investigations with no back wages assessed, followed by a more recent investigation that found back wages of $94 owed per affected employee. While the amount of back wages associated with Magdaleno had a general downward trend, the most recent investigations still found significant amounts of back wages owed to workers. Some California farm employers, including Sun World International, Richard Bagdasarian Inc., and OM Contracting, were investigated more than five times, and no back wages were found to be owed to employees.
No consistent pattern of compliance for farm labor contractors who are repeat violators: Jose M. Magdaleno in California was investigated 16 times during fiscal years 2005–2019
| Investigation number | Avg back wages per employee |
|---|---|
| 1 | $198 |
| 2 | $169 |
| 3 | $209 |
| 4 | $321 |
| 5 | $237 |
| 6 | $0 |
| 7 | $0 |
| 8 | $0 |
| 9 | $0 |
| 10 | $0 |
| 11 | $0 |
| 12 | $0 |
| 13 | $0 |
| 14 | $0 |
| 15 | $0 |
| 16 | $94 |
Note: Dollar amounts are adjusted for inflation to constant 2019 dollars using the CPI-U-RS. Number of Wage and Hour Division investigations and average back wages per employee owed for this employer between FY05 and FY19.
Source: Authors' analysis of U.S. Department of Labor, Wage and Hour Compliance Action Data (U.S. DOL-WHD 2020f).
As noted, FLCs account for 14% of average employment in U.S. agriculture but for one-quarter of the federal employment law violations found in U.S. agriculture, and about one-half of the violations found in California agriculture. However, most of the FLCs that were investigated more than five times between fiscal years 2005 and 2019 had zero violations. For example, the same data set used to create the figures showed that Delano-based Roberto Ramirez was investigated 15 times and had zero back wages assessed. Figure S shows that Jaime Ybarra owed zero back wages after the first eight investigations, but was found to owe more than $1,600 and $1,200 per employee during the ninth and 11th investigations, respectively.
No consistent pattern of compliance for farm labor contractors who are repeat violators: Jaime Ybarra in Texas was investigated 12 times during fiscal years 2005–2019
| Investigation number | Avg back wages per employee |
|---|---|
| 1 | $0 |
| 2 | $0 |
| 3 | $0 |
| 4 | $0 |
| 5 | $0 |
| 6 | $0 |
| 7 | $0 |
| 8 | $0 |
| 9 | $1,603 |
| 10 | $0 |
| 11 | $1,238 |
| 12 | $0 |
Note: Dollar amounts are adjusted for inflation to constant 2019 dollars using the CPI-U-RS. Number of Wage and Hour Division investigations and average back wages per employee owed for this employer between FY05 and FY19.
Source: Authors' analysis of U.S. Department of Labor, Wage and Hour Compliance Action Data (U.S. DOL-WHD 2020f).
The other questions we examined with these data relate to civil money penalties (CMP), which are monetary fines levied by WHD to deter employers from violating employment laws. There is little evidence that stiffer penalties have been associated with increased compliance with federal employment laws, but Galvin (2016) found that stiffer penalties and more robust enforcement at the state level is associated with a lower incidence of wage and hour violations. We first asked whether the amount of total CMPs assessed in an initial investigation reduced the probability of an employer being investigated again, and then, for employers found in violation of at least one employment law, whether the amount of CMPs owed in the first case with violations reduced their probability of being found in violation in a subsequent investigation. We confined the analysis to the 10 states with the most employment law violations in agriculture; they collectively account for half of the agricultural investigations in the WHD database.15
We constructed two dependent variables and two explanatory variables. The first dependent variable takes on the value of 1 if an employer was investigated more than one time and zero otherwise, while the second only includes employers found in violation of employment laws in at least one investigation, and takes on the value of 1 if the employer was found in violation of employment laws during at least two separate investigations and zero otherwise—that is, the subset of employers that were repeat offenders. The main explanatory variable used with the first dependent variable was the amount of CMPs owed by each employer (including $0 amounts) during their first investigation, and the main explanatory variable used with the second dependent variable identifies the amount of CMPs owed by each employer (including $0 amounts) during their first investigation with violations.
Table 6 presents the results for the repeat investigation analysis, and Table 7 presents the results from the repeat offender analysis. The results in column (1) in the tables are from simple regressions that do not include any control variables, while the results in column (2) are from regressions that include year fixed effects, which control for unobserved factors that are common to all employers within each year (such as changes to federal immigration policy that affect all employers). The results in column (3) are from regressions that also include state fixed effects to control for unobserved factors that are common to all employers within a state (such as the state minimum wage).
Correlations for repeat investigations of agricultural employers by the Wage and Hour Division, fiscal years 2005–2019
| (1)
Repeat investigation |
(2)
Repeat investigation |
(3)
Repeat investigation |
|
|---|---|---|---|
| Civil money penalties assessed (in $1000s) | 0.00006 | 0.00011 | 0.00014 |
| (0.00014) | (0.00016) | (0.00016) | |
| N | 8,833 | 8,833 | 8,833 |
| Year fixed effects | No | Yes | Yes |
| State fixed effects | No | No | Yes |
Note: Dollar amounts used in this analysis are adjusted for inflation to constant 2019 dollars using the CPI-U-RS. Heteroskedastic-robust standard errors in parentheses. * p < .1, ** p < .05, *** p < .01. P-values greater than .1 indicate that we are unable to reject the null hypothesis that the statistical association between the explanatory variables and the dependent variable is equal to zero at a 90% level of confidence. N represents the number of employers in the top 10 violating states that were investigated at least once by the Wage and Hour Division.
Source: Authors' analysis of U.S. Department of Labor, Wage and Hour Compliance Action Data (U.S. DOL-WHD 2020f).
Correlations for repeat violations by agricultural employers that were detected by the Wage and Hour Division, fiscal years 2005–2019
| (1)
Repeat investigation |
(2)
Repeat investigation |
(3)
Repeat investigation |
|
|---|---|---|---|
| Civil money penalties assessed (in $1000s) | 0.00014 | 0.00016 | 0.00019 |
| (0.00017) | (0.00018) | (0.00018) | |
| N | 6,662 | 6,662 | 6,662 |
| Year fixed effects | No | Yes | Yes |
| State fixed effects | No | No | Yes |
Note: Dollar amounts used in this analysis are adjusted for inflation to constant 2019 dollars using the CPI-U-RS. Heteroskedastic-robust standard errors in parentheses. * p < .1, ** p < .05, *** p < .01. P-values greater than .1 indicate that we are unable to reject the null hypothesis that the statistical association between the explanatory variables and the dependent variable is equal to zero at a 90% level of confidence. N represents the number of employers in the top 10 violating states who were investigated at least once by the Wage and Hour Division and were also found to be in violation of at least one employment law.
Source: Authors' analysis of U.S. Department of Labor, Wage and Hour Compliance Action Data (U.S. DOL-WHD 2020f).
Table 6 reveals a positive correlation between the amount of CMPs owed and the probability of being investigated again, but the coefficients are very small and not statistically significant at conventional levels of confidence. Table 7 also shows that there is a positive correlation between the amount of CMPs owed and the probability of being a repeat offender, but these coefficients also are close to zero and are not statistically significant. These results suggest that the total amount of CMPs assessed is not statistically linked to a reduction in the probability of being a repeat employment law violator, perhaps because CMP amounts are set too low to deter future violations.
Understanding the impact of the ‘bad apple’ farm employers
We define a “bad apple” as a single employer with a large number of violations or a high share of all violations within a particular industry subsector NAICS code or commodity. The enforcement data show that the bad apple employers account for a disproportionate share of all employment law violations found in every NAICS code between fiscal years 2005 and 2019, including FLCs. In fact, the top 10 violators in a NAICS code, who account for far less than 1% of all investigations in that NAICS code, typically account for 10% to 30% of all violations. Table 8 shows that the 10 farm employers with the most violations accounted for 14% of all agricultural violations found throughout U.S. agriculture, 5% of the back wages owed, and 3% of the CMPs owed.
Top 10 agricultural employers by number of employment law violations detected, fiscal years 2005–2019
| Employer | Number of investigations | Number of violations | Share of violations | Total back wages owed | Share of back wages owed | Total civil money penalties (CMP) assessed | Share of FLC CMPs assessed |
|---|---|---|---|---|---|---|---|
| Perdue Foods, Inc. | 1 | 20,002 | 7.4% | $0 | 0.0% | $0 | 0.0% |
| George’s Processing, Incorporated | 1 | 3,148 | 1.2% | $1,582,914 | 2.5% | $0 | 0.0% |
| Symms Fruit Farm, Inc. | 1 | 3,001 | 1.1% | $0 | 0.0% | $0 | 0.0% |
| Sierra Cascade Nursery, Inc | 2 | 2,706 | 1.0% | $367,546 | 0.6% | $722,414 | 1.4% |
| Global Horizons Inc. | 9 | 1,778 | 0.7% | $164,259 | 0.3% | $0 | 0.0% |
| Urenda’s Farm and Forest Contractors, Inc. | 2 | 1,645 | 0.6% | $0 | 0.0% | $2,789 | 0.0% |
| B & G Ditchen, LLC | 1 | 1,625 | 0.6% | $192,961 | 0.3% | $14,511 | 0.0% |
| Blue Mountain Farms, LLC | 1 | 1,590 | 0.6% | $184,900 | 0.3% | $0 | 0.0% |
| Western Range Association | 13 | 1,574 | 0.6% | $311,798 | 0.5% | $142,775 | 0.3% |
| A. Oseguera Company, Inc | 7 | 1,554 | 0.6% | $353,951 | 0.6% | $860,530 | 1.6% |
| Total (top 10 violators in ag) | 38 | 38,623 | 14.4% | $3,158,329 | 5.0% | $1,743,019 | 3.3% |
| Total (all ag employers) | 19,253 | 269,137 | 100.0% | $62,653,976 | 100.0% | $53,471,864 | 100.0% |
Notes: Dollar amounts have been adjusted for inflation to 2019 constant dollar amounts using the CPI-U-RS. These figures were generated using the statistical software program Stata. The software code and source data files are available upon request.
Source: Authors' analysis of U.S. Department of Labor, Wage and Hour Compliance Action Data (U.S. DOL-WHD 2020f).
A similar pattern emerges when looking at the data on FLC violations. Between fiscal years 2005 and 2019, there were 4,900 investigations of FLCs with six-digit 115115 NAICS codes across the United States. These investigations found 65,000 total violations, but as Table 9 shows, just 10 FLCs accounted for 16% of all violations and 10% of the back wages owed. The top four accounted for 9% of all FLC violations: Urenda’s Farm and Forest Contractors in Oregon, Global Horizons Inc. (operating in several states), T Bell Detasseling in Iowa, and Escamilla & Sons in Arizona.16
Top 10 U.S. farm labor contractors by number of employment law violations detected, fiscal year 2005–2019
| Employer | Number of investigations | Number of violations | Share of violations | Total back wages owed | Share of back wages owed | Total civil money penalties (CMP) assessed | Share of FLC CMPs assessed |
|---|---|---|---|---|---|---|---|
| Urenda’s Farm and Forest Contractors, Inc. | 2 | 1645 | 2.5% | $0 | 0.0% | $2,789 | 0.0% |
| Global Horizons Inc. | 6 | 1625 | 2.5% | $164,259 | 2.3% | $0 | 0.0% |
| T Bell Detasseling LLC | 1 | 1413 | 2.2% | $0 | 0.0% | $0 | 0.0% |
| Escamilla & Sons, Inc. | 1 | 1140 | 1.8% | $192,174 | 2.7% | $47,602 | 0.3% |
| Overlook Harvesting Company LLC | 3 | 807 | 1.2% | $107,995 | 1.5% | $1,116 | 0.0% |
| M & L Contractors, LLC | 2 | 799 | 1.2% | $17,797 | 0.2% | $5,002 | 0.0% |
| Cal West Farm Management, Inc. | 2 | 776 | 1.2% | $55,182 | 0.8% | $2,934 | 0.0% |
| Sunshine Agricultural Services | 2 | 674 | 1.0% | $64,518 | 0.9% | $1,759 | 0.0% |
| EAM Harvesting Inc | 1 | 662 | 1.0% | $47,096 | 0.7% | $6,007 | 0.0% |
| Vasquez Citrus & Hauling, Inc. | 1 | 568 | 0.9% | $56,476 | 0.8% | $4,856 | 0.0% |
| Total (top 10 FLC violators) | 21 | 10,109 | 15.5% | $705,497 | 9.9% | $72,065 | 0.5% |
| Total (all FLCs) | 4,893 | 65,135 | 100.0% | $7,150,330 | 100.0% | $13,928,818 | 100.0% |
Notes: Dollar amounts have been adjusted for inflation to 2019 constant dollar amounts using the CPI-U-RS. These figures were generated using the statistical software program Stata. The software code and source data files are available upon request.
Source: Authors' analysis of U.S. Department of Labor, Wage and Hour Compliance Action Data (U.S. DOL-WHD 2020f).
We also examined the outcomes of FLC investigations in California and found a similar pattern. There were 850 total investigations of California FLCs (115115) between fiscal years 2005 and 2019 that found a total of nearly 19,000 violations. Fifteen percent of California FLC investigations found zero violations while 85% found a violation: 9% were found to have one violation, and more than half found five or more violations (U.S. DOL-WHD 2020f). Table 10 shows that 10 FLCs accounted for more than one-quarter of the 19,000 total violations found to have been committed by FLCs in California and 22% of the back wages owed as a result of those violations. Cal West Farm Management Inc. had the most violations, 776, while Global Horizons Inc. owed the most in back wages, $164,000 (in $2019).
Top 10 farm labor contractors in California by number of employment law violations detected, fiscal years 2005–2019
| Employer | Number of investigations | Number of violations | Share of violations | Total back wages owed | Share of back wages owed | Total civil money penalties (CMP) assessed | Share of farm labor contractor’s civil monetary penalties assessed |
|---|---|---|---|---|---|---|---|
| Cal West Farm Management, Inc. | 2 | 776 | 4.2% | $55,182 | 2.8% | $2,934 | 0.1% |
| Global Horizons Inc. | 3 | 679 | 3.6% | $164,259 | 8.2% | $0 | 0.0% |
| Sunshine Agricultural Services | 2 | 674 | 3.6% | $64,518 | 3.2% | $1,759 | 0.0% |
| Benito Veliz Carrillo dba: E C Labor | 2 | 550 | 2.9% | $10,767 | 0.5% | $3,708 | 0.1% |
| Cruzberto Barajas-Angel | 1 | 540 | 2.9% | $19,611 | 1.0% | $2,905 | 0.1% |
| Esparza Enterprises, Inc | 8 | 494 | 2.6% | $45,657 | 2.3% | $10,731 | 0.3% |
| Juan Luis Ayala Lopez-FLC | 1 | 409 | 2.2% | $23,816 | 1.2% | $4,785 | 0.1% |
| LLamas Ag, Inc. | 1 | 391 | 2.1% | $28,052 | 1.4% | $3,554 | 0.1% |
| Nextcrop | 1 | 384 | 2.1% | $14,635 | 0.7% | $21,464 | 0.6% |
| Cruz Lopez, Domingo Eustacio FLC | 1 | 327 | 1.7% | $8,264 | 0.4% | $1,785 | 0.0% |
| Total (top 10 CA FLC violators) | 22 | 5,224 | 27.9% | $434,763 | 21.7% | $53,625 | 1.4% |
| Total (all CA FLCs) | 853 | 18,691 | 100.0% | $2,006,531 | 100.0% | $3,769,420 | 100.0% |
Notes: Dollar amounts have been adjusted for inflation to 2019 constant dollar amounts using the CPI-U-RS. These figures were generated using the statistical software program Stata. The software code and source data files are available upon request.
Source: Authors' analysis of U.S. Department of Labor, Wage and Hour Compliance Action Data (U.S. DOL-WHD 2020f).
Some employers had zero violations each time they were investigated, some were investigated many times and had violations during a few of these investigations, and some had violations almost every time they were investigated. Twenty-four percent of the investigations found violations that did not result in back wages or civil money penalties owed (see Table 11). Of the investigations that found at least one violation but did not result in back wages or civil money penalties owed, 64% found violations of MSPA, 35% found violations of FLSA, and 15% found violations of H-2A laws.17 (These percentages add up to more than 100% because some investigations detected violations of more than one law.) We do not know enough about the cases to explain why so many violations do not result in back wages or CMPs owed.
Summary of investigations that detected violations but where no back wages or civil money penalties were owed
| Type of violation without BWs/CMPs owed | Number of investigations | % of all investigations | % of investigations without BWs/CMPs owed |
|---|---|---|---|
| Migrant and Seasonal Agricultural Worker Protection Act | 2966 | 15% | 64% |
| Fair Labor Standards Act | 1644 | 9% | 35% |
| H-2A | 700 | 4% | 15% |
| Total | 4631 | 24% | 100% |
Note: BW represents back wages and CMP represents civil money penalties. Some investigations detected violations of multiple employment laws, thus percentages in the last column add up to more than 100%. The total in the last row of the table includes all investigations that found at least one violation but resulted in zero back wages or civil money penalties being owed.
Source: Authors' analysis of U.S. Department of Labor, Wage and Hour Compliance Action Data (U.S. DOL-WHD 2020f).
The next two figures highlight the bad apple issue by showing that the top 5% of wage and hour violators in agriculture, as measured by the number of violations, account for half or more of all the violations found in a particular agricultural NAICS code, either a commodity or for FLCs. (The Appendix provides additional examples for other agricultural NAICS codes.)
Figure T shows that 30% of the U.S. crop farms investigated between fiscal years 2005 and 2019 had zero violations, while the 5% of U.S. crop farms with the most violations accounted for almost 70% of all violations detected on U.S. crop farms. Figure U shows the same pattern for FLCs, with the top 5% of FLCs measured by violations accounting for 65% of all violations among FLCs. For other individual commodities and agricultural NAICS codes, as shown in the figures in the Appendix, the top 5% of employers with the most violations accounted for 47% to 87% of all violations.
The 5% of U.S. crop farms with the most employment law violations detected by Wage and Hour Division investigations accounted for 70% of all violations found to have been committed on U.S. crop farms during fiscal years 2005–2019
| % of farms investigated (ranked by number of violations) | % of violations |
|---|---|
| 95%-100% | 68.6% |
| 91%-95% | 11.9% |
| 86%-90% | 5.8% |
| 81%-85% | 3.4% |
| 76%-80% | 2.4% |
| 71%-75% | 1.9% |
| 66%-70% | 1.5% |
| 61%-65% | 1.3% |
| 56%-60% | 0.9% |
| 51%-55% | 0.8% |
| 46%-50% | 0.5% |
| 41%-45% | 0.4% |
| 36%-40% | 0.4% |
| 31%-35% | 0.2% |
| 6%-10% | 0.0% |
| 26%-30% | 0.0% |
| 21%-25% | 0.0% |
| 16%-20% | 0.0% |
| 11%-15% | 0.0% |
| 1%-5% | 0.0% |
Note: There were 10,672 investigations of U.S. crop farms between fiscal year 2005 and fiscal year 2019, excluding those associated with farm labor contractors.
Source: Authors' analysis of U.S. Department of Labor, Wage and Hour Compliance Action Data (U.S. DOL-WHD 2020f).
The 5% of U.S. farm labor contractors (FLCs) with the most employment law violations detected by Wage and Hour Division investigations accounted for 65% of all violations found to have been committed by FLCs during fiscal years 2005–2019
| % of farms investigated (ranked by number of violations) | % of violations |
|---|---|
| 95%–100% | 65.1% |
| 91%–95% | 11.7% |
| 86%–90% | 5.6% |
| 81%–85% | 3.8% |
| 76%–80% | 3.0% |
| 71%–75% | 2.4% |
| 66%–70% | 1.9% |
| 61%–65% | 1.6% |
| 56%–60% | 1.3% |
| 51%–55% | 1.1% |
| 46%–50% | 0.8% |
| 41%–45% | 0.7% |
| 36%–40% | 0.4% |
| 31%–35% | 0.4% |
| 26%–30% | 0.3% |
| 21%–25% | 0.0% |
| 16%–20% | 0.0% |
| 11%–15% | 0.0% |
| 6%–10% | 0.0% |
| 1%–5% | 0.0% |
Note: There were 4,519 investigations of U.S. FLCs between fiscal year 2005 and fiscal year 2019.
Source: Authors' analysis of U.S. Department of Labor, Wage and Hour Compliance Action Data (U.S. DOL-WHD 2020f).
Comparing shares of violations and employment by commodity
WHD investigators record the major commodity (by NAICS code) of the employer being investigated or whether the employer was an FLC. We summed violations by NAICS code between fiscal years 2005 and 2019 and compared the share of violations in each commodity with its share of average employment in 2019 from the Quarterly Census of Employment and Wages—FLCs are not a commodity, so we separated them out for comparison.18 The results are in Table 12, and they show that some commodities that account for a very small share of farm employment, as with sheepherding and forestry, account for a high share of farm labor violations found, so that their share of violations is four to eight times their share of employment. (In Table 12, a ratio that exceeds 100% means that the commodity or NAICS category has a higher share of violations than its share of agricultural employment.)
Share of wage and hour violations and share of employment by commodity and farm labor contractors, fiscal years 2005–2019
| North American Industry Classification System code | Violations | Share of violations | Average QCEW employment (2019) | Share of employment | Share of employment with violations |
|---|---|---|---|---|---|
| 1111 Grain Crops | 3,572 | 1.3% | 54,657 | 4.3% | 31% |
| 1112 Veg and Melon Crops | 40,046 | 14.9% | 89,582 | 7.1% | 210% |
| 1113 Fruit and Nut Crops | 54,465 | 20.2% | 176,405 | 14.0% | 145% |
| 1114 Nursery Crops | 15,094 | 5.6% | 161,272 | 12.8% | 44% |
| 1119 Other Crops | 23,713 | 8.8% | 64,634 | 5.1% | 172% |
| 1121 Cattle & Dairy | 1,954 | 0.7% | 159,234 | 12.6% | 6% |
| 1122 Hogs and Pigs | 948 | 0.4% | 31,004 | 2.5% | 14% |
| 1123 Poultry and Eggs | 27,361 | 10.2% | 45,994 | 3.6% | 279% |
| 1124 Sheep and Goats | 2,540 | 0.9% | 1,522 | 0.1% | 784% |
| 1125 Aquaculture | 1,165 | 0.4% | 7,071 | 0.6% | 77% |
| 1129 Other Animal | 2,464 | 0.9% | 20,259 | 1.6% | 57% |
| 1131 Timber Tract | 1,077 | 0.4% | 2,967 | 0.2% | 170% |
| 1132 Forest Nursery | 1,870 | 0.7% | 2,052 | 0.2% | 428% |
| 1133 Logging | 2,522 | 0.9% | 48,257 | 3.8% | 25% |
| 1141 Fishing | 311 | 0.1% | 6,665 | 0.5% | 22% |
| 1142 Hunting and Trapping | 146 | 0.1% | 1,908 | 0.2% | 36% |
| 1151 Crop Support | 80,169 | 29.8% | 342,323 | 27.1% | 110% |
| 1152 Animal Support | 924 | 0.3% | 30,622 | 2.4% | 14% |
| 1153 Forestry Support | 8,796 | 3.3% | 17,277 | 1.4% | 239% |
| Total | 269,137 | 100.0% | 1,263,705 | 100.0% | 100% |
| 115115 Farm Labor Contactors | 65,135 | 24.2% | 181,322 | 14.3% | 169% |
Note: This table compares the share of Wage and Hour Division violations found in a 4-digit NAICS between fiscal year 2005 and 2019 with the share of average agricultural employment in that 4-digit NAICS in 2019. A ratio that exceeds 100 percent means that the commodity or NAICS category has a higher share of violations than its share of agricultural employment. For example, the share of violations found in sheep and goats was almost eight times the sheep and goat share of employment.
Source: Authors' analysis of U.S. Department of Labor, Wage and Hour Compliance Action Data (U.S. DOL-WHD 2020f) and Bureau of Labor Statistics, Quarterly Census of Employment and Wages data for North American Industry Classification System code 11, agriculture, in 2018 (BLS-QCEW 2020a).
The share of WHD violations found in NAICS 1124, Sheep and Goats, is eight times the sheep and goats’ share of QCEW employment. Many sheep and goat farmers rely on H-2A workers from Peru and other countries to tend their sheep, often on public lands. Two associations, Mountain Plains Agricultural Services and the Western Range Association, handle recruitment and paperwork for their member farmers, most of whom employ fewer than five H-2A sheepherders (each of whom is usually provided with a mobile trailer to tend a flock of around 1,000 sheep).
The NAICS category with the next largest share of violations—two to four times its share of employment—was 1132, Forest Nurseries and Gathering of Forest Products, and 1153, Support Activities for Forestry. Almost all of the violations in NAICS 1123, Poultry and Egg Production, were at a single Perdue Farms facility.
The share of violations was twice the share of employment in Vegetable and Melon Farming, NAICS 1112. Other commodities with a higher share of violations compared with their share of employment include the “other crop farming” classification,19 timber tract operations, and fruit and nut crops. For farm labor contractors, NAICS 115115, the share of violations was 1.7 times their share of employment. For crop support services, which include FLCs as well as custom fertilizer and combining businesses and farm management companies, the share of violations was 1.1 times their share of employment, likely reflecting FLC violations.
Commodities with very low shares of violations relative to their share of employment include cattle and dairy, hogs and pigs, and animal support services. The relatively small logging, fishing, and hunting and trapping sectors also had a smaller share of violations compared with their share of agricultural employment.
We can make the same comparisons between the share of violations and the share of employment by NAICS code for individual states, which we have done here for California and Florida. WHD detected 39,300 violations of employment laws in California agriculture between fiscal years 2005 and 2019; average QCEW agricultural employment in California agriculture was 423,935 in 2019.
In California, shares of employment law violations by commodity or by FLCs differ from shares of employment. Table 13 shows the share of violations and the share of employment by commodity in California, as well as for FLCs. Almost half of the violations discovered by WHD in California agriculture were found to have been committed by FLCs, which accounted for 36% of QCEW employment, making the ratio of the FLC share of violations to the FLC share of employment 1.3. (However, if the violations committed by FLCs were categorized under their corresponding commodity, the violations found in those commodities would be proportionally higher.)
Share of wage and hour violations and share of employment by commodity and farm labor contractors in California, fiscal years 2005–2019
| North American Industry Classification System code | Violations | Share of violations | Average QCEW employment (2019) | Share of employment | Share of employment with violations |
|---|---|---|---|---|---|
| 1111 Grain Crops | 13 | 0.03% | 2,954 | 0.70% | 5% |
| 1112 Veg and Melon Crops | 3,721 | 9.46% | 30,305 | 7.15% | 132% |
| 1113 Fruit and Nut Crops | 10,451 | 26.58% | 93,178 | 21.98% | 121% |
| 1114 Nursery Crops | 646 | 1.64% | 26,954 | 6.36% | 26% |
| 1119 Other Crops | 2,016 | 5.13% | 9,511 | 2.24% | 229% |
| 1121 Cattle/Dairy | 11 | 0.03% | 22,362 | 5.27% | 1% |
| 1122 Hogs and Pigs | 0 | 0.00% | 142 | 0.03% | 0% |
| 1123 Poultry and Eggs | 13 | 0.03% | 2,561 | 0.60% | 5% |
| 1124 Sheep and Goats | 83 | 0.21% | 369 | 0.09% | 243% |
| 1125 Aquaculture | 21 | 0.05% | 484 | 0.11% | 47% |
| 1129 Other Animal | 413 | 1.05% | 2,301 | 0.54% | 194% |
| 1131 Timber Tract | 185 | 0.47% | 26 | 0.01% | 7671% |
| 1132 Forest Nursery | 173 | 0.44% | 222 | 0.05% | 840% |
| 1133 Logging | 15 | 0.04% | 1,983 | 0.47% | 8% |
| 1141 Fishing | 0 | 0.00% | 411 | 0.10% | 0% |
| 1142 Hunting and Trapping | 0 | 0.00% | 57 | 0.01% | 0% |
| 1151 Crop Support | 19,797 | 50.35% | 225,097 | 53.10% | 95% |
| 1152 Animal Support | 244 | 0.62% | 2,987 | 0.70% | 88% |
| 1153 Forestry Support | 1,520 | 3.87% | 2,031 | 0.48% | 807% |
| Total | 39,322 | 100.00% | 423,935 | 100.00% | 100% |
| 115115 Farm Labor Contactors | 18,691 | 47.53% | 150,648 | 35.54% | 134% |
Note: This table compares the share of Wage and Hour Division violations found in a 4-digit NAICS between fiscal year 2005 and 2019 with the share of average agricultural employment in that 4-digit NAICS in 2019. A ratio that exceeds 100 percent means that the commodity or NAICS category has a higher share of violations than its share of agricultural employment.
Source: Authors' analysis of U.S. Department of Labor, Wage and Hour Compliance Action Data (U.S. DOL-WHD 2020f) and Bureau of Labor Statistics, Quarterly Census of Employment and Wages data for North American Industry Classification System code 11, agriculture, in 2018 (BLS-QCEW 2020a).
Table 13 shows that the highest ratio of share of violations to share of employment was in timber tract operations, where WHD found 185 violations over 15 years even though employment in timber tract operations averaged only 26 in 2019. Forest nursery and forestry support were similar: each had high shares of total violations and a very low share of average employment. Sheep and goats, other crops (which includes tobacco and cotton), and other animals (which includes horses) also had shares of total violations that were twice their share of employment. Fruit and nut crops, and vegetables and melon crops, had shares of violations that were 20% to 30% higher than their share of average employment.
Table 14 shows the share of violations and share of employment by commodity in Florida, as well as for FLCs. Average QCEW agricultural employment in Florida agriculture in 2019 was 67,300; Table 14 shows that WHD detected 38,300 violations in Florida agriculture between fiscal years 2005 and 2019.
Share of wage and hour violations and share of employment by commodity and farm labor contractors in Florida, fiscal years 2005–2019
| North American Industry Classification Code | Violations | Share of violations | Average QCEW employment (2019) | Share of employment | Ratio: violations/employment |
|---|---|---|---|---|---|
| 1111 Grain Crops | 318 | 0.83% | 130 | 0.19% | 429% |
| 1112 Veg and Melon Crops | 4,452 | 11.61% | 10,888 | 16.18% | 72% |
| 1113 Fruit and Nut Crops | 11,356 | 29.62% | 6,223 | 9.25% | 320% |
| 1114 Nursery Crops | 193 | 0.50% | 23,715 | 35.25% | 1% |
| 1119 Other Crops | 635 | 1.66% | 3,546 | 5.27% | 31% |
| 1121 Cattle | 31 | 0.08% | 2,987 | 4.44% | 2% |
| 1122 Hogs and Pigs | 0 | 0.00% | 56 | 0.08% | 0% |
| 1123 Poultry and Eggs | 16 | 0.04% | 798 | 1.19% | 4% |
| 1124 Sheep and Goats | 5 | 0.01% | 8 | 0.01% | 110% |
| 1125 Aquaculture | 60 | 0.16% | 564 | 0.84% | 19% |
| 1129 Other Animal | 27 | 0.07% | 1,371 | 2.04% | 3% |
| 1131 Timber Tract | 29 | 0.08% | 216 | 0.32% | 24% |
| 1132 Forest Nursery | 243 | 0.63% | 264 | 0.39% | 162% |
| 1133 Logging | 75 | 0.20% | 1,831 | 2.72% | 7% |
| 1141 Fishing | 11 | 0.03% | 334 | 0.50% | 6% |
| 1142 Hunting and Trapping | 0 | 0.00% | 100 | 0.15% | 0% |
| 1151 Crop Support | 20,681 | 53.95% | 12,113 | 18.00% | 300% |
| 1152 Animal Support | 25 | 0.07% | 1,636 | 2.43% | 3% |
| 1153 Forestry Support | 179 | 0.47% | 500 | 0.74% | 63% |
| Total | 38,336 | 100.00% | 67,280 | 100.00% | 100% |
| 115115 Farm Labor Contactors | 19,229 | 50.16% | 3,853 | 5.73% | 876% |
| 115115 Farm Labor Contractors + H-2A FLC | 19,229 | 50.16% | 16,353 | 24.30% | 118% |
Note: The last row, Farm Labor Contractors + H-2A FLCs, assumes that Florida FLCs employ an annual average of 12,500 H-2A workers (see text), and adds them to the non-H-2A FLC employment of 3,853 in the previous row.
Source: Authors' analysis of U.S. Department of Labor, Wage and Hour Compliance Action Data (U.S. DOL-WHD 2020f) and Bureau of Labor Statistics, Quarterly Census of Employment and Wages data for North American Industry Classification System code 11, agriculture, in 2018 (BLS-QCEW 2020a).
Half of the WHD violations in Florida agriculture were found to have been committed by FLCs, which accounted for less than 4,000 average employees or 6% of QCEW agricultural employment, making the FLC share of violations almost nine times its share of employment. However, FLC agricultural employment is artificially low in the Florida QCEW data because the state of Florida exempts employers of H-2A workers from the UI system (Rural Migration News 2020a). Florida is certified to fill about 25,000 jobs a year with H-2A workers and, if these H-2A workers are in the state for an average of six months, there would be 12,500 additional full-time equivalent (FTE) jobs showing up in the data, meaning average agricultural employment in Florida would be 12,500 higher, for a total of 80,000. If all of these 12,500 FTE-jobs for H-2A workers were positions working for FLCs, the average employment for FLCs would be 16,350 or 24% of the state’s total, and the ratio of share of violations to share of employment would fall to 1.2 (or 118%).
The highest ratio of shares of violations to shares of employment was on grain crop farms, with a four-times-higher share, followed by fruit and nut crops and forest nursery activities. Vegetable and melon crops had a lower share of violations than their share of agricultural employment.
To give a brief example from a smaller farm state, Iowa, WHD found 3,000 violations of employment laws there between FY05 and FY19, while average QCEW agricultural employment in Iowa in 2019 was 21,000. Three-fourths of the Iowa wage and hour violations in agriculture were committed by FLCs, who had average annual employment of 345, or less than 2% of QCEW agricultural employment for the state, making the FLC share of violations 45 times the FLC share of agricultural employment in 2019 over 15 years (however it should be noted that Iowa also excludes H-2A employment from the QCEW, meaning that employment is likely higher and the ratio likely lower). Violations in the hogs and pigs NAICS code accounted for 15% of violations found, but a quarter of 2019 agricultural employment, followed by poultry and eggs, 4% of violations and 16% of employment, and cattle and dairy, less than 1% of violations and 15% of employment (BLS-QCEW 2020a; U.S. DOL-WHD 2020f).
Conclusion and recommendations
These WHD enforcement data show that agriculture accounts for a higher share of labor violations than its share of U.S. employment. Average QCEW farmworker employment of 1.3 million was about 1% of total U.S. employment in 2019, and the 107,000 agricultural establishments registered with unemployment insurance (UI) authorities were 1% of the almost 10 million UI-registered establishments.20
Using this measure of employment, agriculture accounted for 7% of all federal employment law investigations and 3% of the 10 million federal employment law violations found over the past 15 years—three times agriculture’s share of U.S. employment. But since the number of WHD investigations in agriculture decreased to about 100 farm employers per month, the probability that any farm employer will be investigated in a given year is only 1.1%.
The major explanation for the decline in WHD agricultural investigations is likely reduced funding for WHD, which has not kept up with the growth of the labor force and the need to investigate wage and hour violations. Our analysis of WHD enforcement data suggests that more funding for WHD could increase the number of investigations and violations detected, which would reduce the billions of dollars per year in wage theft that occurs (Cooper and Kroeger 2017) and diminish the advantages that accrue to employers who violate the law to reduce their labor costs.
Most WHD investigations in agriculture find violations—70% of all investigations—while roughly 30% of the farm employers who were investigated had zero violations. In addition, 30% of all farm employers that WHD investigated committed five or more violations.
FLCs are the most common violators of federal wage and hour laws in agriculture: they accounted for one-seventh of average agricultural employment and 24% of all federal wage and hour violations. In other words, we know that at least a quarter of employment law violations occur on farms that hire farmworkers through FLCs. FLCs accounted for a disproportionately high share of agricultural violations relative to their share of employment, both nationwide and in the two states with the most farmworker employment, California and Florida.
The FLC model of employment may increase the incidence of employment law violations by separating the main beneficiary of the labor provided by farmworkers—the farm operator or “lead” employer—from the farmworkers who perform the work. Farms that rely on FLCs are a textbook example of what Weil (2014b) called a “fissured” workplace, where the relationship between the worker and the lead employer is fissured, or broken, via the use of a temp agency or subcontractor (in this case the FLC). Fissuring often results in lower wages for workers,21 in part because the subcontractor (the FLC) keeps a percentage of the wages earned by the workers, and farm operators do not provide the farmworkers who work on their farms with fringe benefits because they are employees of the FLC. Since FLCs account for a rising share of agricultural employment, fissuring should be a major concern for policymakers.
The enforcement data show that the “bad apple” employers and repeat violators committed a large and disproportionate share of labor violations in every commodity. We also found that the share of employment law violations by county and commodity does not necessarily reflect that county’s or commodity’s share of agricultural employment. One likely explanation for why shares of violations and shares of employment diverge is because the worst violators account for a disproportionately high share of all violations, and they may not be located in the counties or states with the highest levels of agricultural employment.
Our analysis raises several key questions that merit further investigation to better protect farmworkers, including:
- Does the low probability of being investigated encourage violations of employment law? Since only 1.1% of farm employers are investigated in any given year, farm employers can reasonably expect that they will never be investigated.
- Without increased funding for WHD, could changes in enforcement strategy improve compliance and worker protections? What is the optimal balance between investigations in areas with more and fewer farmworkers, and between complaint-driven and strategic enforcement that targets likely violators? What are the lessons of WHD’s strategic enforcement strategy during Administrator David Weil’s tenure between 2014 and 2016?
- Are the penalties assessed by WHD for violations sufficient to change behavior and deter others from violating employment laws? If not, what penalties would encourage compliance and deter violations?
- What can be done to improve compliance among the bad apple employers and farm labor contractors who account for the most violations? Should public policy aim to reduce the growth of the farm labor contractor model of farm employment?
- Could more education of workers and employers improve compliance?
The purpose of this report is to inform and spur a renewed debate about labor standards enforcement in agriculture. However, several recommendations could improve compliance with employment laws on U.S. farms
First, since current investigations and sanctions levied do not deter violations by FLCs (and therefore on farms that use FLCs), bad apple employers, and repeat violators, it may be time for new and revised policies to deal with all three. However, since FLCs are the biggest employment law violators, there should be a special focus and increased scrutiny on FLCs and farms that use FLCs. In addition, compliance could be incentivized if there were larger fines and more significant sanctions, and an improved effort to make other employers aware of the fines and sanctions.
A key strategy in the FLC context is also increasing use of the joint employment standard to hold farms accountable for FLC violations. The Fair Labor Standards Act defines an employer as “any person acting directly or indirectly in the interest of an employer in relation to an employee,” and allows a worker to have several “joint” employers (U.S. DOL-WHD 2020b). If farm operators are jointly liable for violations committed by the FLCs that bring workers to their farms, they have incentives to police FLCs to ensure they comply with employment laws. Competition between FLCs can lead to an erosion of FLC commissions and employment law violations, so requiring written FLC-employer contracts and posting them online could make it far easier to detect low commission rates that may encourage employment law violations.
Second, among all employers and FLCs, examining whether the severity of sanctions is sufficient and increasing the value of civil money penalties (CMPs) should be considered in order to shift penalties from a cost of doing business to an incentive for compliance. Requiring employers to pay the back wages they owe to their employees simply makes them do what they should have done in the first place. Civil money penalties aim to change behavior and deter future violations. However, U.S. farmers pay $40 billion a year in wages,22 more than $100 million a day, while back wage assessments and CMPs on farms were about $6 million each in 2019, or about $16,400 a day for each, just one-tenth of 1% of daily wages. With CMPs such a low share relative to wage costs, some farm employers and FLCs may have business models that depend on violating laws and expecting not to be detected. Increasing penalties for employment law violations at the state level improves compliance (Galvin 2016), and publicizing fines via press releases for violations can help to change employer behavior (Johnson 2020).
Third, strategic enforcement aimed to move WHD from responding to individual worker complaints to having half or more of WHD investigations be directed at firms likely to violate employment laws. WHD should continue to assess and refine strategic enforcement strategies that aim to improve compliance among employers prone to violate employment laws.
Fourth, after repeat investigations find repeat violators, WHD investigators should be allowed to require offenders to submit certified payroll data, as the Davis-Bacon Act requires of government contractors, to provide early warning of more violations. Repeat offenders also could be subjected to random payroll audits so that investigators could more efficiently pressure bad apple employers into compliance.
Fifth, more and better data could improve the efficiency of enforcement. Statistical analysis of labor standards enforcement data can formalize investigator rules of thumb about which employers are most likely to violate employment laws, and help investigators more quickly detect irregularities in payroll data. For example, one perennial issue is “ghost” workers who perform work but are not on the employer’s payroll, making the workers on the payroll appear to be more productive than they actually are. Databases that record the average productivity of workers would be helpful to determine whether “ghost” farmworkers on employer payrolls explain unusually high hourly earnings. Knowing how many buckets or bins of blueberries and apples a worker typically picks per hour or day could assist investigators who are reviewing payroll records to detect likely violations.
Sixth, more could be done to build on the good work done by advocates and unions to educate farmworkers about their rights and the process of reporting violations, perhaps with new and innovative methods. For example, advocacy organizations have developed mobile phone apps and websites that allow workers to report on particular employers and recruiters;23 perhaps an interactive labor standards app that explains wage and hour laws to farmworkers in appropriate languages and allows them to file anonymous reports and complaints to WHD could be an effective means of increasing reporting to aid WHD with enforcement efforts.
Acknowledgements
The authors are grateful to Bruce Goldstein, Janice Fine, Jennifer Gordon, Muzaffar Chishti, Ross Eisenbrey, David Kallick, Greg Asbed, and Justin Flores, for their insightful comments, observations, and suggestions provided during the drafting of this report. However, no one mentioned here is responsible for the report’s content, and the authors are solely responsible for any errors or omissions.
Appendix: Share of all violations in an NAICS code for top 5% of violators
WHD enforcement data show that a small share of violators accounts for a high share of violations. Agriculture is divided into 30+ NAICS codes, from grain crops to support services for crop and animal production. In each of the NAICS codes with significant farmworker employment, the 5% of violators with the most violations accounted for 50% to 85% of total violations found in that commodity.
The 5% of U.S. vegetable farms with the most violations accounted for 71% of all violations found on vegetable farms during fiscal years 2005–2019
| % of farms investigated (ranked by number of violations) | % of violations |
|---|---|
| 95%–100% | 71.4% |
| 91%–95% | 10.7% |
| 86%–90% | 4.9% |
| 81%–85% | 3.1% |
| 76%–80% | 2.3% |
| 71%–75% | 1.9% |
| 66%–70% | 1.4% |
| 61%–65% | 1.2% |
| 56%–60% | 1.0% |
| 51%–55% | 0.8% |
| 46%–50% | 0.5% |
| 41%–45% | 0.5% |
| 36%–40% | 0.5% |
| 31%–35% | 0.1% |
| 26%–30% | 0.0% |
| 21%–25% | 0.0% |
| 16%–20% | 0.0% |
| 11%–15% | 0.0% |
| 6%–10% | 0.0% |
| 1%–5% | 0.0% |
Note: There were 3,489 investigation of U.S vegetable farms between fiscal year 2005 and fiscal year 2019.
Source: Authors' analysis of U.S. Department of Labor, Wage and Hour Compliance Action Data (U.S. DOL-WHD 2020f).
The 5% of U.S. dairy farms with the most violations accounted for 50% of all violations found on dairy farms during fiscal years 2005–2019
| % of farms investigated (ranked by number of violations) | % violations |
|---|---|
| 95%-100% | 50.0% |
| 91%-95% | 17.6% |
| 86%-90% | 10.0% |
| 81%-85% | 5.5% |
| 76%-80% | 4.0% |
| 71%-75% | 2.8% |
| 66%-70% | 1.8% |
| 61%-65% | 1.8% |
| 56%-60% | 1.6% |
| 51%-55% | 0.9% |
| 46%-50% | 0.9% |
| 41%-45% | 0.9% |
| 36%-40% | 0.9% |
| 31%-35% | 0.9% |
| 26%-30% | 0.2% |
| 21%-25% | 0.0% |
| 16%-20% | 0.0% |
| 11%-15% | 0.0% |
| 6%-10% | 0.0% |
| 1%-5% | 0.0% |
Note: There were 149 investigations of U.S. dairy farms between fiscal year 2005 and fiscal year 2019.
Source: Authors' analysis of U.S. Department of Labor, Wage and Hour Compliance Action Data (U.S. DOL-WHD 2020f).
The 5% of U.S. animal farms with the most violations accounted for 85% of all violations found on animal farms during fiscal years 2005–2019
| % of farms investigated (ranked by number of violations) | % of violations |
|---|---|
| 95%–100% | 87.0% |
| 91%–95% | 4.5% |
| 86%–90% | 2.6% |
| 81%–85% | 1.7% |
| 76%–80% | 1.2% |
| 71%–75% | 0.8% |
| 66%–70% | 0.6% |
| 61%–65% | 0.4% |
| 56%–60% | 0.3% |
| 51%–55% | 0.2% |
| 46%–50% | 0.2% |
| 41%–45% | 0.1% |
| 36%–40% | 0.1% |
| 31%–35% | 0.1% |
| 26%–30% | 0.1% |
| 21%–25% | 0.0% |
| 16%–20% | 0.0% |
| 11%–15% | 0.0% |
| 6%–10% | 0.0% |
| 1%–5% | 0.0% |
Note: There were 801 investigations of U.S. animal farms between fiscal year 2005 and fiscal year 2019.
Source: Authors' analysis of U.S. Department of Labor, Wage and Hour Compliance Action Data (U.S. DOL-WHD 2020f).
The 5% of U.S. grape farms with the most violations accounted for 55% of all violations found on grape farms during fiscal years 2005–2019
| % of farms investigated (ranked by number of violations) | % of violations |
|---|---|
| 95%–100% | 56.7% |
| 91%–95% | 13.3% |
| 86%–90% | 6.7% |
| 81%–85% | 5.0% |
| 76%–80% | 3.8% |
| 71%–75% | 3.2% |
| 66%–70% | 2.6% |
| 61%–65% | 2.4% |
| 56%–60% | 1.6% |
| 51%–55% | 1.6% |
| 46%–50% | 0.9% |
| 41%–45% | 0.8% |
| 36%–40% | 0.8% |
| 31%–35% | 0.5% |
| 26%–30% | 0.0% |
| 21%–25% | 0.0% |
| 16%–20% | 0.0% |
| 11%–15% | 0.0% |
| 6%–10% | 0.0% |
| 1%–5% | 0.0% |
Note: There were 385 investigations of U.S. grape farms between fiscal year 2005 and fiscal year 2019.
Source: Authors' analysis of U.S. Department of Labor, Wage and Hour Compliance Action Data (U.S. DOL-WHD 2020f).
The 5% of U.S. strawberry farms with the most violations accounted for 75% of all violations found on U.S. strawberry farms during fiscal years 2005–2019
| % of farms investigated (ranked by number of violations) | % of violations |
|---|---|
| 95%–100% | 76.8% |
| 91%–95% | 11.7% |
| 86%–90% | 4.5% |
| 81%–85% | 2.2% |
| 76%–80% | 1.2% |
| 71%–75% | 0.7% |
| 66%–70% | 0.6% |
| 61%–65% | 0.5% |
| 56%–60% | 0.5% |
| 51%–55% | 0.3% |
| 46%–50% | 0.3% |
| 41%–45% | 0.2% |
| 36%–40% | 0.2% |
| 31%–35% | 0.2% |
| 26%–30% | 0.2% |
| 21%–25% | 0.0% |
| 16%–20% | 0.0% |
| 11%–15% | 0.0% |
| 6%–10% | 0.0% |
| 1%–5% | 0.0% |
Note: There were 283 investigations of U.S. strawberry farms between fiscal year 2005 and fiscal year 2019.
Source: Authors' analysis of U.S. Department of Labor, Wage and Hour Compliance Action Data (U.S. DOL-WHD 2020f).
The 5% of U.S. agricultural employers with the most H-2A violations accounted for 55% of all H-2A violations during fiscal years 2005–2019
| % of farms investigated (ranked by number of violation | % of violations |
|---|---|
| 95%–100% | 55.6% |
| 91%–95% | 13.9% |
| 86%–90% | 8.1% |
| 81%–85% | 5.4% |
| 76%–80% | 3.8% |
| 71%–75% | 2.9% |
| 66%–70% | 2.3% |
| 61%–65% | 1.8% |
| 56%–60% | 1.4% |
| 51%–55% | 1.1% |
| 46%–50% | 0.9% |
| 41%–45% | 0.7% |
| 36%–40% | 0.5% |
| 31%–35% | 0.5% |
| 26%–30% | 0.3% |
| 21%–25% | 0.3% |
| 16%–20% | 0.2% |
| 11%–15% | 0.2% |
| 6%–10% | 0.2% |
| 1%–5% | 0.1% |
Note: There were 2,778 violations of U.S. agricultural employers with H-2A violations between fiscal year 2005 and fiscal year 2019.
Source: Authors' analysis of U.S. Department of Labor, Wage and Hour Compliance Action Data (U.S. DOL-WHD 2020f).
The 5% of U.S. farms labor contractors (FLCs) with the most H-2A violations accounted for 45% of all H-2A violations found among FLCs during fiscal years 2005–2019
| % of farms investigated | % of violations |
|---|---|
| 95%–100% | 46.8% |
| 91%–95% | 18.7% |
| 86%–90% | 10.0% |
| 81%–85% | 7.5% |
| 76%–80% | 5.0% |
| 71%–75% | 3.7% |
| 66%–70% | 2.6% |
| 61%–65% | 1.8% |
| 56%–60% | 1.2% |
| 51%–55% | 0.8% |
| 46%–50% | 0.5% |
| 41%–45% | 0.4% |
| 36%–40% | 0.2% |
| 31%–35% | 0.2% |
| 26%–30% | 0.2% |
| 21%–25% | 0.1% |
| 16%–20% | 0.1% |
| 11%–15% | 0.1% |
| 6%–10% | 0.1% |
| 1%–5% | 0.0% |
Note: There were 327 investigations of U.S. FLCs that found H-2A violations between fiscal year 2005 and fiscal year 2019.
Source: Authors' analysis of U.S. Department of Labor, Wage and Hour Compliance Action Data (U.S. DOL-WHD 2020f).
The 5% of U.S. employers with the most violations of the Migrant and Seasonal Agricultural Worker Protection Act (MSPA) accounted for almost 70% of all MSPA violations found
| Percent of farms investigated | % of violations |
|---|---|
| 95%–100% | 68.3% |
| 91%–95% | 10.1% |
| 86%–90% | 6.1% |
| 81%–85% | 4.5% |
| 76%–80% | 3.6% |
| 71%–75% | 2.4% |
| 66%–70% | 2.1% |
| 61%–65% | 1.2% |
| 56%–60% | 1.2% |
| 51%–55% | 0.5% |
| 46%–50% | 0.0% |
| 41%–45% | 0.0% |
| 36%–40% | 0.0% |
| 31%–35% | 0.0% |
| 26%–30% | 0.0% |
| 21%–25% | 0.0% |
| 16%–20% | 0.0% |
| 11%–15% | 0.0% |
| 6%–10% | 0.0% |
| 1%–5% | 0.0% |
Note: There were 9,075 investigations of U.S. agricultural employers that had at least one MSPA violation between fiscal year 2005 and fiscal year 2019.
Source: Authors' analysis of U.S. Department of Labor, Wage and Hour Compliance Action Data (U.S. DOL-WHD 2020f).
Endnotes
1. There are exceptions in some states, including California and New York.
2. WHD enforces wage and hour laws, also known as employment laws, while the Occupational Safety and Health Administration (OSHA) enforces health and safety laws. However, there is one exception: In most states, enforcement authority has been delegated to WHD by OSHA with respect to field sanitation standards in covered agricultural settings (U.S. DOL-WHD 2008).
3. Authors’ analysis of WHD budget data (U.S. DOL 2020). The CPI-U-RS formula for adjusting dollar figures to 2020 were not available at the time of publication. As a result, the 2012 dollar amounts were adjusted to real 2020 dollar amounts using the current unadjusted CPI for the U.S. city average for all items, which can be found at https://www.bls.gov/data.
4. Dollar amounts reported have been adjusted for inflation to constant 2019 dollars using the CPI-U-RS. As a result, the dollar amounts presented here may differ from the amounts reported in the source data.
5. Dollar amounts reported have been adjusted for inflation to constant 2019 dollars using the CPI-U-RS. As a result, the dollar amounts presented here may differ from the amounts reported in the source data. To determine whether there are statistically significant trends, we use two simple linear regression models where the dependent variables are (i) the total back wages owed and (ii) the total CMPs assessed, and the explanatory variable in both models is the continuous time (year) variable. Results are available upon request.
6. Authors’ analysis of data from the U.S. Department of State and the U.S. Department of Labor; results published in Costa and Martin (2020).
7. A recent report by Centro de los Derechos del Migrante, an advocacy group, interviewed 100 H-2A workers and found that all “experienced at least one serious legal violation of their rights, and 94% experienced three or more” (CDM 2020).
8. Dollar amounts reported have been adjusted for inflation to constant 2019 dollars using the CPI-U-RS. As a result, the dollar amounts presented here may differ from the amounts reported in the source data.
9. To determine whether there is a statistically significant trend, we use a simple linear regression model where the dependent variable is the average back wage per employee, and the explanatory variable is the continuous time (year) variable. Results are available upon request.
10. Dollar amounts reported have been adjusted for inflation to constant 2019 dollars using the CPI-U-RS. As a result, the dollar amounts presented here may differ from the amounts reported in the source data.
11. Or roughly 11% of all agricultural employment if workers who are not covered by employers reporting to UI are included (a total of 1.7 million workers).
12. These values are generated by estimating a multivariate linear probability regression model without a constant where the outcome variable is a binary indicator that takes on the value of 0 if an investigation did not result in a violation and a value of 1 if the investigation resulted in at least one violation. The explanatory variables are NAICS code fixed effects, which are binary variables that take on a value of 1 if the employer being investigated was categorized as belonging to a particular NAICS code, and 0 otherwise. The standard errors reported are robust to heteroskedasticity.
13. For Table 4, the commodity and type of employment reflect corresponding North American Industry Classification System (NAICS) codes associated with violations, or a combination of codes listed here: Vegetables and melon farming (NAICS 1112); Fruit and tree nut farming (1113); Greenhouse, nursery, and floriculture production (1114); Animal production and aquaculture (112); Support activities for crop production (non-FLC) (1151 excluding 115115); and Other crops (1119, 1131, 11199, 111199, 111940, 111991, 111998). Non-FLC crop support services include cotton ginning, soil preparation, crop harvesting by machine, other post-harvest activities, and farm management services.
14. These values are generated by estimating a multivariate linear probability regression model without a constant, where the outcome variable is a binary indicator that takes on a value of 0 if an investigation did not result in a violation, and a value of 1 if the investigation resulted in at least one violation. The explanatory variables are county fixed effects, which are binary variables that take on a value of 1 if the investigation was conducted in a particular county and a value of 0 otherwise. The standard errors are robust to heteroskedasticity.
15. Some employers that were investigated multiple times had names that were entered into the database with minor typographical inconsistencies. As a result, we corrected for 150 of these inconsistencies to track repeat investigations and violations of the same employer. Employer names must be identical for the statistical software program we use to identify repeat offenders. For example, the employer “A. Oseguera Company, Inc” also appears in the database as “A. Oseguera Company, Inc.” and “A. Oseguera Company Inc” (note the period in the second name and the lack of a comma in the third name). There is a possibility we did not catch all of the inconsistencies.
16. There are about 3,000 FLCs. However, 10,300 individuals and corporations were registered as FLCs with WHD in June 2020 (U.S. DOL-WHD 2020d). The reason for the discrepancy is that many large FLCs have dozens of supervisors and crew leaders who must register.
17. The database does not contain information about the disposition of the investigations, so we are unable to determine why these investigations did not result in back wages or civil money penalties owed.
18. As noted previously, because FLCs work across a range of commodities that do not get counted as such in these data, the violations by crop reported here are undercounted because they are classified under FLCs.
19. NAICS 1119, Other Crop Farming, includes tobacco, which is a major industry for H-2A employment.
20. The Census of Agriculture (COA) reports more than 500,000 farm employers, including farms that make end-of-year payments to family members and relatives to shift farm income into lower tax brackets. The COA does not generate average employment data, only a count of jobs that last more and less than 150 days on the responding farm.
21. A number of studies show a wage penalty for subcontracted/outsourced workers. For example, see Dube and Kaplan 2010, Goldschmidt and Schmieder 2017, and Drenik et al. 2020.
22. The Census of Agriculture reports $40 billion in labor costs for workers hired directly and for contract labor expenses in 2017; the QCEW reports $45 billion in wages and salaries paid in agriculture, including forestry and fishing.
23. See for example, Contratados.org, created by Centro de los Derechos del Migrante (Center for Migrant Rights), which acts as a “Yelp”-like review site for employers and labor recruiters.
References
Apgar, Lauren. 2015. Authorized Status, Limited Returns: The Labor Market Outcomes of Temporary Mexican Workers. Economic Policy Institute, May 2015.
Bauer, Mary, and Meredith Stewart. 2013. Close to Slavery: Guestworker Programs in the United States. Southern Poverty Law Center, February 2013.
Bernhardt, Annette, Ruth Milkman, Nik Theodore, Douglas Heckathorn, Mirabai Auer, James DeFilippis, Ana Luz González, Victor Narro, Jason Perelshteyn, Diana Polson, and Michael Spiller. 2009. Broken Laws, Unprotected Workers: Violations of Employment and Labor Laws in America’s Cities. Center for Urban Economic Development, National Employment Law Project, and UCLA Institute for Research on Labor and Employment, September 2009.
Botts, Jackie, and Kate Cimini. 2020. “Investigation: COVID Rips Through Motel Rooms of Guest Workers Who Pick Nation’s Produce.” CalMatters. Updated September 4, 2020.
Bureau of Labor Statistics (BLS). 2020. Injuries, Illnesses, and Fatalities, “Table 1. Incidence Rates of Nonfatal Occupational Injuries and Illnesses by Industry and Case Types, 2019” [online table]. Accessed October 2020.
Bureau of Labor Statistics’ Quarterly Census of Employment and Wages (BLS-QCEW). 2020a. QCEW Searchable Databases [databases]. Accessed August 2020.
Bureau of Labor Statistics’ Quarterly Census of Employment and Wages (BLS-QCEW). 2020b. “Table A. Coverage Exclusions in 2019, for Selected Workers” [online table], Employment and Wages, Annual Averages 2019. Last modified September 2, 2020.
Cooper, David, and Teresa Kroeger. 2017. Employers Steal Billions from Workers’ Paychecks Each Year: Survey Data Show Millions of Workers are Paid Less Than the Minimum Wage, at Significant Cost to Taxpayers and State Economies. Economic Policy Institute, May 2017.
Centro de los Derechos del Migrante Inc. (CDM). 2020. Ripe for Reform: Abuses of Agricultural Workers in the H-2A Visa Program. April 2020.
Costa, Daniel. 2020. “Trump Administration Looking to Cut the Already Low Wages of H-2A Migrant Farmworkers While Giving Their Bosses a Multibillion-Dollar Bailout.” Working Economics Blog (Economic Policy Institute ), April 14, 2020.
Costa, Daniel, and Philip Martin. 2020. Coronavirus and Farmworkers: Farm Employment, Safety Issues, and the H-2A Guestworker Program. Economic Policy Institute, March 2020.
Dorning, Mike, and Jen Skerritt. 2020. “Every Single Worker Has Covid at One U.S. Farm on Eve of Harvest.” Bloomberg. May 29, 2020.
Douglas, Leah. 2020. “Mapping Covid-19 Outbreaks in the Food System.” Food & Environment Reporting Network. April 22, 2020.
Drenik, Andres, Simon Jäger, Pascuel Plotkin, and Benjamin Schoefer. 2020. Paying Outsourced Labor: Direct Evidence from Linked Temp Agency-Worker-Client Data. Econometrics Laboratory, University of California, Berkeley, September 2020.
Dube, Arindrajit, and Ethan Kaplan. 2010. “Does Outsourcing Reduce Wages in the Low-Wage Service Occupations? Evidence from Janitors and Guards.” Cornell University ILR Review, Cornell University. January 1, 2010. https://doi.org/10.1177/001979391006300206.
Evich, Helena Bottemiller, Ximena Bustillo, and Liz Crampton. 2020. “Harvest of Shame: Farmworkers Face Coronavirus Disaster.” Politico. September 8, 2020.
Galvin, Daniel. 2016. “Deterring Wage Theft: Alt-Labor, State Politics, and the Policy Determinants of Minimum Wage Compliance.” Perspectives on Politics, American Political Science Association. June 13, 2016.
Garrison, Jessica, Ken Bensinger, and Jeremy Singer-Vine. 2015. “The New American Slavery: Invited to the U.S., Foreign Workers Find a Nightmare.” BuzzFeed News. July 24, 2015.
Goldschmidt, Deborah, and Johannes Schmieder. 2017. “The Rise of Domestic Outsourcing and the Evolution of the German Wage Structure.” The Quarterly Journal of Economics, Oxford University Press, vol. 132(3), 1165–1217.
Government Accountability Office (GAO). 2017. H-2A and H-2B Visa Programs: Increased Protections Needed for Foreign Workers. GAO-15-154. May 2017.
Hamaji, Kate, Rachel Deutsch, Elizabeth Nicolas, Celine McNicholas, Heidi Shierholz, and Margaret Poydock. 2019. Unchecked Corporate Power: Forced Arbitration, the Enforcement Crisis, and How Workers are Fighting Back. Economic Policy Institute, May 2019.
Johnson, Matthew S. 2020. “Regulation by Shaming: Deterrence Effects of Publicizing Violations of Workplace Safety and Health Laws.” American Economic Review, 110, no. 6 (June): 1866–1904.
Rural Migration News. 2019. “Census of Agriculture 2017: Direct-Hire Farm Workers” [blog post], June 17, 2019.
Rural Migration News. 2020a. “A Tale of Two States: Farm Labor in CA and FL” [blog post], March 17, 2020.
Rural Migration News. 2020b. “Hired Farm Work Force Reports, 1945–87” [blog post], July 10, 2020.
United States Department of Agriculture (USDA). 2017. Census of Agriculture. National Agricultural Statistics Survey.
U.S. Department of Labor (U.S. DOL). 2020. FY 2020 Department of Labor Budget Summary Tables.
U.S. Department of Labor Employment and Training Administration (U.S. DOL-ETA). 2018. National Agricultural Workers Survey, Research Report no. 13 and 2015-2016 data files.
U.S. Department of Labor Wage and Hour Division (U.S. DOL-WHD). 2020a. “Agriculture” [csv file] Fiscal Year Data for Wage and Hour Division. Accessed March 26, 2020.
U.S. Department of Labor Wage and Hour Division (U.S. DOL-WHD). 2020b. Fact Sheet: Final Rule on Joint Employer Status under the Fair Labor Standards Act. January.
U.S. Department of Labor (U.S. DOL-WHD). 2020c. Laws Administered and Enforced.
U.S. Department of Labor (U.S. DOL-WHD). 2020d. “Migrant and Seasonal Agricultural Worker Protection Act (MSPA) Registered Farm Labor Contractor Listing” [csv file]. Accessed September 2020.
U.S. Department of Labor Wage and Hour Division (U.S. DOL-WHD). 2020e. Unpublished Excel files provided by WHD staff members to the authors.
U.S. Department of Labor Wage and Hour Division (U.S. DOL-WHD). 2020f. Wage and Hour Compliance Action Data [csv file]. Accessed March 26, 2020.
Weil, David. 2018. “Creating A Strategic Enforcement Approach to Address Wage Theft: One Academic’s Journey in Organizational Change.” Journal of Industrial Relations, 0, no. 0:1–24. https://doi.org/10.1177/0022185618765551.
Weil, David. 2014a. “Testimony of Dr. David Weil, Wage and Hour Administrator, Wage and Hour Division, U.S. Department of Labor, Before the Subcommittee on Horticulture, Research, Biotechnology, and Foreign Agriculture, Committee on Agriculture,” Washington, D.C., July 30, 2014. U.S. House of Representatives. July 14.
Weil, David. 2014b. The Fissured Workplace: Why Work Became So Bad for So Many and What Can Be Done to Improve It. Cambridge, Mass.: Harvard University Press.