Briefing Paper #412
Introduction and key findings
Over the last several decades women have entered the workforce in record numbers and made great strides in educational attainment. Nevertheless, when compared with men, women are still paid less, are more likely to hold low-wage jobs, and are more likely to live in poverty. Gender wage disparities are present at all wage levels and within education categories, occupations, and sectors—sometimes to a grave degree.
Closing the gender wage gap is absolutely essential to helping women achieve economic security. But to bring genuine economic security to American women and their families, we must do more. In particular, we must reverse the decades-long trend of stagnant wages for the vast majority of workers. Indeed, at the same time the gender wage gap has persisted, hourly wage growth for the vast majority of workers has stalled, as the benefits of increased productivity have accrued to those at the top. This is the result of intentional policy decisions that have eroded the leverage of the vast majority of workers to secure higher wages.
To truly maximize women’s economic potential, we must focus on closing the gender wage gap and raising wages more generally. This is because gender wage parity does not improve women’s economic prospects to the greatest possible extent if wages for men and women remain equal but stagnant in the future. Wage growth is a women’s issue. To maximize women’s economic security, we must raise wages by pursuing policies that intentionally tilt bargaining power back toward low- and moderate-wage workers, and we must end discriminatory practices that contribute to the gender wage gap.
This report begins by examining the gender wage gap along a variety of dimensions—such as by wage percentile, race and ethnicity, and educational attainment—and discusses ways to eliminate the gap. It then shows how wage growth for women and men has failed to keep up with productivity gains in recent decades—a trend that has done much to harm women’s wages. The report concludes by presenting a comprehensive policy agenda aimed at fostering broad-based wage growth.
Key findings include:
- The gender wage gap is a persistent economic problem. In 2014, the hourly wage of the median woman ($15.21) was 82.9 percent that of the median man ($18.35).
- The gender wage gap exists at every decile in the wage distribution, at every level of educational attainment, and in the majority of occupations.
- Women of color are disproportionately affected by wage inequalities: As compared with the hourly wage of the median white man, the median black woman earns 65.1 percent as much, and the median Hispanic woman earns 58.9 percent as much.
- At the same time the gender wage gap has persisted, wages for the vast majority of workers have stagnated.
- Wages for the vast majority have stagnated since 1979 because the benefits of productivity gains have accrued almost exclusively to those at the top. Thus, wage stagnation has been accompanied by increasing inequality.
- Maximizing women’s economic security will therefore require both closing the gender wage gap and pursuing policies to raise wages and reverse growing inequality.
- If we had closed the gender wage gap and had inequality not increased over 1979–2014 (i.e., had wages grown in line with productivity), the hourly wages of the median woman could be over 70 percent higher today—$26.04 instead of $15.21.
- About 16 percent ($1.69) of the disparity is explained by gender inequality, 49.1 percent ($5.32) is explained by overall inequality (i.e., typical wages failing to grow in tandem with productivity), and the remainder (35.3 percent, or $3.82) results from the compounded effects of closing these two gaps together.
- A policy agenda aimed at both closing the gender wage gap and raising wages for all workers will end discriminatory practices that contribute to gender and race inequalities, and boost bargaining power for low- and moderate-wage workers across the board so that they have more leverage to secure higher pay.
- Ending discriminatory practices that contribute to gender and race inequalities entails:
- changing the culture of work to value work–life balance
- deterring the segregation of genders into specific occupations
- strongly enforcing antidiscrimination laws
- requiring more transparency in compensation data
- passing comparable-worth laws that ensure women are paid the same as men in equally valuable jobs, or with similar education or skill levels
- addressing the distribution of unpaid care work in the household by making it easier and more affordable for both men and women to spend more time at home
- Boosting bargaining power for low- and moderate-wage workers can be achieved through:
- countering persistent unemployment
- strengthening collective bargaining rights
- raising the minimum wage
- raising the minimum wage paid to tipped workers so it achieves parity with the regular minimum wage
- providing earned sick leave
- implementing paid family leave
- providing accessible, affordable, and high-quality child care
- ensuring workers can get the number of hours they need, and regularizing work schedules by requiring employers to provide more advance notice in setting and changing schedules
- creating more retirement security, such as by protecting and expanding Social Security
- updating and enforcing labor standards, including raising the salary threshold below which workers automatically qualify for overtime pay, and cracking down on harmful practices such as wage theft, worker misclassification, and forced arbitration
- providing undocumented workers a path to citizenship
- strengthening the social safety net
- Ending discriminatory practices that contribute to gender and race inequalities entails:
The gender wage gap, and how to close it
While the gender pay gap has shrunk considerably over the last few decades, women’s pay remains lower than men’s. In 1979, the median woman’s hourly earnings were 62.7 percent of the median man’s. As seen in Figure A, the gap between men’s and women’s median hourly earnings narrowed throughout the 1980s and 1990s, but has remained stagnant over the last decade. In 2014, at the median, women’s hourly wages were 82.9 percent of men’s ($15.21 versus $18.35). While women’s wages are generally closer to men’s today than they were 35 years ago, growing parity in hourly wages has been in part driven by falling male wages and has slowed considerably in recent years. Particularly in the context of both male and female median wage growth that lags far behind economy-wide productivity, reductions in the gender wage gap driven by stagnant or falling male wages cannot truly be considered progress.
The gender wage gap persists, but has narrowed since 1979: Median hourly wages, by gender, 1979–2014
| Women’s median hourly wages | Men’s median hourly wages | |
|---|---|---|
| 1979-01-01 | $12.61 | $20.13 |
| 1980-01-01 | $12.58 | $19.83 |
| 1981-01-01 | $12.47 | $19.42 |
| 1982-01-01 | $12.49 | $19.27 |
| 1983-01-01 | $12.65 | $19.01 |
| 1984-01-01 | $12.76 | $18.92 |
| 1985-01-01 | $12.82 | $19.10 |
| 1986-01-01 | $13.15 | $19.64 |
| 1987-01-01 | $13.49 | $19.53 |
| 1988-01-01 | $13.61 | $19.16 |
| 1989-01-01 | $13.60 | $18.61 |
| 1990-01-01 | $13.64 | $18.32 |
| 1991-01-01 | $13.70 | $18.28 |
| 1992-01-01 | $13.80 | $18.13 |
| 1993-01-01 | $13.96 | $17.98 |
| 1994-01-01 | $13.84 | $17.66 |
| 1995-01-01 | $13.75 | $17.93 |
| 1996-01-01 | $13.82 | $17.81 |
| 1997-01-01 | $14.16 | $17.92 |
| 1998-01-01 | $14.51 | $18.56 |
| 1999-01-01 | $14.64 | $19.04 |
| 2000-01-01 | $14.94 | $19.16 |
| 2001-01-01 | $15.26 | $19.43 |
| 2002-01-01 | $15.64 | $19.52 |
| 2003-01-01 | $15.68 | $19.36 |
| 2004-01-01 | $15.65 | $19.13 |
| 2005-01-01 | $15.54 | $18.97 |
| 2006-01-01 | $15.56 | $18.93 |
| 2007-01-01 | $15.69 | $19.24 |
| 2008-01-01 | $15.80 | $19.13 |
| 2009-01-01 | $16.07 | $19.67 |
| 2010-01-01 | $15.96 | $19.16 |
| 2011-01-01 | $15.67 | $18.64 |
| 2012-01-01 | $15.39 | $18.60 |
| 2013-01-01 | $15.35 | $18.41 |
| 2014-01-01 | $15.21 | $18.35 |
Source: EPI analysis of Current Population Survey Outgoing Rotation Group microdata
The gender wage gap affects women throughout the hourly wage distribution; at every decile, men significantly out-earn women, albeit by varying degrees. Figure B shows the gender wage gaps of the 10th, 50th, and 95th percentiles over time. In 2014, the gap was smallest at the 10th percentile, where women earned 90.9 percent of men’s wages. The minimum wage is partially responsible for this greater equality among the lowest earners, as it results in greater wage uniformity at the bottom of the distribution. The gap is highest at the top of the distribution, with 95th percentile women earning 78.6 percent as much as their male counterparts. Economist Claudia Goldin (2014) postulates that the gap is larger for women in high-wage professions because they are penalized for not working long, inflexible hours that often come with many professional jobs, due in large part to the arrival of children and long-standing social expectations about the division of household labor between men and women.
The gender wage gap is largest among top earners: Women’s hourly wages as a share of men’s at various wage percentiles, 1979–2014
| 10th percentile | 50th percentile | 95th percentile | |
|---|---|---|---|
| 1979-01-01 | 86.7% | 62.7% | 62.9% |
| 1980-01-01 | 83.2% | 63.4% | 64.8% |
| 1981-01-01 | 88.7% | 64.2% | 63.6% |
| 1982-01-01 | 88.9% | 64.8% | 64.8% |
| 1983-01-01 | 89.3% | 66.5% | 62.9% |
| 1984-01-01 | 87.2% | 67.4% | 64.1% |
| 1985-01-01 | 85.8% | 67.1% | 63.2% |
| 1986-01-01 | 84.7% | 66.9% | 66.2% |
| 1987-01-01 | 83.5% | 69.1% | 65.8% |
| 1988-01-01 | 81.5% | 71.1% | 68.0% |
| 1989-01-01 | 81.3% | 73.1% | 71.9% |
| 1990-01-01 | 83.4% | 74.4% | 72.7% |
| 1991-01-01 | 86.8% | 74.9% | 72.8% |
| 1992-01-01 | 89.7% | 76.2% | 73.9% |
| 1993-01-01 | 90.9% | 77.6% | 74.4% |
| 1994-01-01 | 90.8% | 78.4% | 76.3% |
| 1995-01-01 | 88.2% | 76.7% | 76.6% |
| 1996-01-01 | 87.2% | 77.6% | 77.0% |
| 1997-01-01 | 87.0% | 79.0% | 75.2% |
| 1998-01-01 | 89.4% | 78.2% | 76.7% |
| 1999-01-01 | 87.6% | 76.9% | 77.0% |
| 2000-01-01 | 87.3% | 78.0% | 75.6% |
| 2001-01-01 | 87.3% | 78.5% | 75.7% |
| 2002-01-01 | 89.6% | 80.1% | 76.2% |
| 2003-01-01 | 89.4% | 81.0% | 76.8% |
| 2004-01-01 | 89.3% | 81.8% | 75.3% |
| 2005-01-01 | 88.3% | 82.0% | 77.2% |
| 2006-01-01 | 88.8% | 82.2% | 77.9% |
| 2007-01-01 | 89.9% | 81.5% | 77.2% |
| 2008-01-01 | 90.3% | 82.6% | 77.0% |
| 2009-01-01 | 92.3% | 81.7% | 74.6% |
| 2010-01-01 | 92.9% | 83.3% | 76.8% |
| 2011-01-01 | 93.4% | 84.0% | 77.9% |
| 2012-01-01 | 91.7% | 82.8% | 74.5% |
| 2013-01-01 | 91.8% | 83.4% | 76.1% |
| 2014-01-01 | 90.9% | 82.9% | 78.6% |
Note: The xth-percentile wage is the wage at which x% of wage earners earn less and (100-x)% earn more.
Source: EPI analysis of Current Population Survey Outgoing Rotation Group microdata
Women of color earn far less than white men: Women’s median hourly wages, by race and ethnicity, as a share of white men’s wages, 2014
| Group | Share of white men’s earnings |
|---|---|
| White women | 81.8% |
| Black women | 65.1% |
| Hispanic women | 58.9% |
Note: Race/ethnicity categories are mutually exclusive (i.e., white non-Hispanic, black non-Hispanic, and Hispanic any race).
Source: EPI analysis of Current Population Survey Outgoing Rotation Group microdata
Women of color face an additional wage penalty due to their race. Figure C compares the median hourly wage in 2014 for white, black, and Hispanic women compared with white, non-Hispanic men. At the median, white female workers earn 81.8 percent of what a white man earns, compared with 65.1 percent for black women and 58.9 percent for Hispanic women.
The gender wage gap also persists at every education level, as seen in Figure D. Women with only a high school degree earn 21.1 percent less per hour than similarly educated men. Among those with an advanced degree, the gap is even larger, with women making only 74.4 percent of men’s hourly wages. For those with just a college degree, women make 77.8 percent of male earnings. This gender wage gap among college-educated individuals is present right after graduation: Among newly minted college graduates age 21–24, men’s average hourly wages are 15.7 percent higher (or $3.08 more) than women’s (Davis et al. 2015).
Women earn less than men at every education level: Average hourly wages, by gender and education, 2014
| Education level | Men’s hourly wages | Women’s hourly wages |
|---|---|---|
| Less than high school | $13.37 | $10.44 |
| High school | $18.12 | $14.29 |
| Some college | $20.19 | $16.20 |
| College | $33.35 | $25.94 |
| Advanced degree | $44.10 | $32.82 |
Source: EPI analysis of Current Population Survey Outgoing Rotation Group microdata
Although women have made progress since the Equal Pay Act was signed in 1963, there is obviously a long way to go. And in addition to the pay gaps just discussed, there are significant earnings gaps based on sexual orientation and gender expression (Badgett et al. 2007). Persistent wage gaps of all types inherently put many at an economic disadvantage, especially in terms of lifetime earnings.
Wage gaps are caused by several factors, but researchers have found that up to 41.1 percent of the overall pay gap between men and women is left unexplained after controlling for various factors such as industry, experience, and education (Blau and Khan 2006). This likely means that factors such as discrimination are perpetuating wage gaps. This discrimination is multifaceted, and doesn’t just show up in individual companies’ decisions about the hiring, promotion, and pay of women (or people of color, or LGBTQ workers). It can also manifest itself in how women are disproportionately steered toward careers or even college majors that provide a lower wage payoff, or in how social expectations (often embedded in business practices or even public policies) still push a large share of household labor on to women, making it harder for them to balance work and family, or to work the longer hours required in some high-wage professions. Recent research from the New York Federal Reserve Bank shows that gender wage gaps are most prominent when women reach the mid-career point, which is when most women begin to raise a family (Abel and Deitz 2015).
How to close the gender wage gap
Ways to help eliminate the gender wage gap include:
- changing the culture of work to emphasize work–life balance
- deterring the segregation of genders into specific occupations
- strongly enforcing antidiscrimination laws
- requiring more transparency in compensation data
- passing comparable-worth laws that ensure women are paid the same as men in equally valuable jobs, or with similar education or skill levels
- addressing the distribution of unpaid care work in the household by making it easier and more affordable for both men and women to spend more time at home, such as through the provision of paid family leave (as is discussed in more detail below)
But the gender wage gap is just one way our economy shortchanges women. Simply closing it will not be sufficient to bring economic security to America’s working women and their families. Efforts to close the gender wage gap must be undertaken in conjunction with efforts to counter the decades-long trend of wage stagnation. We should seek to close the gender wage gap by “leveling up,” or by spurring women’s wages to catch up to men’s while both men and women share in overall economic growth. Below we look at how women fit into the overall trend of wage stagnation that has been a defining feature of our economy in the last few decades. We also examine how women will disproportionately benefit from policies to address this wage stagnation.
Putting the gender wage gap into the context of overall wage stagnation
At the same time the gender wage gap has persisted, another gap has been forming: that between typical workers’ compensation and economy-wide productivity growth. That is, wages of workers across the board have become disconnected from the economy’s productivity gains. The wedge between compensation and productivity has manifested itself in stagnant wages for low- and middle-wage earners and a rapid increase in inequality since 1979.
Figure E shows how productivity gains have become decoupled from typical workers’ hourly compensation since 1979. Productivity and compensation grew in tandem roughly from 1948 until the mid-1970s. After 1979, however, productivity growth continued to rise consistently (though at a slightly slower rate than in the previous period), but the typical worker’s compensation began lagging further and further behind. In fact, between 1979 and 2014, productivity grew 62.7 percent, while hourly compensation grew only 8.0 percent. Productivity thus grew almost eight times faster than hourly compensation. In essence, productivity gains were captured almost exclusively by those at the top—meaning that inequality increased over this period. In short, while wage inequality between genders remains a serious economic challenge, it exists within a larger problem of growing economy-wide inequality. In fact, about 40 percent of the progress made in closing the wage gap since 1979 was due to men’s wages declining in an era of increasing inequality. Remedying unfairness of pay for women is necessary, but wage parity gained simply because male wages dropped is no cause for celebration.
Workers’ pay is no longer growing in tandem with productivity: Growth in productivity and typical worker’s compensation, 1948–2014
| Year | Hourly compensation | Net productivity |
|---|---|---|
| 1948 | 0.0% | 0.0% |
| 1949 | 6.3% | 1.5% |
| 1950 | 10.5% | 9.3% |
| 1951 | 11.8% | 12.3% |
| 1952 | 15.0% | 15.6% |
| 1953 | 20.8% | 19.5% |
| 1954 | 23.5% | 21.6% |
| 1955 | 28.7% | 26.5% |
| 1956 | 33.9% | 26.7% |
| 1957 | 37.1% | 30.1% |
| 1958 | 38.2% | 32.8% |
| 1959 | 42.5% | 37.6% |
| 1960 | 45.5% | 40.0% |
| 1961 | 48.0% | 44.3% |
| 1962 | 52.5% | 49.8% |
| 1963 | 55.0% | 55.0% |
| 1964 | 58.5% | 60.0% |
| 1965 | 62.5% | 64.9% |
| 1966 | 64.9% | 70.0% |
| 1967 | 66.9% | 72.0% |
| 1968 | 70.7% | 77.2% |
| 1969 | 74.7% | 77.9% |
| 1970 | 76.6% | 80.4% |
| 1971 | 82.0% | 87.1% |
| 1972 | 91.2% | 92.0% |
| 1973 | 91.3% | 96.7% |
| 1974 | 87.0% | 93.7% |
| 1975 | 86.8% | 97.9% |
| 1976 | 89.7% | 103.4% |
| 1977 | 93.1% | 105.8% |
| 1978 | 96.0% | 107.8% |
| 1979 | 93.4% | 108.1% |
| 1980 | 88.6% | 106.6% |
| 1981 | 87.6% | 111.0% |
| 1982 | 87.8% | 107.9% |
| 1983 | 88.3% | 114.1% |
| 1984 | 86.9% | 119.7% |
| 1985 | 86.3% | 123.4% |
| 1986 | 87.3% | 128.0% |
| 1987 | 84.6% | 129.1% |
| 1988 | 83.9% | 131.8% |
| 1989 | 83.7% | 133.6% |
| 1990 | 82.2% | 137.0% |
| 1991 | 81.9% | 138.9% |
| 1992 | 83.0% | 147.5% |
| 1993 | 83.4% | 148.4% |
| 1994 | 83.8% | 150.7% |
| 1995 | 82.7% | 150.8% |
| 1996 | 82.8% | 156.9% |
| 1997 | 84.8% | 160.5% |
| 1998 | 89.2% | 165.7% |
| 1999 | 91.9% | 172.1% |
| 2000 | 92.9% | 178.5% |
| 2001 | 95.6% | 182.9% |
| 2002 | 99.5% | 190.7% |
| 2003 | 101.6% | 200.2% |
| 2004 | 101.0% | 208.3% |
| 2005 | 100.0% | 213.6% |
| 2006 | 100.2% | 215.6% |
| 2007 | 101.7% | 217.8% |
| 2008 | 101.8% | 218.3% |
| 2009 | 109.7% | 224.9% |
| 2010 | 111.5% | 234.4% |
| 2011 | 109.1% | 234.8% |
| 2012 | 107.3% | 236.6% |
| 2013 | 108.3% | 236.9% |
| 2014 | 109.0% | 238.7% |
Note: Data are for average hourly compensation of production/nonsupervisory workers in the private sector and net productivity of the total economy. "Net productivity" is the growth of output of goods and services minus depreciation per hour worked.
Source: EPI analysis of BEA and BLS data (see technical appendix of Understanding the Historic Divergence Between Productivity and a Typical Worker's Pay for more detailed information)
Source: Economic Policy Institute analysis of data from the Bureau of Economic Analysis' National Income and Produce Accounts and the Bureau of Labor Statistics' Consumer Price Indexes and Labor Productivity and Costs programs (see technical appendix of Understanding the Historic Divergence Between Productivity and a Typical Worker's Pay for more detailed information)
The fact is our economy has generated ample income in recent decades to deliver rapid wage gains to both men and women. While more women entered the labor force, climbed to more senior positions, and were paid more than ever before throughout the late 20th century, our economy also became more productive than ever before, which means there was ample income generated in our economy for both men and women to see rapid wage gains. The optimal scenario would have seen overall median wages grow at the rate of overall productivity, while women’s wages grew sufficiently faster than men’s to erase the wage gap by now. But none of this occurred. As shown in Figure F, between 1979 and 2014, productivity increased much more than median wages for women (which grew 20.6 percent overall) and men, regardless of race or ethnicity. The huge gaps between every group’s median wages and overall productivity signals that there is plenty of room for each group’s median wages to grow without hampering other groups’ economic gains, and that other forces—namely, rising inequality—are reducing the slice of the economic pie available to the vast majority of workers.
All workers’ wages—regardless of gender, race, or ethnicity—have failed to rise in tandem with productivity: Hourly median wage growth by gender, race, and ethnicity, compared with economy-wide productivity growth, 1979–2014
| Year | White men | White women | Black men | Black women | Hispanic men | Hispanic women | Productivity |
|---|---|---|---|---|---|---|---|
| 1979 | 0.0% | 0.0% | 0.0% | 0.0% | 0.0% | 0.0% | 0.0% |
| 1980 | -2.1% | -0.2% | -2.0% | -1.9% | -3.2% | 1.6% | -0.8% |
| 1981 | -3.8% | -1.6% | -3.3% | 0.0% | -5.4% | -0.3% | 1.4% |
| 1982 | -3.9% | -0.6% | -7.1% | -0.8% | -6.6% | 2.8% | -0.1% |
| 1983 | -5.1% | 0.5% | -6.6% | -1.2% | -8.9% | 1.4% | 2.9% |
| 1984 | -5.5% | 1.0% | -5.9% | -1.2% | -7.3% | 1.0% | 5.6% |
| 1985 | -2.6% | 1.5% | -8.2% | 1.4% | -7.8% | 1.1% | 7.3% |
| 1986 | -2.4% | 5.4% | -4.5% | 3.0% | -7.3% | 2.7% | 9.5% |
| 1987 | -4.1% | 7.8% | -5.6% | 3.0% | -8.0% | 4.2% | 10.1% |
| 1988 | -4.5% | 8.8% | -5.0% | 4.0% | -9.9% | 3.2% | 11.4% |
| 1989 | -5.3% | 9.0% | -8.9% | 6.0% | -13.1% | 0.5% | 12.3% |
| 1990 | -7.0% | 8.9% | -9.9% | 4.8% | -17.3% | -0.5% | 13.9% |
| 1991 | -6.6% | 9.4% | -11.2% | 5.3% | -18.0% | 1.7% | 14.8% |
| 1992 | -7.2% | 10.7% | -11.8% | 5.8% | -17.1% | 3.2% | 18.9% |
| 1993 | -8.0% | 12.1% | -11.6% | 7.0% | -18.4% | 1.6% | 19.3% |
| 1994 | -9.0% | 12.0% | -11.6% | 5.2% | -19.9% | 0.0% | 20.5% |
| 1995 | -8.8% | 11.7% | -11.3% | 4.5% | -20.7% | -1.5% | 20.5% |
| 1996 | -8.5% | 13.9% | -12.4% | 4.5% | -21.1% | -0.8% | 23.4% |
| 1997 | -6.3% | 14.7% | -9.8% | 5.6% | -19.1% | -1.4% | 25.2% |
| 1998 | -3.2% | 17.7% | -6.9% | 11.2% | -15.6% | 3.2% | 27.7% |
| 1999 | -0.8% | 21.2% | -3.0% | 11.4% | -13.7% | 3.6% | 30.7% |
| 2000 | -1.1% | 21.9% | -3.4% | 16.1% | -12.7% | 4.9% | 33.8% |
| 2001 | 0.7% | 25.6% | -0.5% | 15.1% | -12.6% | 8.9% | 35.9% |
| 2002 | 0.9% | 28.4% | -0.3% | 18.0% | -11.6% | 8.6% | 39.7% |
| 2003 | 2.6% | 29.6% | -0.9% | 21.4% | -11.3% | 13.2% | 44.2% |
| 2004 | 1.8% | 29.3% | 1.0% | 22.9% | -12.2% | 11.6% | 48.1% |
| 2005 | 0.0% | 30.0% | -4.7% | 15.4% | -12.6% | 9.3% | 50.7% |
| 2006 | 0.0% | 30.0% | -1.9% | 19.6% | -9.6% | 7.7% | 51.6% |
| 2007 | 1.3% | 30.5% | -3.0% | 18.2% | -10.0% | 10.6% | 52.7% |
| 2008 | 0.0% | 29.6% | -3.1% | 16.0% | -8.9% | 12.0% | 53.0% |
| 2009 | 3.6% | 31.5% | 0.0% | 20.8% | -8.1% | 12.5% | 56.1% |
| 2010 | 1.8% | 31.6% | -1.9% | 20.2% | -10.7% | 10.3% | 60.7% |
| 2011 | -1.4% | 30.3% | -5.5% | 16.9% | -13.3% | 11.7% | 60.9% |
| 2012 | -2.2% | 29.2% | -5.9% | 14.0% | -12.4% | 9.6% | 61.7% |
| 2013 | -3.1% | 30.6% | -4.9% | 15.9% | -13.1% | 9.1% | 61.9% |
| 2014 | -3.1% | 30.2% | -7.2% | 12.8% | -9.8% | 8.6% | 62.7% |
Note: Race/ethnicity categories are mutually exclusive (i.e., white non-Hispanic, black non-Hispanic, and Hispanic any race). This figure includes the entire civilian labor force.
Source: EPI analysis of unpublished Total Economy Productivity data from Bureau of Labor Statistics Labor Productivity and Costs program, and Current Population Survey Outgoing Rotation Group microdata
It is important to note that although women’s wages have risen since 1979, these increases occurred in spite of rising inequality, and are attributable to women’s disproportionate gains in labor force attachment, educational attainment, and occupational upgrading. Had inequality not increased and had the gains from our growing economy been shared among the vast majority, women’s wages would be much higher today. And of course, if women’s wages had grown rapidly enough to fully close the gender wage gap, their wages would be even higher.
This is illustrated in Figure G, which shows how large the stakes are in closing gender pay gaps and engineering solid wage growth for the vast majority of workers. It shows how high median wages for women could be today if gender wage disparities were closed and if the economy had generated strong across-the-board wage growth to all workers. If the gender wage gap were closed—in other words, were women’s wages equal to median wages—women’s median wages would be 11.1 percent higher ($16.90 instead of $15.21). And had the median wage grown in tandem with productivity since 1979—i.e., had we closed the gender wage gap and had the economy’s gains been broadly shared—women’s median hourly wages would be 71.2 percent higher today ($26.04 instead of $15.21).
Eliminating the gender and inequality wage gap would raise women’s wages by more than 70%: Median hourly wages for men and women, compared with wages for all workers had they increased in tandem with productivity, 1979–2014
| Wages for all workers | Men’s wages | Women’s wages | Wages for all workers had they grown in tandem with productivity | |
|---|---|---|---|---|
| 1979 | $16.00 | $20.13 | $12.61 | $16.00 |
| 1980 | $15.85 | $19.83 | $12.58 | $15.88 |
| 1981 | $15.43 | $19.42 | $12.47 | $16.22 |
| 1982 | $15.65 | $19.27 | $12.49 | $15.98 |
| 1983 | $15.57 | $19.01 | $12.65 | $16.46 |
| 1984 | $15.65 | $18.92 | $12.76 | $16.89 |
| 1985 | $15.79 | $19.10 | $12.82 | $17.18 |
| 1986 | $16.09 | $19.64 | $13.15 | $17.53 |
| 1987 | $16.10 | $19.53 | $13.49 | $17.62 |
| 1988 | $16.00 | $19.16 | $13.61 | $17.82 |
| 1989 | $15.91 | $18.61 | $13.60 | $17.97 |
| 1990 | $15.90 | $18.32 | $13.64 | $18.22 |
| 1991 | $16.00 | $18.28 | $13.70 | $18.37 |
| 1992 | $16.14 | $18.13 | $13.80 | $19.03 |
| 1993 | $16.02 | $17.98 | $13.96 | $19.10 |
| 1994 | $15.74 | $17.66 | $13.84 | $19.28 |
| 1995 | $15.62 | $17.93 | $13.75 | $19.29 |
| 1996 | $15.55 | $17.81 | $13.82 | $19.75 |
| 1997 | $15.92 | $17.92 | $14.16 | $20.03 |
| 1998 | $16.36 | $18.56 | $14.51 | $20.43 |
| 1999 | $16.87 | $19.04 | $14.64 | $20.92 |
| 2000 | $16.83 | $19.16 | $14.94 | $21.41 |
| 2001 | $17.18 | $19.43 | $15.26 | $21.75 |
| 2002 | $17.33 | $19.52 | $15.64 | $22.36 |
| 2003 | $17.54 | $19.36 | $15.68 | $23.08 |
| 2004 | $17.54 | $19.13 | $15.65 | $23.70 |
| 2005 | $17.33 | $18.97 | $15.54 | $24.12 |
| 2006 | $17.40 | $18.93 | $15.56 | $24.26 |
| 2007 | $17.26 | $19.24 | $15.69 | $24.44 |
| 2008 | $17.32 | $19.13 | $15.80 | $24.48 |
| 2009 | $17.61 | $19.67 | $16.07 | $24.98 |
| 2010 | $17.38 | $19.16 | $15.96 | $25.71 |
| 2011 | $16.91 | $18.64 | $15.67 | $25.75 |
| 2012 | $16.81 | $18.60 | $15.39 | $25.88 |
| 2013 | $16.97 | $18.41 | $15.35 | $25.91 |
| 2014 | $16.90 | $18.35 | $15.21 | $26.04 |
Source: EPI analysis of unpublished Total Economy Productivity data from Bureau of Labor Statistics Labor Productivity and Costs program, wage data from the Current Population Survey Outgoing Rotation Group
There are several components to this 71.2 percent disparity. About 15.7 percent ($1.69) of it is explained by gender inequality (which the simulation remedies by making women’s wages equal to median wages). About 49.1 percent ($5.32) is explained by overall inequality in the economy (which the simulation remedies by growing women’s median wages at the same rate as productivity; this is not shown in the graph). The remainder (35.3 percent, or $3.82) is the interaction between them (i.e., the loss of growing productivity translating into higher wages off of a smaller female wage base). This breakdown illustrates that closing the gender wage gap and boosting wages for the vast majority of all workers are both necessary to maximize women’s economic prosperity.
Because most women’s wages have been held down by the same forces suppressing most men’s wages, we must go beyond achieving gender wage parity and prioritize boosting wages for all low- and moderate-wage workers. To that end, we must examine the factors that are keeping wages down and contributing to inequality, such as persistent excess unemployment and the erosion of labor standards and institutions. All of these factors erode workers’ leverage to demand higher wages. Many of these factors disproportionately affect women. Below we lay out a policy agenda that will boost women’s economic security by “leveling up,” or by increasing wages and living standards for all workers.
Maximizing women’s economic security by pursuing policies that spur broad-based wage growth
Besides doing everything we can to eradicate labor market disparities based on gender and race, to maximize women’s economic security, we should pursue policies that spur broad-based wage growth by giving workers more leverage to secure higher pay. These policies include bringing about full employment, restoring the right to collective bargaining, raising the minimum wage and tipped minimum wage, guaranteeing access to paid sick leave and paid family leave, providing accessible and high-quality child care, ensuring that hourly workers can get the number of hours they need and curtailing employers’ irregular scheduling practices, increasing retirement security, updating and enforcing labor standards (e.g., raising the overtime salary threshold and cracking down on wage theft), enacting comprehensive immigration reform and providing undocumented workers a path to citizenship, and strengthening the social safety net.
Bringing about full employment
In the near term, nothing would do as much to boost wage growth for low- and moderate-wage workers as reducing the elevated rates of unemployment that have plagued the U.S. economy not just since the 2008 financial crisis, but for most of the time during recent decades. High unemployment not only keeps millions of people from working at all, but also reduces the amount of bargaining power employed workers have vis-à-vis their employers. After all, in a time of job scarcity, employers do not need to raise wages to get and keep the workers they need. Consequently, high unemployment stunts wage growth for tens of millions of workers. In contrast, periods of genuinely full employment (the late 1990s and 2000, for example) boost bargaining power for these workers, allowing them to demand better schedules and negotiate higher wages. Unfortunately, in recent decades, it is only in the tightest of labor markets that strong wage growth occurs; in contrast, in prior decades, decent wage growth occurred in all but the worst of times.
The unemployment rate’s effect on wages is clearly seen in Figure H, which estimates the impact on real wages across the wage distribution of a 1 percentage-point decline in the unemployment rate (based on data for 1979 to 2007). It demonstrates that wages are sensitive to a strong (or weak) labor market, as this 1 point drop in unemployment can boost wages across the board. Although men are more greatly affected, women also see modest wage growth at every decile.
Reducing unemployment would disproportionately boost low- and moderate-wage workers' wages: Effect on hourly wages of a one-point decline in unemployment rate, by decile and gender
| Men | Women | |
|---|---|---|
| 10th | 2.0% | 1.4% |
| 20th | 1.6% | 1.0% |
| 30th | 1.5% | 1.0% |
| 40th | 1.0% | 0.9% |
| 50th | 0.9% | 0.9% |
| 60th | 0.8% | 0.7% |
| 70th | 0.9% | 0.5% |
| 80th | 0.8% | 0.6% |
| 90th | 0.5% | 0.8% |
Note: Figure is based on data from 1979 to 2007.
Source: EPI analysis of Current Population Survey Outgoing Rotation Group microdata
Better wage growth that comes with a tight labor market is crucial to ensuring that gender and racial wage gaps close for the right reasons, with wages rising for all groups but more rapidly for groups currently disadvantaged in labor markets. Tight labor markets can also disproportionately benefit women by making it harder for employers to discriminate in hiring, allowing more women to have better job opportunities (Bivens and Razza 2015).
Given that the fiscal policy decisions controlled by Congress have hampered growth for most of the past 5 years, the benefits of full employment have the most direct implications for monetary policymakers. The Federal Reserve should continue its admirable stance of providing a strong boost to growth and employment through monetary policy until solid wage growth is attained. Going forward, macroeconomic policymakers in general should prioritize very low rates of unemployment over very low rates of inflation.
Restoring the right to collective bargaining
One key factor in the divergence between pay and productivity is the widespread erosion of collective bargaining that has diminished the wages of both union and nonunion workers. In 1945, the share of U.S. workers who were a member of a union reached a high of 33.4 percent. This share then declined—largely after 1979—to 11.1 percent by 2014 (Hirsch and Macpherson 2003). The erosion of collective bargaining is likely among the single largest factors suppressing wage growth for middle-wage workers over the last few decades. In fact, over 1973–2007, the decline in unionization can explain up to one-third of the overall growth in wage inequality for men and one-fifth of the growth in wage inequality for women (Mishel 2012).
Unions have been proven to provide women with higher wages and better job quality. As seen in Figure I, among full-time workers, median weekly wages for women represented by unions are 30.9 percent ($212) higher than for nonunionized women. Women in unions also experience a smaller gender wage gap than nonunionized women. They earn 88.7 cents for every dollar earned by their male counterparts; women not covered by a union contract earn 81.8 cents on the dollar. Unions particularly give a boost to women of color: Among Hispanic women, those represented by labor unions have median weekly earnings 42.1 percent higher than those without union representation. (Anderson, Hegewisch, and Hayes 2015)
Women earn more when they collectively bargain, regardless of race or ethnicity: Median weekly earnings for full-time women workers, by union status and race/ethnicity, 2014
| Union | Nonunion | |
|---|---|---|
| All women | $899 | $687 |
| Hispanic | $739 | $520 |
| Black | $788 | $590 |
| White | $923 | $704 |
| Asian | $950 | $823 |
Note: Data are for full-time wage and salary workers.
Source: Adapted from Anderson, Hegewisch, and Hayes (2015)
Women are more likely to have health insurance and retirement benefits when they’re covered by a union: Share of women with employer-sponsored health insurance and retirement benefits, by union status, 2008–2012
| Union | Nonunion | |
|---|---|---|
| Health insurance coverage | 73.1% | 49.1% |
| Retirement plan | 74.4% | 41.8% |
Source: Adapted from Jones, Schmitt, and Woo (2014)
Women in unions also have higher rates of both health insurance coverage and enrollment in retirement plans, as seen in Figure J. In addition, unionized women are more likely to have access to a range of paid leave, from paid sick days, vacations, and holidays to paid family and medical leave (Jones, Schmitt, and Woo 2014). The decline in unionization is bad not only for women in unions, but for all women, as unions often set higher industry standards and wages that affect nonunionized workers too. When unions are strong, their benefits and protections spread to nonunion workers as well.
Unions are also important for public-sector workers. While these workers generally earn less than their private-sector counterparts, public-employee unions in full collective bargaining states (with agency shop clauses) do raise total compensation to their private-sector equivalents (Keefe 2015). Without these protections, public employees earn lower wages and compensation than comparable private-sector employees. This is particularly problematic for public school teachers, who already face a 15 percent wage penalty (Corcoran, Allegretto, and Mishel 2008). Women make up 59.3 percent of local public-sector employment and 46.6 percent of private-sector employment, so providing union protection in the private as well as public sectors is of utmost importance to women (as it is to all workers) (Wilson 2015).
The benefits of unions for most workers are why it’s important to fight the erosion of workers’ collective bargaining rights. Increasing penalties for corporate violation of labor laws and halting (and reversing) the spread of so-called right-to-work (RTW) laws are imperative. In fact, research has shown an association between a state being RTW and having lower average wages, with an effect larger for women than men. After controlling for demographic characteristics, labor market conditions, and cost-of-living differences, the wage penalty for women in RTW states is larger than for men (Gould and Shierholz 2011). Instead of limiting willing workers’ ability to form a union, we need to make it easier. This way, more workers will have the leverage they need to bargain for better wages and benefits and to set high labor standards for all workers.
Raising the minimum wage
The federal minimum wage was originally established to help ensure that all work would be fairly rewarded and that regular employment would provide a decent quality of life. Unfortunately, due to decades of infrequent and inadequate adjustment, the federal minimum wage no longer serves as an adequate wage floor. The current value of the minimum wage is $7.25—24 percent less than its inflation-adjusted value in 1968, when it was last consistent with gains in net productivity. If the minimum wage had been raised to reflect continued productivity gains since then, it would be $18.42 today.
The minimum wage is particularly important for women, because they are more likely to work in low-wage jobs. As shown in Figure K, women comprise the majority of workers in the largest low-wage occupations (Entmacher and Robbins 2015).
The majority of workers in the largest low-wage occupations are women: Gender breakdown of the 10 largest low-wage occupations, 2013
| Occupation | Women | Men |
|---|---|---|
| Child care workers | 95% | 5% |
| Home health aides | 89% | 11% |
| Maids and housekeepers | 88% | 12% |
| Personal care aides | 84% | 16% |
| Cashiers | 72% | 28% |
| Waiters and waitresses | 70% | 30% |
| Food preparers and servers | 65% | 35% |
| Bartenders | 58% | 42% |
| Food preparers | 56% | 44% |
| Hand packers and packagers | 49% | 51% |
Source: Adapted from Entmacher et al. (2014)
Women would be the main beneficiaries of increasing the minimum wage: Gender of workers affected by increasing the federal minimum wage to $12 by 2020
| Gender | Share |
|---|---|
| Women | 55.9% |
| Men | 44.1% |
Source: Adapted from Cooper (2015)
Women would also disproportionately benefit from raising the minimum wage. If the federal minimum wage were increased to $12.00 by 2020, it would boost wages for over 35 million workers (one-quarter of the American workforce)—and over half (55.9 percent) of these workers are women, as seen in Figure L. In fact, the typical worker who would benefit is a woman in her thirties working full time. If the minimum wage were raised to $12.00, 29.6 percent of female wage earners would get a raise, as shown in Figure M. About 37.1 percent of women of color would see a bigger paycheck, as would 27.3 percent of working mothers with children under age 18 and 39.6 percent of single mothers (Cooper 2015).
Right now, nowhere in the United States can a minimum-wage worker—even one without children—earn enough to attain a modest yet adequate standard of living (Gould, Cooke, and Kimball 2015). Raising the federal minimum wage would boost wages for millions of workers and increase living standards for hardworking families.
A higher minimum wage would give many working women a raise: Share of workers who would get a raise from increasing the federal minimum wage to $12 by 2020, by gender, race, and household composition
| Share of each group that would get a raise by increasing the federal minimum wage to $12 by 2020 | |
|---|---|
| Women | 29.6% |
| Working mothers | 27.3% |
| Single mothers | 39.6% |
| Women of color | 37.1% |
Source: Adapted from Cooper (2015)
Raising the tipped minimum wage
Most people believe service workers make a large amount of “extra” money in tips. However, a significant portion of their tip income compensates for their receiving a low subminimum base wage from their employer. Under federal law, employers of tipped workers are only required to pay their tipped staff a base wage of $2.13 per hour—an amount that has not been raised since 1991—provided that the sum of an employee’s weekly tips plus his or her base wage at least equals the minimum wage. Consequently, tipped work is overwhelmingly low-paying, even after accounting for tips. In 2013, tipped workers made median hourly wages 38.0 percent lower than those of other workers at the median: $10.22 (including tips), compared with $16.48. Due to their lower wages, tipped workers are more likely to be in poverty and to rely on public benefits (Cooper and Allegretto 2014).
As seen in Figure N, two-thirds of tipped workers are women. Additionally, 68.5 percent of food servers and bartenders (composing half of the tipped workforce) are women. Yet even among these lower-paid tipped workers, women earn less than their male counterparts—$10.07 (including tips) for women at the median, versus $10.63 for men (Cooper and Allegretto 2014).
Tipped workers make significantly less than other workers, and are more likely to be women: Share of tipped workers and all workers who are women
| Women | Men | |
|---|---|---|
| Tipped workers | 66.60% | 33.40% |
| 0 | ||
| All workers | 48.30% | 51.70% |
| 0 |
Source: EPI analysis of Current Population Survey Outgoing Rotation Group microdata, 2011–2013
It is possible to fix this disparity for tipped workers by eliminating the tipped minimum wage altogether, and paying tipped workers the normal federal minimum wage. This would help boost wages and stabilize incomes for millions of service workers.
Guaranteeing paid sick days
Currently, more than one-third of all workers—39%—do not work for employers that give them the chance to earn paid sick time. When these workers get sick, they are forced either to go to work, or to stay home without pay and risk losing their job. Parents without sick days also cannot stay home with a sick child and may send them to school ill, which in turn puts teachers and other students at risk of falling ill. When workers lack paid sick days, they are often forced to make impossible choices between their family and their work.
Access to paid sick days is also vastly unequal. As shown in Figure O, workers at the top of the wage scale are nearly four times more likely to have paid sick days than workers at the bottom of the scale. Only one in five low-wage workers have paid sick days, compared with 86 percent of high-wage workers. These low-wage workers are the ones who can least afford to lose pay when sick.
The vast majority of low-wage workers don't have paid sick days: Share of private-sector workers who receive paid sick leave, by wage group, 2014
| Group | 2014 |
|---|---|
| Bottom 10% | 20% |
| Bottom 25% | 30% |
| Second 25% | 64% |
| Third 25% | 73% |
| Top 25% | 84% |
| Top 10% | 87% |
Source: EPI analysis of Bureau of Labor Statistics Employee Benefits Survey
In lieu of federal leadership on paid sick days, four states and 18 cities have already passed their own paid sick day legislation (National Partnership 2015). But a comprehensive federal policy is still needed. Requiring employers to provide paid sick time or let their employees earn paid sick days would ensure that all working people could meet their responsibilities at home without compromising their family’s economic security, as well as protect public health at little cost to business.
Guaranteeing paid family leave
Although the Family and Medical Leave Act of 1993 guarantees 12 weeks of job-protected family leave, half of workers are not qualified to receive it (because it only applies to large employers and workers with a minimum job tenure), and the act does not require the leave to be paid. The access to paid family leave is much lower; in 2014, just 12 percent of private-sector employees had any access to paid family leave, shown in Figure P. Though this signals that a few employers offer some degree of paid leave, it does not tell us how long this leave is, nor how much it pays. Because there is currently no national standard regarding paid family leave, each worker is left to the whims of individual company policies, which often means no paid family leave at all.
88% of private-sector workers lack access to paid family leave: Share of private-sector workers without access to paid family leave, 2014
| Group | Share of private sector workers |
|---|---|
| Have access to paid family leave | 12% |
| Do not have paid family leave | 88% |
Source: EPI analysis of Bureau of Labor Statistics Employee Benefits Survey
Due to this widespread lack of paid family leave, workers have to make difficult choices between their careers and their caregiving responsibilities precisely when they need their paychecks the most, such as following the birth of a child or when they or a loved one falls ill. This lack of choice can often lead workers to cut their leave short; among workers who took time off for caregiving responsibilities, 40 percent cut their time off short due to financial reasons (Klerman et al. 2012). It can also lead workers to forgo much-needed pay, leave the labor force altogether, or make poor-quality care arrangements for their children or other loved ones (Daley et al. 2012). The lack of paid family leave particularly affects women, as they currently take on the lion’s share of unpaid care work (ATUS 2015).
Because women are still largely expected to take on larger shares of household labor, many women leave the paid labor force to care for loved ones when the need arises, forcing these women to forgo opportunities for career advancement and to end up with lower lifetime earnings (and therefore lower retirement income) than their male peers. Researchers predict that 10.5 percent of the gender wage gap can be explained by women having less labor force experience (Blau and Khan 2006). In addition, as previously noted, the pay of college-educated men and women more significantly diverges at the mid-career point, the same point at which many workers start having children (Abel and Dietz 2015). On the flipside, when women are supported by a comprehensive paid family leave policy, they are more likely to stay attached to the labor force (Hegewisch and Gornick 2011; Baum and Ruhm 2013).
Our current lack of paid family leave requires workers to make impossible choices between work and family and hampers their economic security, and this burden clearly falls disproportionately on women. However, the solution to this problem is achievable: Several individual companies have already implemented their own family leave policies, almost all industrialized nations have a comprehensive national paid family leave program, and three states—California, Rhode Island, and New Jersey—have created successful family leave insurance programs (U.S. Department of Labor 2015; Lerner and Applebaum 2014). Requiring employers to provide their employees with paid family leave or creating a national insurance program that supplements wages during leave will ensure workers do not have to choose between the job they need and the family they love.
Increasing access to high-quality, affordable child care
In addition to a lack of paid family leave and paid sick days, many families lack accessible, affordable, and high-quality child care, making it even harder for them to balance work and family. Child care is expensive, to the point that many families cannot afford it. Child care is more expensive than rent in 500 out of the 618 metropolitan and nonmetropolitan areas across the country (Gould and Cooke 2015). Workers with children therefore must choose between struggling to pay for adequate care, choosing care that is subpar but less expensive, or leaving the labor force altogether to become a primary caregiver. Alternatively, when child care is affordable, parents have more choices: Workers can stay in the workforce, and their children can receive adequate care. In addition to the problem of expense, many workers have unstable and unpredictable work schedules, making it impossible to predict when they will need child care (see the discussion of scheduling below).
Quality child care requires a commitment to decent facilities and well-paid staff. In 2014, the median child care worker was paid $10.31 per hour, 39.3 percent below the overall median wage of $17.00 for all other occupations (Gould 2015). Our current child care system is paradoxical: Many families can’t afford care, yet many care workers (disproportionately women) can’t afford to get by on their wages. We need a solution at the scale of the problem, such as through more-widely-available income-based subsidies or universal prekindergarten for younger children.
Universal high-quality prekindergarten programs prepare children for school (and life beyond school). Such programs have been found to boost children’s skills across multiple domains, from higher test scores to improved high school graduation rates—and even better employment prospects and less involvement with criminal activity (Bartik 2014).
Placing a higher value on care and caregiving is necessary to make our workplace rules match our 21st century reality. Accessible, affordable child care—combined with paid sick days and paid family leave policies—is necessary to keep women in labor markets, to let women earn a steady paycheck, and to raise living standards for all families.
Ensuring workers can get the hours they need, and improving employers’ scheduling practices
Work scheduling is also central to balancing career and family. On the one hand, the lack of flexible work arrangements (on top of the lack of paid sick days and paid family leave) makes it difficult for many workers, especially women, to meet both their caregiving and work responsibilities.
On the other hand, due to continual slack in the labor market, many workers have been unable to work as much as they would like to. Women in particular wish they could work more: 4.7 percent of women work part time and wish they could be full time, but cannot due to the still-sluggish economy, compared with 3.5 percent of men (as shown in Figure Q). Black women are disproportionately affected, with 6.0 percent classified as part-time for economic reasons. Hispanic women are most likely to be affected, as 7.5 percent work part time but wish they could be full time. These women would be helped by a tighter labor market, in which there was more demand for their labor, once again highlighting the significance of prioritizing low rates of unemployment in monetary policymaking.
Women and workers of color are more likely to work part-time despite wanting full-time work: Share of all workers who are involuntary part-time workers, by gender, race, and ethnicity, 2014
| Race/ethnicity | Men | Women |
|---|---|---|
| All | 3.50% | 4.70% |
| White | 3.20% | 4.40% |
| Black | 5.70% | 6.00% |
| Hispanic | 5.30% | 7.50% |
Note: Involuntary part-time workers are workers who indicate that they would like to work full time but were working part time (1 to 34 hours) because of an economic reason, such as their hours being cut back or their inability to find full-time jobs.
Source: EPI analysis of Bureau of Labor Statistics Current Population Survey public data series
In addition to being unable to work as many hours as they want, many workers have variable and unpredictable work hours. Currently, 17 percent of workers have unstable shift work schedules. About 10 percent of the workforce is subject to “just-in-time” scheduling practices, or are assigned irregular or on-call work shift times (Golden 2014). Over one-third (34 percent) of women hourly workers in their prime childrearing years (age 26–32) receive their work schedules with less than one week of advance notice (Rothstein and Morsy 2015).
Irregular scheduling such as this makes it very difficult for workers to care for their family or arrange outside child care, and creates work–family stress. This type of scheduling can also result in uncertain earnings, as workers are unsure how many hours they will work each week, and therefore are unable to rely on a steady paycheck. On top of that, low-wage workers are more likely to work irregular schedules, and women are more likely to work in low-wage occupations.
Furthermore, children of parents with irregular work schedules are more likely to have cognitive and behavioral challenges. Toddlers whose mothers work nonstandard hours demonstrate worse sensory perception, memory, learning, problem solving, verbal communication, and expressive language. Preschoolers whose mothers work nonstandard hours are more likely to experience depression, anxiety, withdrawal, and aggression. This is because parents’ irregular schedules interfere with children’s healthy development and result in often inconsistent and poorer-quality child care arrangements (Rothstein and Morsy 2015).
Employers should be required to use fairer scheduling practices, such as providing more advance notice in setting and changing work schedules, and to pay workers who have not received sufficient notice of last-minute schedule changes for hours lost, for “on-call hours,” for being scheduled on split shifts, and for instances in which they are sent home before completing their assigned shifts.
Increasing retirement security
In recent decades, as employers have shifted from relying on defined-benefit pension plans to individual savings and 401(k)-type defined-contribution plans to supplement Social Security, retirement security has worsened for most Americans. Retirement wealth has also become more unequal, with increasingly inadequate savings for successive cohorts and growing disparities by income, race, ethnicity, education, and marital status (Morrissey and Sabadish 2013). In addition, recent proposals to scale back, privatize, or cut Social Security or Medicare threaten the economic security of seniors.
Most seniors live on modest retirement incomes, which often are barely adequate—and sometimes inadequate—to cover the costs of basic necessities and support a simple, yet dignified, quality of life. Nearly half (48.0 percent) of the U.S. elderly population is “economically vulnerable,” defined as having an income less than twice the supplemental poverty measure (SPM) threshold (a poverty line more comprehensive than the traditional federal poverty line). This equates to roughly 19.9 million economically vulnerable seniors.
Women are especially vulnerable in retirement: Women are paid less than men and more likely to take time out of the labor force due to caregiving responsibilities (see the previous discussion of paid family leave). This can affect the timing of benefit uptake and benefit amounts, as caregiving often results in intermittent labor force patterns, less job advancement, smaller salaries, and smaller Social Security and occupational pension incomes for women (Raymo and Sweeney 2006; Kingson and O’Grady-Leshane 1993).
As a result, 52.6 percent of elderly women are economically vulnerable, as seen in Figure R. Women are 10.7 percentage points more likely to fall below twice the SPM threshold than men (of whom 41.9 percent fall below the threshold). They are also far more likely to fall below the SPM (17.2 percent versus 12.7 percent). Men are more likely to be in the top of the income-to-SPM distribution.
Elderly women are more likely than elderly men to be economically vulnerable: Share of the elderly at various income levels, expressed as multiples of the supplemental poverty measure (SPM) threshold, by gender
| Less than 1.0x SPM (economically vulnerable) [seriesoptions color=”hsl(354, 73%, 30%)”] | 1.0 to 1.99x SPM (economically vulnerable) [seriesoptions color=”hsl(354, 73%, 43%)”] | 2.0 to 3.99x SPM | At or above 4.0x SPM | |
|---|---|---|---|---|
| Women, age 65+ | 17.2% | 35.3% | 31.5% | 16.0% |
| Men, age 65+ | 12.7% | 29.2% | 35.1% | 23.0% |
Source: EPI analysis of pooled 2010–2012 Current Population Survey Annual Social and Economic Supplement microdata
This is not a statistical artifact based on the fact that women live longer than men—although women’s longer lifespans do indeed make retirement planning that much more challenging. In fact, women are more likely to be economically vulnerable than men among both the younger elderly and the older elderly. Women age 65 to 79 are 9 percentage points more likely to be economically vulnerable than men, and women age 80 and older are 13 percentage points more likely to be economically vulnerable than men.
Women also rely on Social Security more than men do as a primary source of income. Women age 65 and older who receive Social Security benefits get 61 percent of their family income from Social Security, on average. This compares with 56 percent for male beneficiaries over age 65. Social Security makes up over 90 percent of total income for 20 percent of women beneficiaries age 65–69. This reliance on Social Security doubles with age, as 39 percent of women age 80 and older rely solely on Social Security. Men in both age groups are less likely to rely on Social Security as their primary (or sole) source of income: 16 percent of men age 65–69 and 30 percent of men age 80 and up fall into this category (Entmacher and Robbins 2015).
Therefore, any proposed changes to Social Security must be evaluated not just for their impact on future budget deficits, but for their impact on living standards of the elderly. The existence of a retirement system that does not work for most workers underscores the importance of defending defined-benefit pensions for workers who have them, and seeking solutions for those who do not. We must also preserve and strengthen Social Security. One possible reform that would predominantly benefit women is providing Social Security credit for unpaid household care work, thereby ensuring parents are compensated in retirement for such work.
Updating and enforcing labor standards
In addition to raising the minimum wage, there are many other labor standards that are in need of updating and stronger enforcement. The enforcement of labor standards is so weak that hundreds of thousands of employers routinely fail to pay the minimum wage or overtime, expose employees to workplace hazards, don’t pay payroll taxes or workers’ compensation premiums, and don’t provide legally mandated family and medical leave.
Policymakers should focus on penalizing perpetrators of wage theft, reversing the growing trend of misclassifying workers, updating the overtime threshold, and ending the practice of forced arbitration over employment disputes.
It is estimated that over $50 billion is stolen from employees each year through wage theft, which occurs when employers don’t pay workers the wages they are owed (Eisenbrey and Meixell 2014). A study of workers in low-wage industries estimates that 30 percent of women and 20 percent of men experience wage violations (Bernhardt et al. 2009). Women are more likely to have their wages stolen because they are more likely to work in occupations that have a proven wage theft problem, such as restaurants. More enforcement and tougher penalties are needed to deter these violations, and access to the courts must be available to injured workers.
Policymakers should also crack down on the pernicious practice of employers misclassifying workers as independent contractors rather than employees. This allows them to avoid paying for workers’ compensation coverage, unemployment insurance coverage, or Social Security coverage for many workers, which costs working people millions of dollars each year. Many occupations where these labor practices are prevalent, such as in-home work, are likely to employ more women (Shierholz 2013). Indeed, since 2006 the share of maids, personal care aides, and home health aides categorized as “self-employed” has increased 9 percent, 18 percent, and 22 percent, respectively (Wright 2014). In addition, temp workers are disproportionately female and black (Nicholson 2015).
One encouraging development regarding labor standards is President Obama’s recent decision to update the overtime threshold, the salary level below which workers are automatically eligible for time-and-a-half pay for every hour worked beyond 40 in a week. It has only been updated once since 1975; in 2004, it was increased from $13,000 to the current $23,660, a level so low that millions of lower-wage and even middle-wage workers are working overtime but not getting paid for it. President Obama proposed a new overtime salary threshold of $50,440 (an estimate of a standard salary level equal to the 40th percentile of earnings for full-time salaried workers), which will directly benefit 13.5 million workers. Of the workers affected by the new rule, 51.3 percent are women. The new rule would cover 3.4 million working mothers and benefit 12.8 million children whose parents work. One-third of the affected workers are people of color (Mishel and Eisenbrey 2015). The higher salary threshold, which clearly defines who qualifies for overtime pay and avoids questions of job titles and duties, will have an enormous positive impact on women’s wages.
Policymakers should also end forced arbitration over employment disputes. In this practice, employees, as a condition of employment, give up their right to sue in the public courts, and their grievances are addressed in secret, private proceedings. Forced arbitration can impose unaffordable costs on workers, limit their use of class actions, and facilitate discrimination and violations of wage and hour laws. (EPI 2015c)
Regularizing undocumented workers
Women are often concentrated in jobs likely to be held by undocumented workers—for example, they make up 93.1 percent of domestic workers, who are much more likely to be immigrants (Shierholz 2013). Undocumented workers are vulnerable to exploitation: They have essentially no bargaining power vis-a-vis employers who can threaten to report them to immigration authorities, and virtually no enforceable labor or employment rights. Consequently, they earn lower wages than workers who have greater access to legal protections and are able to switch jobs more readily. That puts downward pressure on the wages and working conditions of workers—both native- and foreign-born—in the occupations and in the places where unauthorized workers are present.
Executive actions to provide relief against the threat of deportation, or comprehensive immigration reform that provides a path to citizenship, are polices that will lift wages. Regularizing undocumented workers will not only lift their wages but will also lift wages of those in the same fields of work. Bringing these workers out of the shadows will be better not just for the workers themselves, but also those native-born workers who are similarly situated.
Strengthening the social safety net
Although the majority of this paper’s policy solutions focus on improving women’s economic security by spurring broad-based wage growth, we would be remiss not to mention the social safety net, as it is a vital source of support for many women. Women are more likely to be in poverty and to be beneficiaries of government transfer and assistance programs. In 2014, women made up 59.0 percent of the adult population in poverty. They also comprised the majority of the population in households that received means-tested assistance, including cash assistance, food stamps, provision of public or authorized housing, or Medicaid (U.S. Census Bureau 2015). In 2013, women were 61.0 percent of nonelderly adult recipients of Supplemental Nutrition Assistance Program (SNAP) benefits and were the heads of 92.0 percent of single-parent households with children that received SNAP benefits (Gray 2013). Temporary Assistance for Needy Families (TANF) gives poor people much-needed extra support, and 85.8 percent of its recipients are women (Department of Health and Human Services 2014). In addition, the Earned Income Tax Credit (EITC) boosts low-wage women’s earnings both when they receive the credit and in later decades with increased Social Security earnings (Dahl et al. 2012).
Having a strong safety net is therefore vital for women and families. The total effect of all of our safety-net programs cuts poverty by over half, with programs such as Social Security, SNAP, and the EITC having the largest impacts (Sherman and Trisi 2015). These programs, and others such as unemployment insurance, are particularly important when the economy is performing poorly, as they help alleviate the negative effects of unemployment and wage loss for many families. Strengthening government assistance and transfer programs is therefore vital to help women and families achieve economic stability.
Conclusion
Over the last several decades, as the gender wage gap has persisted, another gap destructive to women’s economic security has formed: the wedge between typical workers’ compensation and economy-wide productivity. As women’s wages have lagged behind men’s, hourly pay of the vast majority of workers has stalled, even as workers have become more productive. Women’s median wages are far lower today than they would be if we had closed the gender wage gap and ensured all workers share in the benefits of increased productivity.
It doesn’t have to be this way.
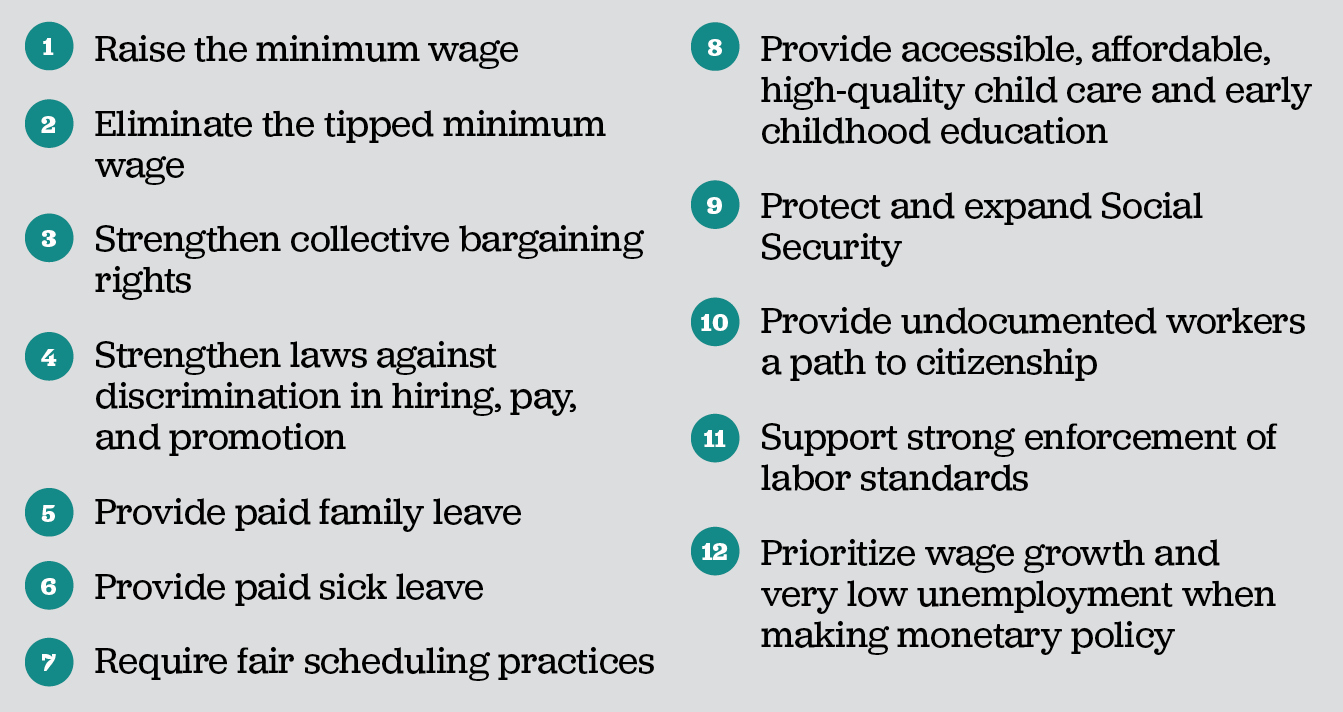
In addition to important efforts to close the gender wage gap, the solutions to help women achieve economic security and prosperity are the same solutions that will help all workers and the American economy flourish. This comes as no surprise—most women are workers, and almost half of workers are women. The solutions to help women and all workers see wage growth include updating and enforcing labor standards, targeting full employment, and raising living standards of all American families. The full list of policies we can implement to help women and workers is available at epi.org/womens-agenda.
When we create the opportunity for women to have economic security, we create prosperity for all American workers and their families.
— The authors would like to thank Susan Balding, Josh Bivens, Dan Essrow, Michael McCarthy, Liz Rose, Claire Sleigh, and Hilary Wething for their contributions.
About the authors
Alyssa Davis joined EPI in 2013 as the Bernard and Audre Rapoport Fellow. She assists EPI’s researchers in their ongoing analysis of the labor force, labor standards, and other aspects of the economy. Davis aids in the design and execution of research projects in areas such as poverty, education, health care, and immigration. She also works with the Economic Analysis and Research Network (EARN) to provide research support to various state advocacy organizations. Davis has previously worked in the Texas House of Representatives and the U.S. Senate. She holds a B.A. from the University of Texas at Austin.
Elise Gould, senior economist, joined EPI in 2003 and is the institute’s director of health policy research. Her research areas include wages, poverty, economic mobility, and health care. She is a co-author of The State of Working America, 12th Edition. In the past, she has authored a chapter on health in The State of Working America 2008/09; co-authored a book on health insurance coverage in retirement; published in venues such as The Chronicle of Higher Education, Challenge Magazine, and Tax Notes; and written for academic journals including Health Economics, Health Affairs, Journal of Aging and Social Policy, Risk Management & Insurance Review, Environmental Health Perspectives, and International Journal of Health Services. She holds a master’s in public affairs from the University of Texas at Austin and a Ph.D. in economics from the University of Wisconsin at Madison.
References
Abel, Jaison R., and Richard Dietz. 2015. “When Women Out-Earn Men.” Liberty Street Economics (Federal Reserve Bank of New York blog), August 5.
Allegretto, Sylvia, and David Cooper. 2014. Twenty-Three Years and Still Waiting for Change. Economic Policy Institute, Briefing Paper No. 379.
Anderson, Julie, Ariane Hegewisch, and Jeff Hayes. 2015. The Union Advantage for Women. Institute for Women’s Policy Research.
Appelbaum, Eileen. 2015. “FAMILY Act, Not Vodafone, Points Way Forward on Paid Family and Medical Leave.” The Hill, March 17.
Badgett, M.V. Lee, Holning Lau, Brad Sears, and Deborah Ho. 2007. Bias in the Workplace: Consistent Evidence of Sexual Orientation and Gender Identity Discrimination. The Williams Institute.
Bartik, Timothy J. 2014. From Preschool to Prosperity: The Economic Payoff to Early Childhood Education. W.E. Upjohn Institute for Employment Research.
Baum, Charles L., and Christopher J. Ruhm. 2013. The Effects of Paid Family Leave in California on Labor Market Outcomes. National Bureau of Economic Research, Working Paper No. 19741.
Bernhardt, Annette, Ruth Milkman, Nik Theodore, Douglas Heckathorn, Mirabai Aue, James DeFilippis, Ana Luz Gonzalez, Victor Narro, Jason Perelsheteyn, Diana Polson, and Michael Spiller. 2009. Broken Laws, Unprotected Workers: Violations of Employment and Labor Laws in America’s Cities. Center for Urban Economic Development, the National Employment Law Project, and the UCLA Institute for Research on Labor and Employment.
Bernstein, Jared, and Dean Baker. 2013. Getting Back to Full Employment: A Better Bargain for Working People. Washington, D.C.: Center for Economic and Policy Research.
Bivens, Josh. 2015. “How Overtime Rules Could Help the Middle Class.” The Wall Street Journal, June 30.
Bivens, Josh, and Connie M. Razza. 2015. Mind the Gap: How the Federal Reserve Can Help Raise Wages for America’s Women and Men. Fed Up, Center for Popular Democracy, and the Economic Policy Institute.
Bureau of Labor Statistics (U.S. Department of Labor). 2014. Current Population Survey Tables, Annual Averages. “Table 8: Employed and Unemployed Full- and Part-Time Workers by Age, Sex, Race, and Hispanic or Latino Ethnicity.”
Bureau of Labor Statistics (U.S. Department of Labor). 2015. “Employee Benefits in the United States, March 2015.” News release, July 24.
Bureau of Labor Statistics (U.S. Department of Labor). 2015. “American Time Use Survey—2014 Results.” News release, June 24.
Bureau of Labor Statistics (U.S. Department of Labor) Occupational Employment Statistics. 2015. May 2014 National Occupational Employment and Wage Estimates.
Bureau of Labor Statistics (U.S. Department of Labor) Employee Benefits Survey program. Various years. National Compensation Survey-Benefits [database].
Burnham, Linda, and Nik Theodore. 2012. Home Economics: The Invisible and Unregulated World of Domestic Work. National Domestic Workers Alliance.
Center for Law and Social Policy, Retail Action Project, and Women Employed. 2014. Tackling Unstable and Unpredictable Work Schedules.
Child Care Aware of America (CCAA). 2014. Parents and the High Cost of Child Care: 2014 Report.
Cooper, David. 2015. Raising the Minimum Wage to $12 by 2020 Would Lift Wages for 35 Million American Workers. Economic Policy Institute, Briefing Paper No. 405.
Cooper, David, and Elise Gould. 2013. Financial Security of Elderly Americans at Risk. Economic Policy Institute, Briefing Paper No. 362.
Cooper, David, and Alyssa Davis. 2015. “The Way We Pay Tipped Workers Disproportionately Harms Women.” Economic Policy Institute, Economic Snapshot, March 25.
Cooper, David, Katherine Gallagher Robbins, and Julie Vogtman. 2015. “A $12 Minimum Wage Would Give More Than One in Four Working Moms a Raise.” Working Economics (Economic Policy Institute blog), May 8.
Corcoran, Sean P., Sylvia Allegretto, and Lawrence Mishel. 2008. The Teaching Penalty: Teacher Pay Losing Ground. Economic Policy Institute book. http://www.epi.org/publication/book_teaching_penalty/
Costa, Daniel, David Cooper, and Heidi Shierholz. 2014. Facts About Immigration and the U.S. Economy. Economic Policy Institute Fact Sheet.
Current Population Survey Outgoing Rotation Group microdata. Various years. Survey conducted by the Bureau of the Census for the Bureau of Labor Statistics [machine-readable microdata file]. Washington, D.C.: U.S. Census Bureau.
Dahl, Molly, Jonathan Schwabish, Thomas DeLeire, and Timothy Smeeding. 2012. The Earned Income Tax Credit and Expected Social Security Retirement Benefits Among Low-Income Women. Congressional Budget Office.
Daley, Kelly, Jacob Klerman, Krista Olson, Alyssa Pozniak, and Katherine Wen. 2012. Family and Medical Leave in 2012: Detailed Results Appendix. Prepared for the U.S. Department of Labor by Abt Associates (updated April 18, 2014).
Davis, Alyssa. 2015. “Equal Pay Day: Minding the (Gender Wage) Gap.” Working Economics (Economic Policy Institute blog), April 14.
Department of Health and Human Services, Administration for Children and Families. 2014. Characteristics and Financial Circumstances of TANF Recipients, Fiscal Year 2012.
Economic Policy Institute (EPI). 2015a. The Benefits of Collective Bargaining. EPI Fact Sheet.
Economic Policy Institute (EPI). 2015b. Why It’s Time to Update Overtime Pay Rules. EPI Fact Sheet.
Economic Policy Institute (EPI). 2015c. The Agenda to Raise America’s Pay.
Eisenbrey, Ross. 2015. “What the New Proposed Overtime Rules Mean for Workers.” Working Economics (Economic Policy Institute blog), June 30.
Eisenbrey, Ross, and Brady Meixell. 2014. An Epidemic of Wage Theft is Costing Workers Hundreds of Millions of Dollars a Year. Economic Policy Institute, Issue Brief No. 385.
Entmacher, Joan, and Katherine Gallagher Robbins. 2015. Women and Social Security. National Women’s Law Center Fact Sheet.
Gallagher Robbins, Katherine, and Julie Vogtman. 2015. Cutting Programs for Low-Income People Especially Hurts Women and Their Families. National Women’s Law Center Issue Brief.
Glynn, Sarah Jane. 2012. Fact Sheet: Paid Family and Medical Leave. Center for American Progress.
Golden, Lonnie. 2015. Irregular Work Scheduling and Its Consequences. Economic Policy Institute, Briefing Paper No. 394.
Goldin, Claudia. 2014. “A Grand Gender Convergence: Its Last Chapter.” American Economic Review, vol. 104, no. 4, 1091–1119.
Gould, Elise. 2015a. “Paid Leave is Vital to Families’ Economic Security.” Working Economics (Economic Policy Institute blog), January 16.
Gould, Elise. 2015b. “Rich People Have Paid Sick Days. Poor People Do Not.” Economic Policy Institute, Economic Snapshot, January 21.
Gould, Elise, Tanyell Cooke, and Will Kimball. 2015. What Families Need to Get By: EPI’s 2015 Family Budget Calculator. Economic Policy Institute, Issue Brief No. 403.
Gould, Elise, Alyssa Davis, and Will Kimball. 2015. Broad-Based Wage Growth Is a Key Tool in the Fight Against Poverty. Economic Policy Institute, Briefing Paper No. 339.
Gould, Elise, and Heidi Shierholz. 2011. The Compensation Penalty of “Right-to-Work” Laws. Economic Policy Institute, Briefing Paper No. 299.
Gray, Kelsey Farson. 2014. Characteristics of Supplemental Nutrition Assistance Program Households: Fiscal Year 2013. Mathematica Policy Research, commissioned by the U.S. Department of Agriculture, Food and Nutrition Service, Office of Policy Support.
Hegewisch, Ariane, and Janet Gornick. 2011. “The Impact of Work-Family Policy on Women’s Employment: A Review of Research from OECD Countries.” Community, Work & Family, vol. 14, no. 2, 119–138.
Hirsch, Barry T., and David A. Macpherson. 2003. “Union Membership and Coverage Database from the Current Population Survey: Note,” Industrial and Labor Relations Review, vol. 56, no. 2, 349–354 (data updated January 24, 2015).
Jones, Janelle, John Schmitt, and Nicole Woo. 2014. Women, Working Families, and Unions. Center for Economic and Policy Research.
Keefe, Jeffrey. 2015. Eliminating Fair Share Fees and Making Public Employment “Right-to-Work” Would Increase the Pay Penalty for Working in State and Local Government. Economic Policy Institute, Briefing Paper No. 408.
Kingson, Eric, and Regina O’Grady-LeShane. 1993. “The Effects of Caregiving on Women’s Social Security Benefits.” Gerontologist, vol. 33, no. 2. 230–239.
Lerner, Sharon, and Eileen Appelbaum. 2014. Business as Usual: New Jersey Employers’ Experiences with Family Leave Insurance. Center for Economic and Policy Research.
Marr, Chuck, Chye-Ching Huang, Arloc Sherman, and Brandon Debot. 2015. EITC and Child Tax Credit Promote Work, Reduce Poverty, and Support Children’s Development, Research Finds. Center on Budget Policy Priorities.
Mishel, Lawrence, and Ross Eisenbrey. 2015. How to Raise Wages. Economic Policy Institute Briefing Paper, No. 391.
Morrissey, Monique. 2014. “The State of U.S. Retirement Security: Can the Middle Class Afford to Retire?” Testimony before the U.S. Senate Committee on Banking, Housing, and Urban Affairs Subcommittee on Economic Policy, March 12.
Morrissey, Monique, and Eric Kingson. 2012. Can Workers Offset Social Security Cuts by Working Longer? Economic Policy Institute, Briefing Paper No. 343.
Morrissey, Monique, and Natalie Sabadish. 2013. Retirement Inequality Chartbook. Economic Policy Institute Report.
National Partnership for Women and Families (NPWF). 2015. State and Local Action on Paid Sick Days.
National Women’s Law Center. 2014. Underpaid and Overloaded: Women in Low-Wage Jobs.
Nicholson, Jessica R. 2015. Temporary Help Workers in the U.S. Labor Market. U.S. Department of Commerce Economic and Statistics Administration, Issue Brief No. 03-15.
Raymo, James, and Megan Sweeney. 2006. “Work-Family Conflict and Retirement Preferences.” Journal of Gerontology (Series B: Psychological Sciences), vol. 61, no. 3, S161–169.
Rothstein, Richard, and Leila Morsy. 2015. Parents’ Non-Standard Work Schedules Make Adequate Childrearing Difficult. Economic Policy Institute, Issue Brief No. 400.
Sen, Aditi, and Connie Razza. 2015. Hour by Hour: Women in Today’s Workweek. The Center for Popular Democracy.
Sherman, Arloc, and Danilo Trisi. 2015. Safety Net More Effective Against Poverty Than Previously Thought. Center on Budget and Policy Priorities.
Shierholz, Heidi. 2014. Low Wage and Few Benefits Mean Many Restaurant Workers Can’t Make Ends Meet. Economic Policy Institute, Briefing Paper No. 383.
U.S. Census Bureau. 2015. Annual Social and Economic Supplement, 2014. Poverty Tables POV1 and POV26.
U.S. Department of Labor. 2015. The Cost of Doing Nothing: The Price We All Pay Without Paid Leave Policies to Support America’s 21st Century Working Families.
Watson, Liz, Lauren Frohlich, and Elizabeth Johnston. 2014. Collateral Damage: Scheduling Challenges for Workers in Low-Wage Jobs and Their Consequences. National Women’s Law Center Fact Sheet.
Wilson, Valerie. 2015. “African Americans and Women Disproportionately Pay the Price for Austerity and Congressional Dysfunction.” Economic Policy Institute, Economic Snapshot, September 30.
Wright, Joshua. 2014. America’s Self-Employment Landscape. Economic Modeling Specialists International.