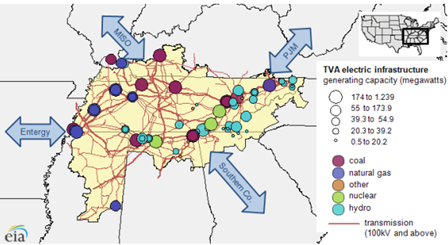
Figure ATVA’s electric infrastructure and service areaSource: EIA (2013) Share on Facebook Tweet this chart EmbedCopy the code below to embed this chart on your website.<iframe width="100%" height="460" src="https://www.epi.org?p=87012&view=embed&embed_template=charts_v2013_08_21&embed_date=20260626&onp=87012&utm_source=epi_press&utm_medium=chart_embed&utm_campaign=charts_v2" frameborder="0"></iframe> Download image This chart appears in: If It Ain’t Broke, Don’t Fix It!: Potential Impacts of Privatizing the Tennessee Valley Authority Previous chart: « TVA’s integrated power and nonpower functions Next chart: IRP-NRP framework »