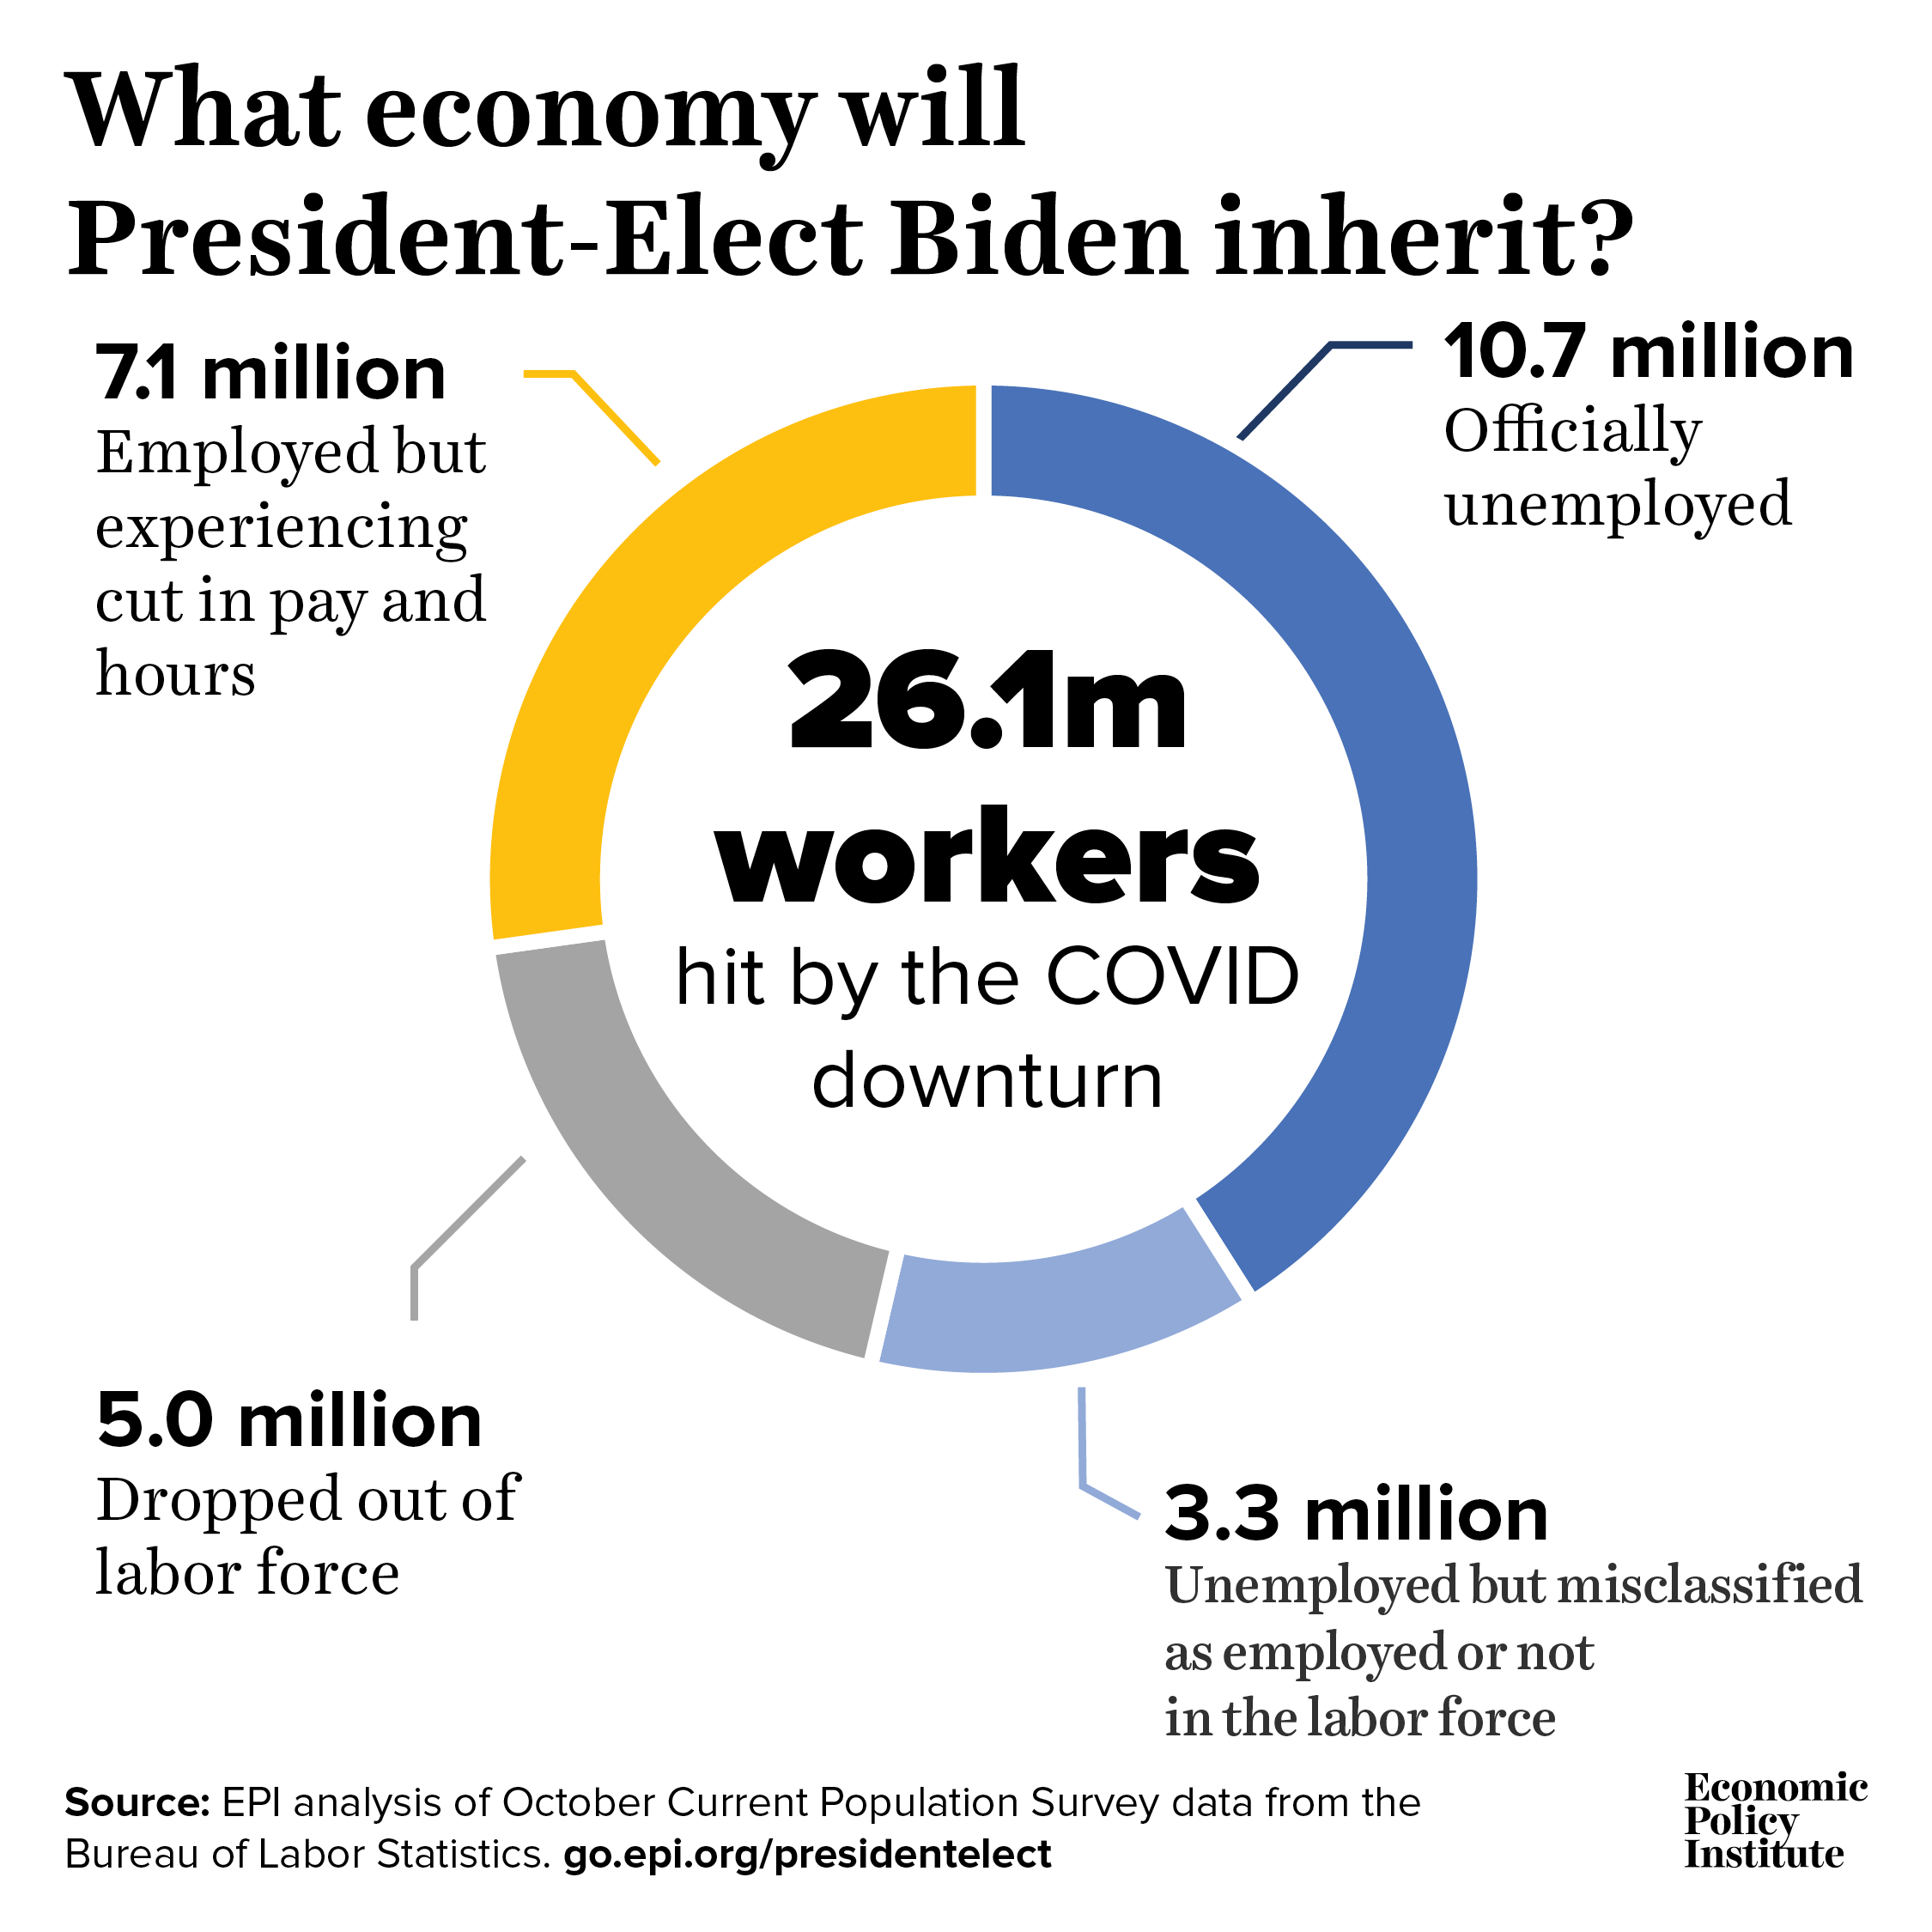
Top Chart 2020President Elect Biden Share on Facebook Tweet this chart EmbedCopy the code below to embed this chart on your website.<iframe width="100%" height="460" src="https://www.epi.org?p=217426&view=embed&embed_template=charts_v2013_08_21&embed_date=20260715&onp=217426&utm_source=epi_press&utm_medium=chart_embed&utm_campaign=charts_v2" frameborder="0"></iframe> Download image This chart appears in: Top charts of 2020: The economic fallout of COVID-19 Previous chart: « Continuing unemployment claims in all programs, March 23, 2019–November 28, 2020: *Use caution interpreting trends over time because of reporting issues (see below)* Next chart: Black-white and Hispanic-white unemployment ratios, 2020 Q3 »