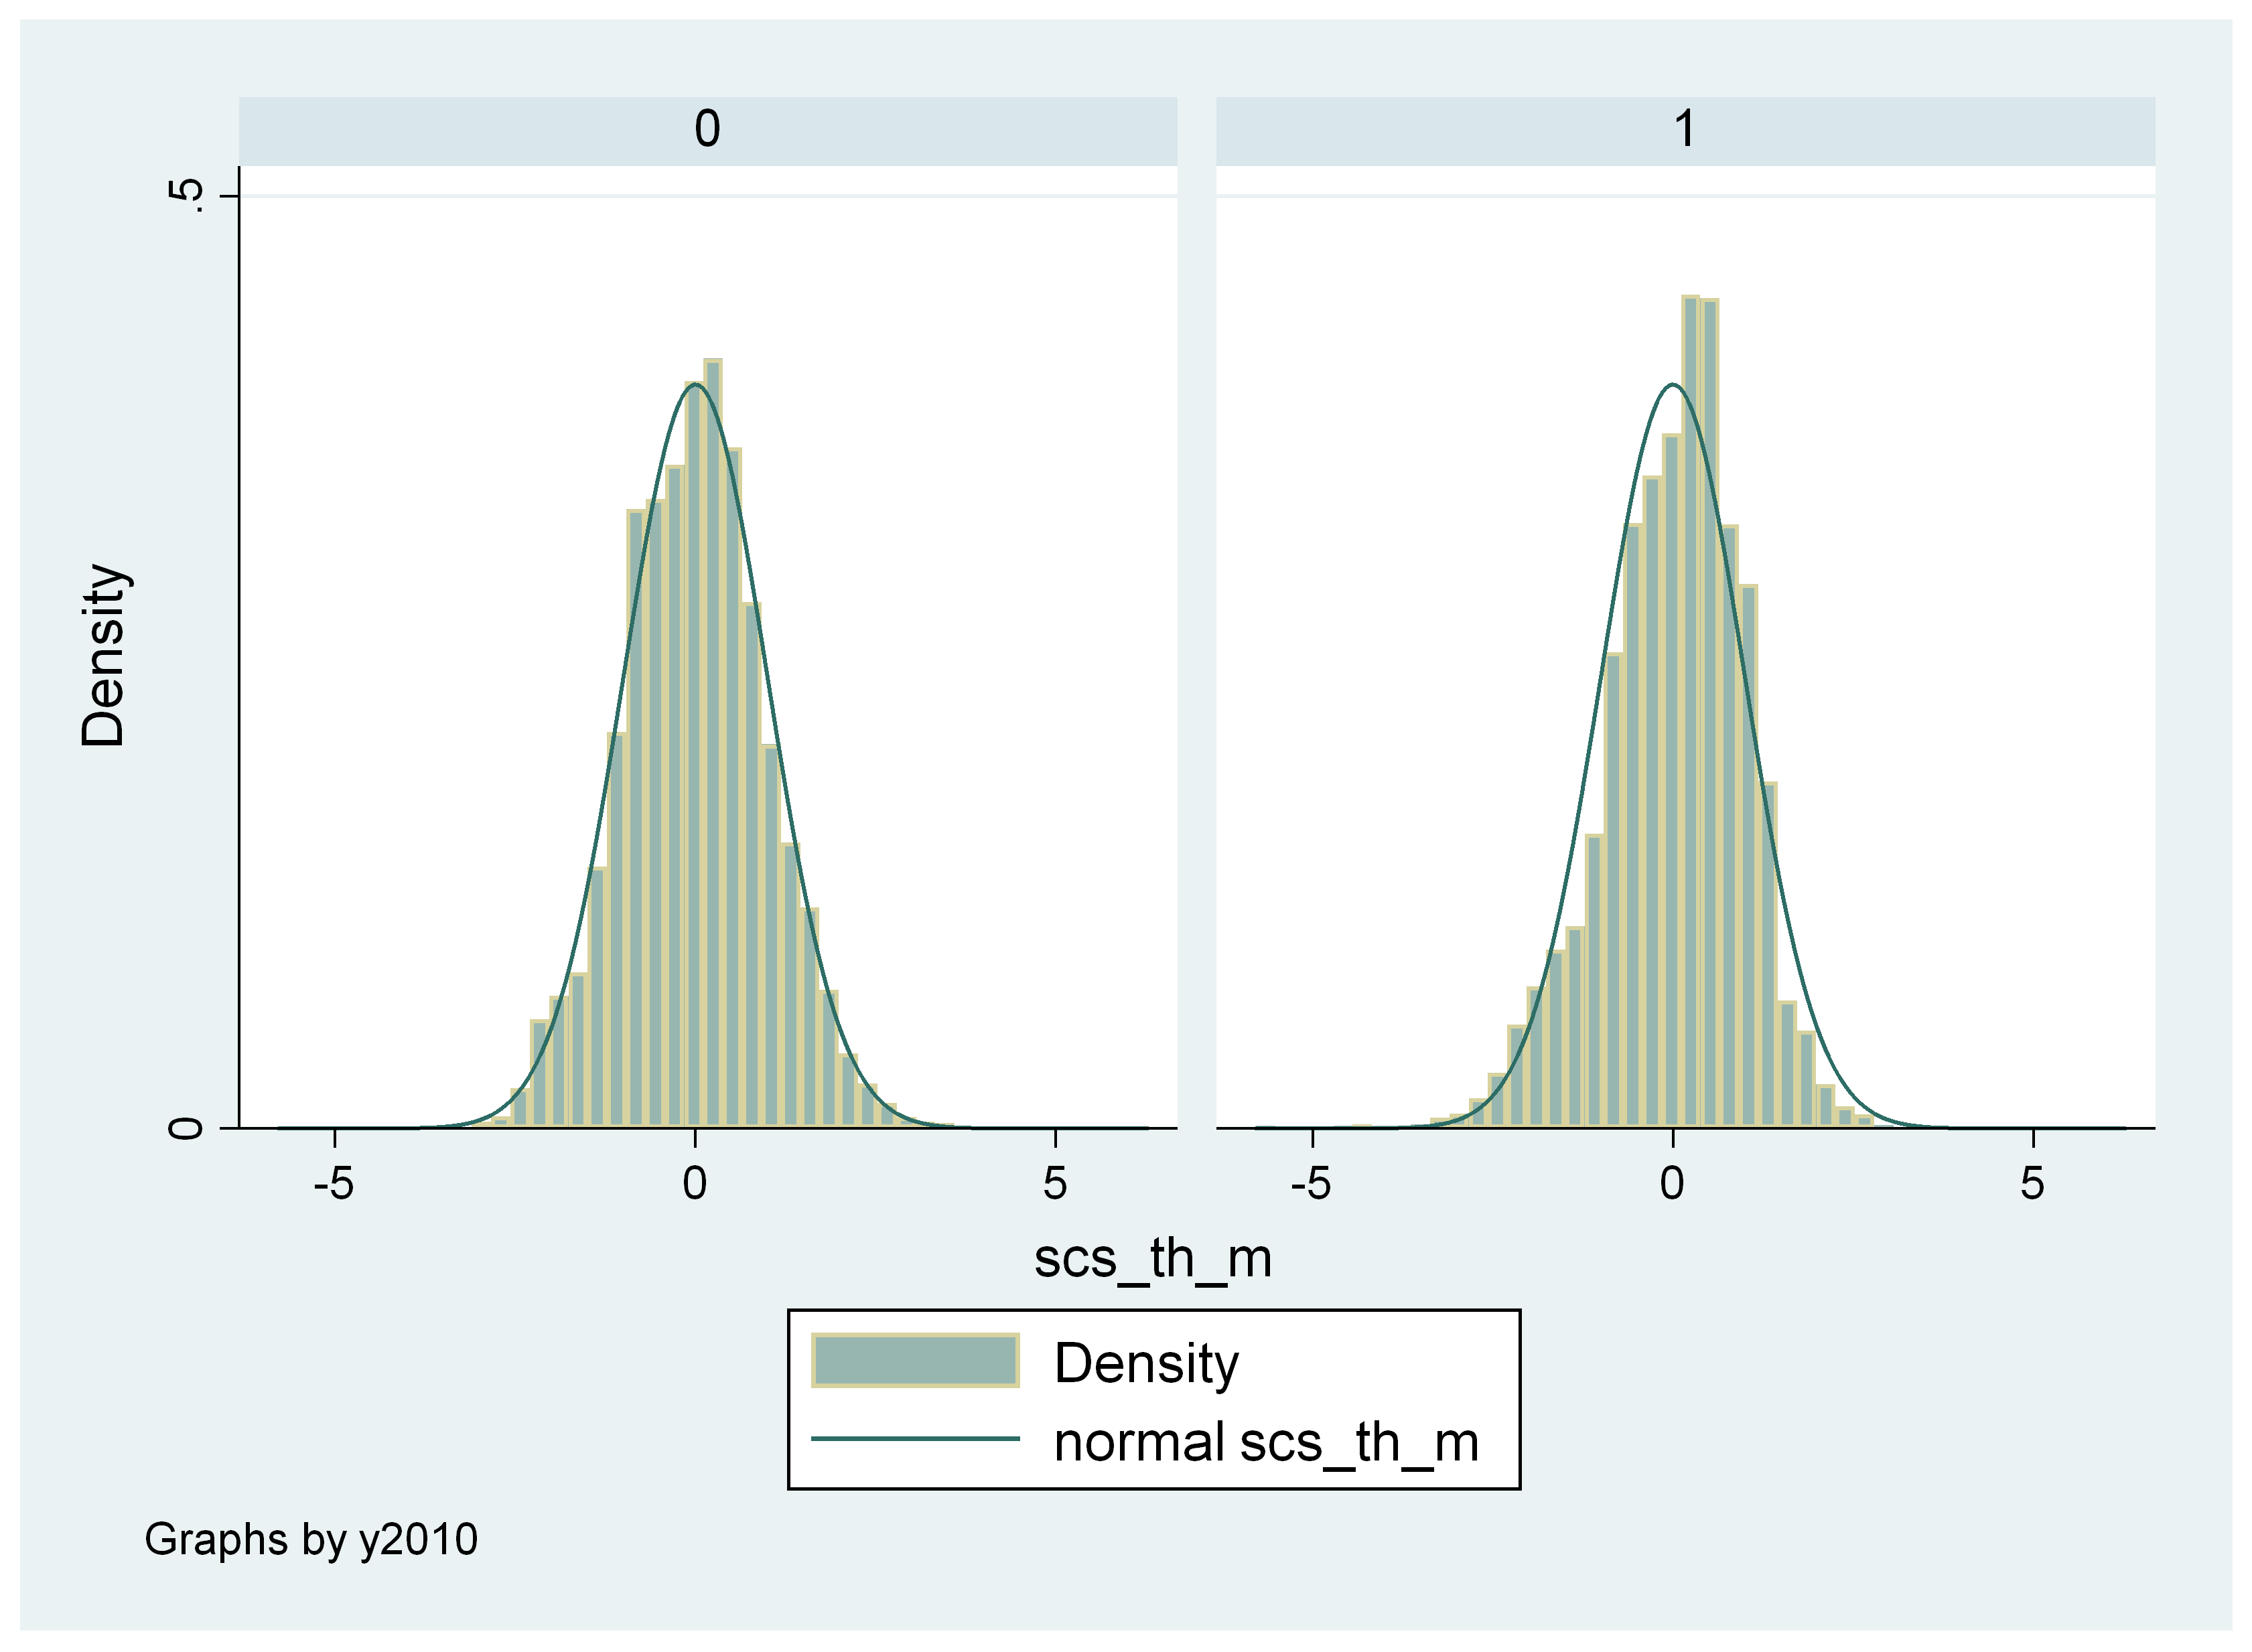
Theta scores, 1998 (left) and 2010 (right) Share on Facebook Tweet this chart EmbedCopy the code below to embed this chart on your website.<iframe width="100%" height="460" src="https://www.epi.org?p=134021&view=embed&embed_template=charts_v2013_08_21&embed_date=20260711&onp=134021&utm_source=epi_press&utm_medium=chart_embed&utm_campaign=charts_v2" frameborder="0"></iframe> Download image Previous chart: « Theta scores, 1998 (left) and 2010 (right) Next chart: Workers produced much more, but typical workers’ pay lagged far behind: Disconnect between productivity and typical worker’s compensation, 1948–2016 »