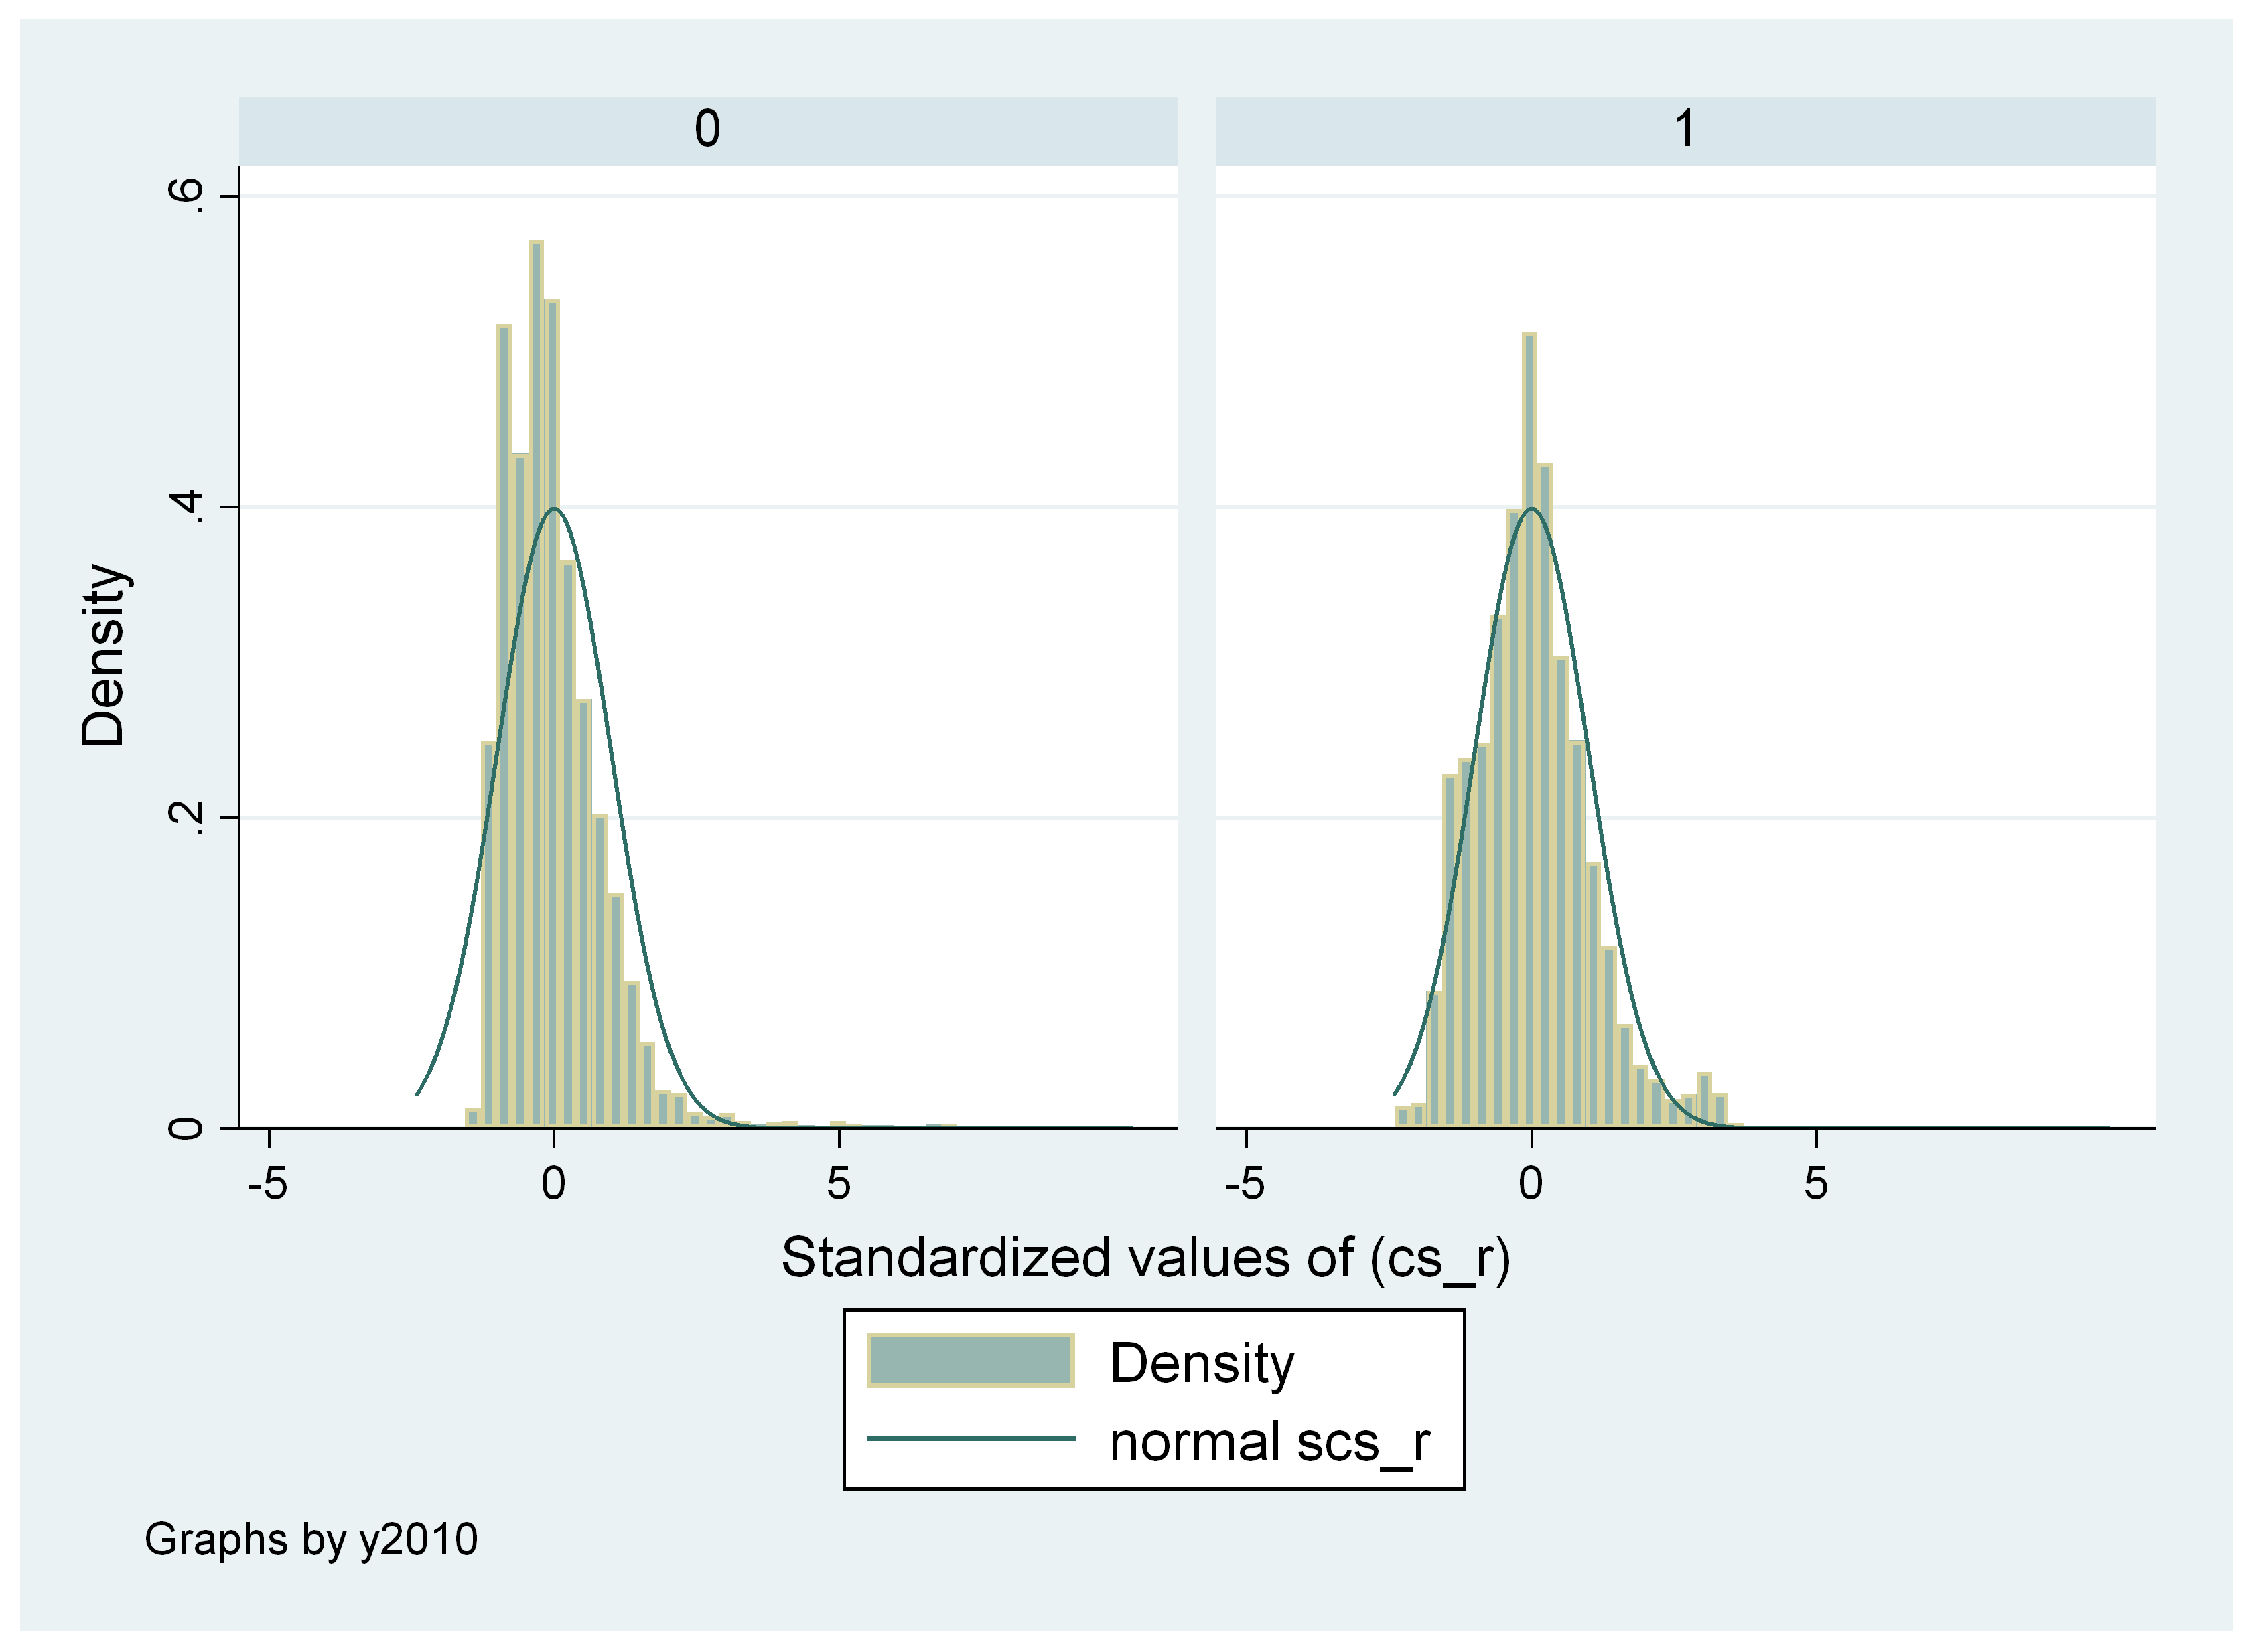

Previous chart: « Distribution of standardized scale and theta scores in mathematics, by year
Next chart: Theta scores, 1998 (left) and 2010 (right) »
Previous chart: « Distribution of standardized scale and theta scores in mathematics, by year
Next chart: Theta scores, 1998 (left) and 2010 (right) »