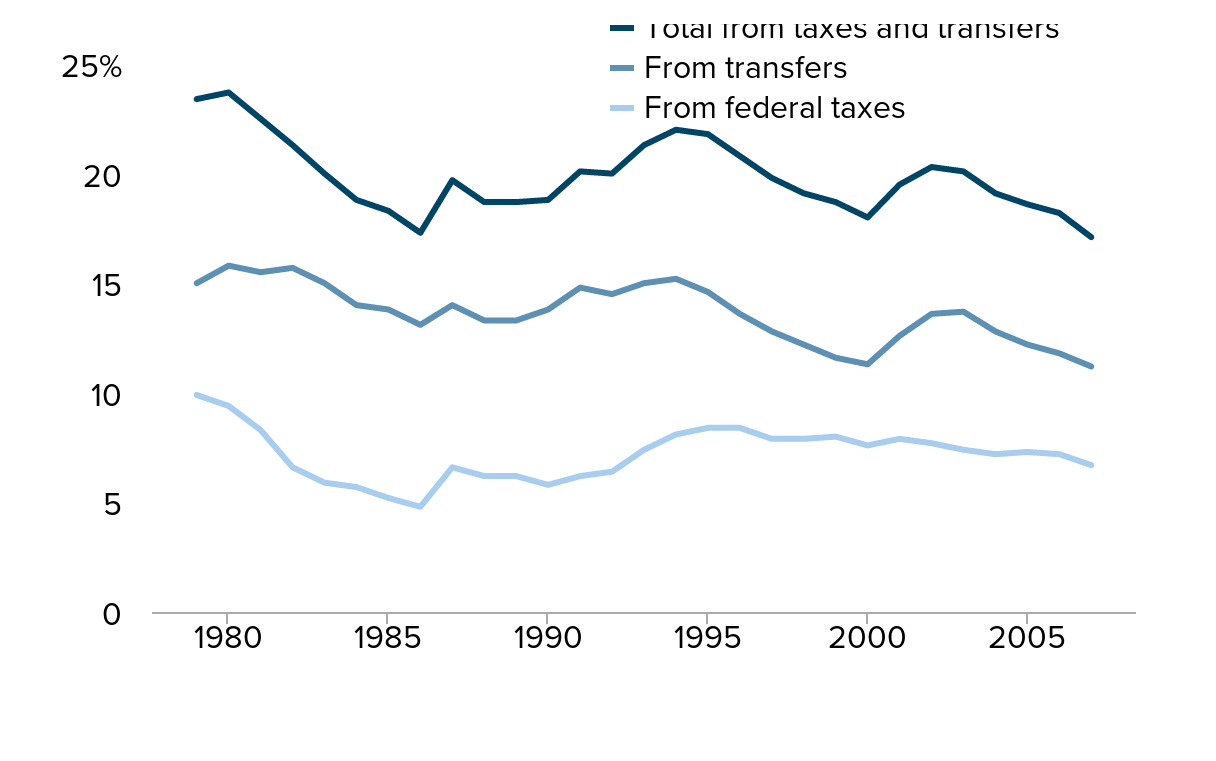
Figure B
Percent reduction in inequality (Gini index) from federal taxes and transfers, 1979–2007
| From federal taxes | From transfers | Total from taxes and transfers | |
|---|---|---|---|
| 1979 | 9.9% | 15.0% | 23.4% |
| 1980 | 9.4% | 15.8% | 23.7% |
| 1981 | 8.3% | 15.5% | 22.5% |
| 1982 | 6.6% | 15.7% | 21.3% |
| 1983 | 5.9% | 15.0% | 20.0% |
| 1984 | 5.7% | 14.0% | 18.8% |
| 1985 | 5.2% | 13.8% | 18.3% |
| 1986 | 4.8% | 13.1% | 17.3% |
| 1987 | 6.6% | 14.0% | 19.7% |
| 1988 | 6.2% | 13.3% | 18.7% |
| 1989 | 6.2% | 13.3% | 18.7% |
| 1990 | 5.8% | 13.8% | 18.8% |
| 1991 | 6.2% | 14.8% | 20.1% |
| 1992 | 6.4% | 14.5% | 20.0% |
| 1993 | 7.4% | 15.0% | 21.3% |
| 1994 | 8.1% | 15.2% | 22.0% |
| 1995 | 8.4% | 14.6% | 21.8% |
| 1996 | 8.4% | 13.6% | 20.8% |
| 1997 | 7.9% | 12.8% | 19.8% |
| 1998 | 7.9% | 12.2% | 19.1% |
| 1999 | 8.0% | 11.6% | 18.7% |
| 2000 | 7.6% | 11.3% | 18.0% |
| 2001 | 7.9% | 12.6% | 19.5% |
| 2002 | 7.7% | 13.6% | 20.3% |
| 2003 | 7.4% | 13.7% | 20.1% |
| 2004 | 7.2% | 12.8% | 19.1% |
| 2005 | 7.3% | 12.2% | 18.6% |
| 2006 | 7.2% | 11.8% | 18.2% |
| 2007 | 6.7% | 11.2% | 17.1% |

Source: CBO (2011)
This chart appears in:
Previous chart: « Income inequality (as measured by Gini index), by type of income measured, 1979–2007
Next chart: Average effective tax rates, by income percentiles, 1960–2004 »