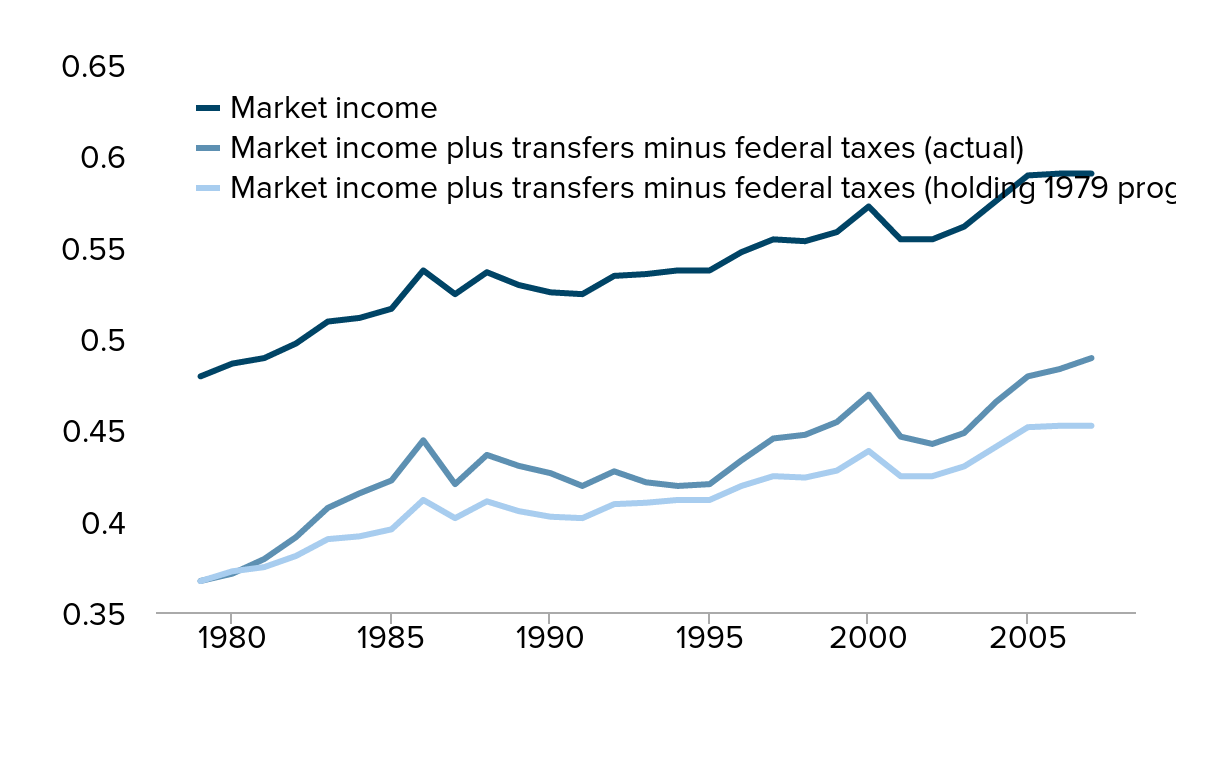
Figure A
Income inequality (as measured by Gini index), by type of income measured, 1979–2007
| Market income | Market income plus transfers minus federal taxes (actual) | Market income plus transfers minus federal taxes (holding 1979 progressivity) | |
|---|---|---|---|
| 1979 | 0.479 | 0.367 | 0.366914 |
| 1980 | 0.486 | 0.371 | 0.372276 |
| 1981 | 0.489 | 0.379 | 0.374574 |
| 1982 | 0.497 | 0.391 | 0.380702 |
| 1983 | 0.509 | 0.407 | 0.389894 |
| 1984 | 0.511 | 0.415 | 0.391426 |
| 1985 | 0.516 | 0.422 | 0.395256 |
| 1986 | 0.537 | 0.444 | 0.411342 |
| 1987 | 0.524 | 0.42 | 0.401384 |
| 1988 | 0.536 | 0.436 | 0.410576 |
| 1989 | 0.529 | 0.43 | 0.405214 |
| 1990 | 0.525 | 0.426 | 0.40215 |
| 1991 | 0.524 | 0.419 | 0.401384 |
| 1992 | 0.534 | 0.427 | 0.409044 |
| 1993 | 0.535 | 0.421 | 0.40981 |
| 1994 | 0.537 | 0.419 | 0.411342 |
| 1995 | 0.537 | 0.42 | 0.411342 |
| 1996 | 0.547 | 0.433 | 0.419002 |
| 1997 | 0.554 | 0.445 | 0.424364 |
| 1998 | 0.553 | 0.447 | 0.423598 |
| 1999 | 0.558 | 0.454 | 0.427428 |
| 2000 | 0.572 | 0.469 | 0.438152 |
| 2001 | 0.554 | 0.446 | 0.424364 |
| 2002 | 0.554 | 0.442 | 0.424364 |
| 2003 | 0.561 | 0.448 | 0.429726 |
| 2004 | 0.575 | 0.465 | 0.44045 |
| 2005 | 0.589 | 0.479 | 0.451174 |
| 2006 | 0.59 | 0.483 | 0.45194 |
| 2007 | 0.59 | 0.489 | 0.45194 |

Note: The Gini index is a commonly used measure of inequality, ranging from 0 (perfectly equitable income distribution) to 1 (perfectly inequitable income distribution).
Source: Author's analysis of CBO (2011)
This chart appears in:
Previous chart: « Regression of real GDP growth on the statutory corporate tax rate (standard errors in parentheses)
Next chart: Percent reduction in inequality (Gini index) from federal taxes and transfers, 1979–2007 »