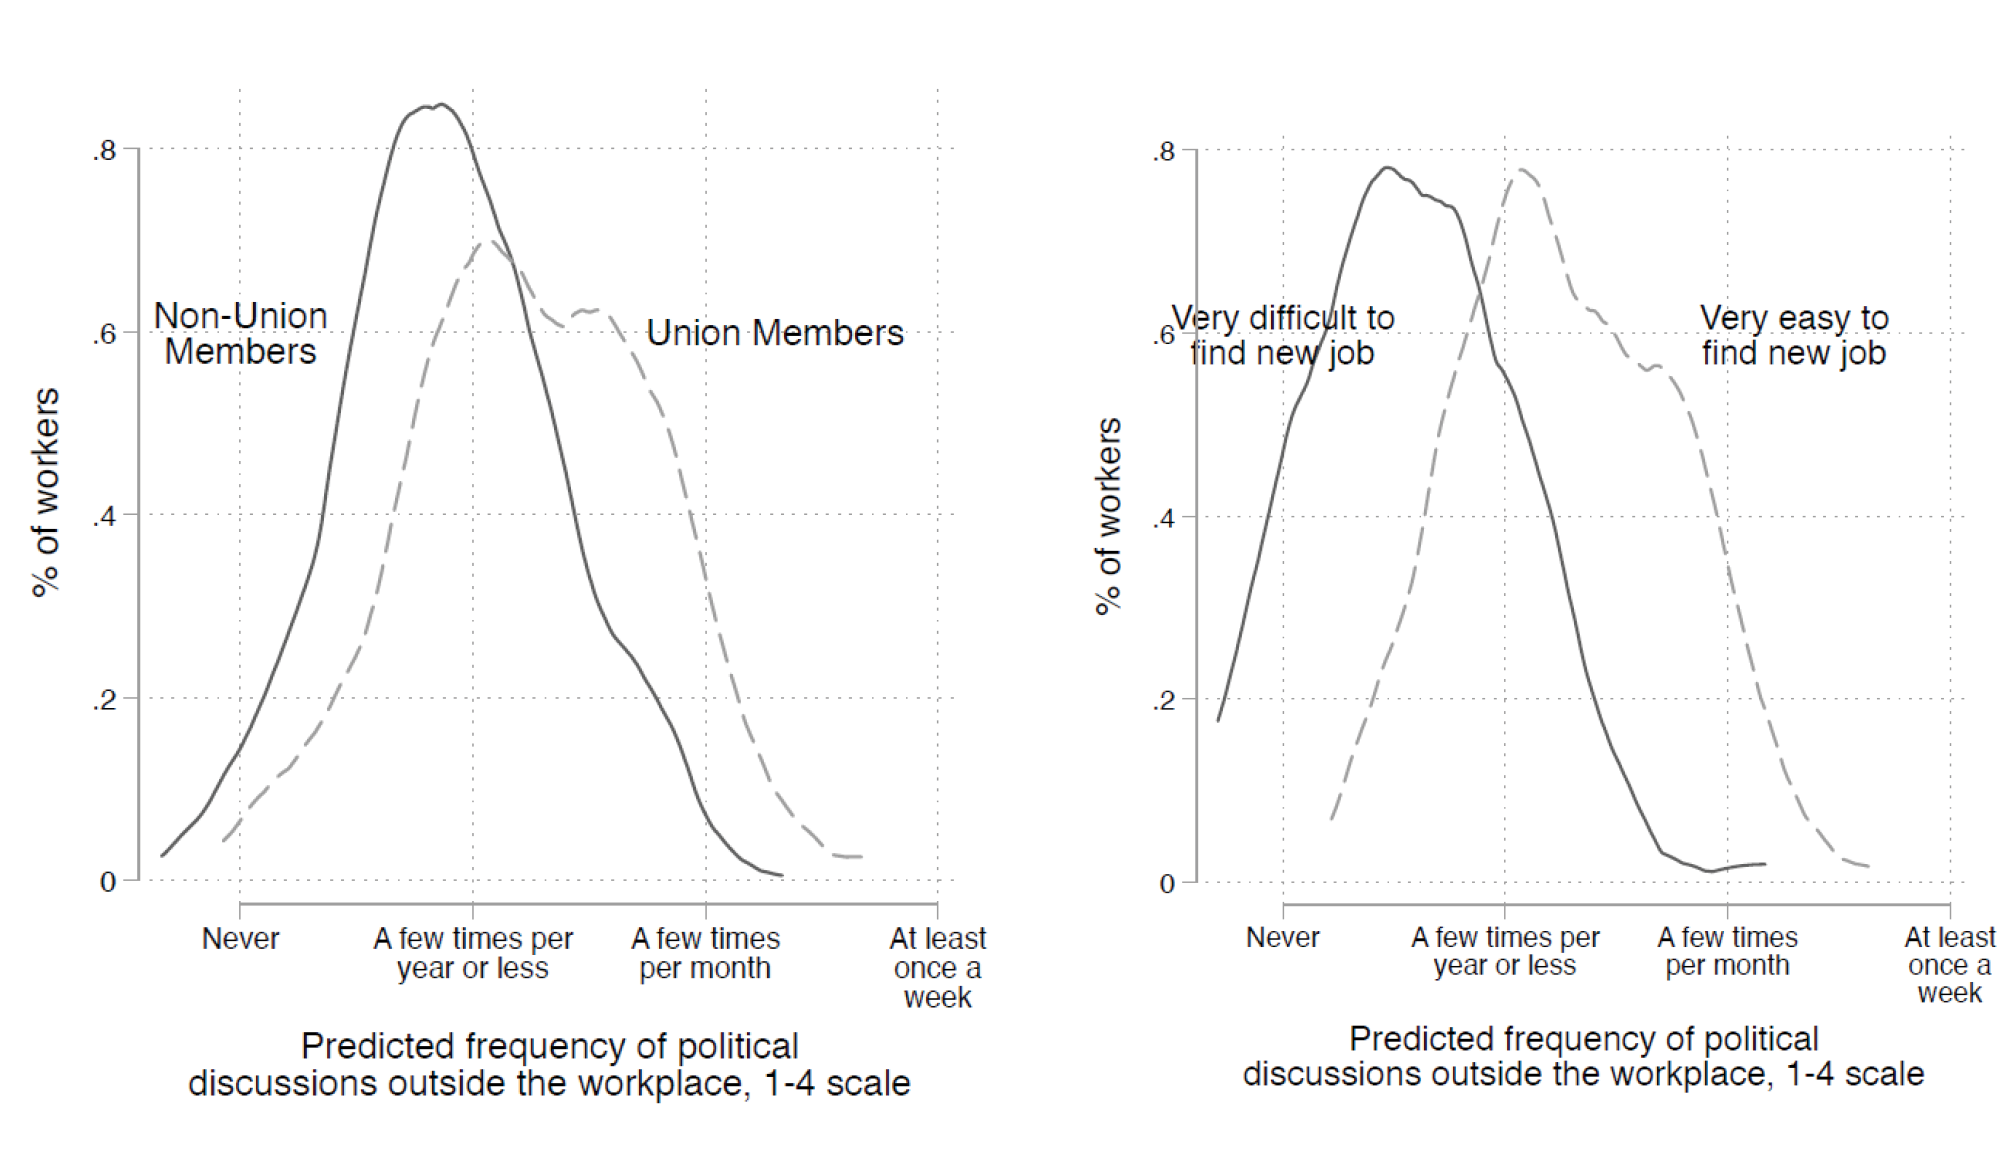
Figure IPredicted frequency of nonwork political discussions, by union membership and labor market power Notes: The two figures adjust for other worker and job-related characteristics. Source: 2019 Workplace Political Participation Study. Share on Facebook Tweet this chart EmbedCopy the code below to embed this chart on your website.<iframe width="100%" height="460" src="https://www.epi.org?p=211751&view=embed&embed_template=charts_v2013_08_21&embed_date=20260619&onp=211751&utm_source=epi_press&utm_medium=chart_embed&utm_campaign=charts_v2" frameborder="0"></iframe> Download image Previous chart: « The slow down is apparent: Monthly change in payroll employment, January 2020–September 2020 Next chart: Workers’ health insurance premiums are rising much faster than wages: Average annual earnings of the bottom 90 percent and premiums for employer-sponsored health insurance, 1999–2019 »