Why the Fed should cut interest rates this week
Better late than never, the Federal Reserve will almost surely cut interest rates at the Federal Open Market Committee (FOMC) meeting later this week. This cut is too long in coming—disinflationary pressures have been apparent in the economy for almost two years by now. In essence, the Fed decided to discount these disinflationary pressures and to only cut rates when inflation was not just falling rapidly, but was also low and extremely close to their 2% target. This approach took on far too much risk of throwing the economy into a totally unnecessary recession by keeping interest rates too high for too long. So far, a recession or damaging slowdown has thankfully been avoided, but there has been some notable labor market softening in recent months. Given all of this, the Fed should see its job now as quickly getting much closer to neutral on interest rates. This means cutting by at least 2 percentage points over the next year—so a cut of 50 basis points this week would be a better start than 25.
Background on interest rates compared with 2019
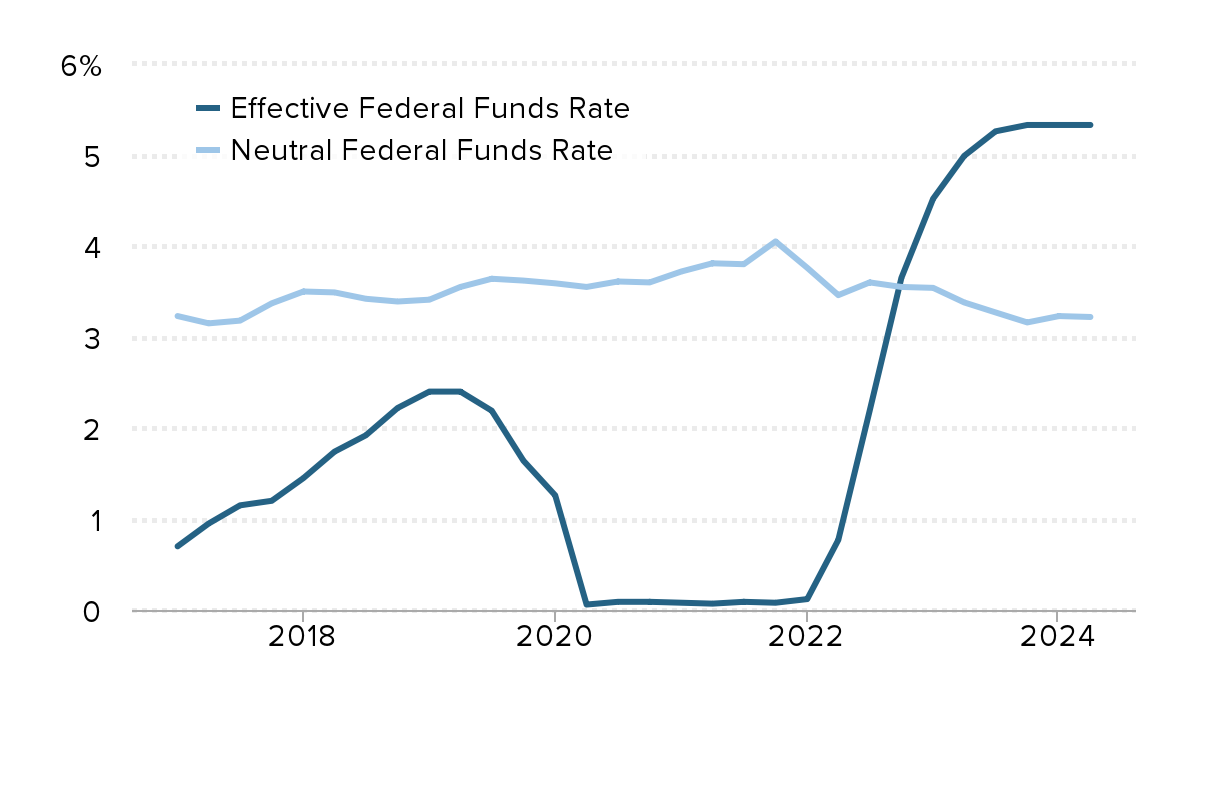
The effective federal funds rate today sits between 5.25-5.5%. In 2019, right before the pandemic hit, it sat between 1.5-1.75% (after a recent cut). Estimates of the “neutral” federal funds rate—the rate that is neither providing stimulus and inflationary pressure to the economy nor is it providing contraction and deflationary pressure—is roughly 2.5-3.5%. The neutral rate is often presented in real (inflation-adjusted) terms, with the inflation assumption being that the Fed is hitting its 2% target. That means a 1% real neutral rate should be read generally as a 3% nominal effective federal funds rate.
Figure A below shows one estimate of the neutral federal funds rate as well as the actual rate in recent years. By all estimates, today’s effective federal funds rate is far from neutral—it is clearly in contractionary territory. And by almost all estimates, the 2019 effective federal funds rate was far from neutral—clearly in stimulative territory.
Fed’s interest rates were expansionary until 2022 and strongly contractionary thereafter: Estimates of the neutral federal funds rate and the actual (effective) federal funds rate, 2018–present
| Neutral Federal Funds Rate | Effective Federal Funds Rate | |
|---|---|---|
| Jan-2017 | 3.23% | 0.70% |
| Apr-2017 | 3.15% | 0.95% |
| Jul-2017 | 3.18% | 1.15% |
| Oct-2017 | 3.37% | 1.20% |
| Jan-2018 | 3.50% | 1.45% |
| Apr-2018 | 3.49% | 1.74% |
| Jul-2018 | 3.42% | 1.92% |
| Oct-2018 | 3.39% | 2.22% |
| Jan-2019 | 3.41% | 2.40% |
| Apr-2019 | 3.55% | 2.40% |
| Jul-2019 | 3.64% | 2.19% |
| Oct-2019 | 3.62% | 1.64% |
| Jan-2020 | 3.59% | 1.26% |
| Apr-2020 | 3.55% | 0.06% |
| Jul-2020 | 3.61% | 0.09% |
| Oct-2020 | 3.60% | 0.09% |
| Jan-2021 | 3.72% | 0.08% |
| Apr-2021 | 3.81% | 0.07% |
| Jul-2021 | 3.80% | 0.09% |
| Oct-2021 | 4.05% | 0.08% |
| Jan-2022 | 3.76% | 0.12% |
| Apr-2022 | 3.46% | 0.77% |
| Jul-2022 | 3.60% | 2.19% |
| Oct-2022 | 3.55% | 3.65% |
| Jan-2023 | 3.54% | 4.52% |
| Apr-2023 | 3.38% | 4.99% |
| Jul-2023 | 3.27% | 5.26% |
| Oct-2023 | 3.16% | 5.33% |
| Jan-2024 | 3.23% | 5.33% |
| Apr-2024 | 3.22% | 5.33% |

Note: Estimates of the neutral federal funds rate from the Federal Reserve Bank of New York: https://www.newyorkfed.org/research/policy/rstar. The effective federal funds rate was downloaded from the Federal Reserve Economic Database (FRED) of the Federal Reserve Bank of St Louis. The neutral federal funds rate in the chart is the estimate from the New York Federal Reserve plus 2% to account for the Fed’s inflation targeting.
Today’s interest rates are too contractionary given the economic data
An important debate is warranted about whether the Fed, starting in 2022, needed to raise rates as fast and as high as they did to check rising inflation. But regardless of where one stands in that debate, it is becoming more and more clear that rates today need to be lowered quickly if the Fed wants to better balance the macroeconomic risks of inflation and unemployment. Given the relationship between key economic variables in 2019 and the effective federal funds rate in that year and these same relationships in 2022, the upshot is clear that today’s rate is inappropriately contractionary.
The key evidence is in Table 1 below, highlighting a number of indicators demonstrating why the Fed should quickly begin moving rates much closer to neutral.
Inflationary pressures have receded sharply since 2022–continuing through the latest 12 months
| 2022 value | Current value | 2019q4 value | Change since 2022 | ||
|---|---|---|---|---|---|
| Inflation (core PCE deflator) | (1) | 5.2% | 2.6% | 1.5% | -2.6% |
| Change in inflation most recent 12 months | (2) | 1.6% | -1.8% | -0.4% | -3.4% |
| Nominal wage growth | (3) | 5.0% | 3.7% | 3.2% | -1.3% |
| Change in wage growth most recent 12 months | (4) | 1.1% | -0.7% | 0.3% | -1.8% |
| Unemployment | (5) | 3.6% | 4.2% | 3.7% | 0.6% |
| Quits rate | (6) | 2.8% | 2.1% | 2.3% | -0.7% |
| Openings rate | (7) | 6.8% | 4.8% | 4.5% | -2.1% |
| LFPR relative to projections | (8) | -0.4% | 0.5% | 0.0% | 0.9% |
| Prime-age LFPR | (9) | 82.4% | 83.9% | 82.5% | 1.4% |
| Productivity growth | (10) | -1.9% | 2.7% | 2.1% | 4.6% |
| GSCPI | (11) | 2.16 | 0.20 | -0.04 | -1.96 |
| NFC profit margin | (12) | 20.0% | 19.5% | 14.9% | -0.6% |
Note: The Global Supply Chain Pressure Index (GSCPI) was downloaded from the Federal Reserve Bank of New York: https://www.newyorkfed.org/research/policy/gscpi#/interactive. The projected level of labor force participation rate (LFPR) that actual labor force participation is compared to comes from the Congressional Budget Office’s Budget and Economic Outlook, 2020-2029. All other data downloaded from the St Louis FRED. Nominal wage growth is measured by growth in average hourly earnings of all private sector workers from the Current Employment Statistics (CES) of the Bureau of Labor Statistics. The non-financial corporate (NFC) profit margin is profits divided by all other cost components in this sector of the economy.
The Fed’s 2% inflation target is officially based on the price index for personal consumption expenditures (PCE). Most observers think the Fed pays the most attention to the “core” of this index—prices excluding food and energy, which tend to be volatile and not reliably driven by the state of macroeconomic balance. Row 1 in Table 1 shows that the 2.6% current pace of inflation in the core PCE price index is slightly above the Fed’s long-run 2% target. Importantly, however, it has been cut in half since its peak levels in 2022, when inflation averaged 5.2%. Row 2 shows that the pace of this deceleration has been considerable even over the most recent 12 months. At its current pace, inflation will fall to the Fed’s inflation target by the end of 2024 and would quickly fall beneath the target thereafter.
Rows 3 and 4 show a similar dynamic at play for nominal wage growth. In 2022, nominal wages were growing at rates too fast to be consistent with the Fed’s 2% inflation target. But their current pace of growth (3.7%) is completely consistent with this inflation target, and the pace of deceleration (−0.7%) has been considerable over the past 12 months. At the current pace of deceleration, nominal wage growth will soon be too slow.
Slowing wage and price growth have been accompanied by softening in quantity-side measures of the labor market. Rows 5–7 show that the unemployment rate has risen since 2022, while measures of quits and openings in the labor market have declined to levels essentially the same as in 2019, when the federal funds rate was at expansionary levels and had recently been cut.
Rows 8–12 show measures of supply-side improvement since 2022. The high inflation of late 2021 and 2022 was predominantly driven by sharp supply disruptions in the early pandemic recovery. Row 8 shows the labor force participation rate—the share of the population over the age of 15 who either has a job or is actively looking for work—compared with long-run projections of where it would be expected to be during periods of full employment. Demographics are steadily pulling labor force participation down every year (as more Baby Boomers age out of active labor market participation), but we can compare how close the labor force participation rate is with estimates by the Congressional Budget Office (CBO) of what it should be given these demographic trends at full employment. In 2022, the labor force participation rate was 0.4% below these projections, but it was 0.5% above by the latest quarter of data. This is a large swing—totaling about 1.8 million potential workers—in the U.S. economy in just the past two years.
Row 9 shows this improvement is mostly driven by prime-age adults—those between the ages of 25 and 54. This prime-age labor force participation rate has risen by 1.4 percentage points over its 2022 average.
Row 10 shows the pace of productivity growth, with productivity defined as the output of goods and services produced in an average hour of work in the economy. In 2022, productivity was declining sharply at a 1.9% rate. But currently it is rising quickly at a 2.7% rate—a historically large swing in productivity. All else equal, productivity growth translates one-for-one into lower prices in the economy, so this swing in productivity from negative to positive is highly disinflationary.
Row 11 shows the Global Supply Chain Pressure Index (GSCPI) compiled by the Federal Reserve Bank of New York. The GSCPI aggregates a number of measures of supply-chain pressures like the price of shipping and wait times at ports. During 2021 and 2022, this index (with data going back to 1998) hit historic highs. Today’s reading is essentially normal, indicating that the supply disruptions that drove so much of the 2021–2022 inflation spike are behind us.
Finally, row 12 shows average profit margins in the nonfinancial corporate (NFC) sector. A historically large spike in these profit margins could account for significant parts of the early inflationary shock in the post-pandemic recovery. While profit margins have only retreated slowly from these historic highs, they have retreated. This means that profit margins are no longer adding to inflationary pressures and are at least putting some very mild downward pressure on inflation currently.
It’s past time for rate cuts—and they should not be small
The takeaway of all these indicators is clear. The economy’s supply side has expanded enormously since the peak inflationary year of 2022. The pandemic shocks that led to historic pressures on supply chains are past. The labor market has softened a bit in recent quarters and has been delivering rapid disinflation in both wages and prices consistently since the inflation peak of 2022. All these influences mean that we may severely undershoot the Fed’s inflation target before too long unless Fed policy quickly becomes far less contractionary.
Given the space between today’s contractionary stance and a neutral stance, and given how rapidly disinflation is occurring, the Fed should look to get to a fully neutral stance by summer 2025. It can take a solid step toward this by cutting interest rates by 50 basis points at this week’s meeting.
Enjoyed this post?
Sign up for EPI's newsletter so you never miss our research and insights on ways to make the economy work better for everyone.
