A 2023 Census data preview: Household incomes likely rose because of a strong labor market and falling inflation
Between 2022 and 2023, the unemployment rate held steady at 3.6% as the labor market added 3.5 million jobs. Over the same period, wages rose faster than inflation—which fell nearly in half. Upcoming Census Bureau data for 2023—set to be released on Tuesday—will reflect how these factors impacted annual earnings, income, and poverty of workers, families, and children across the country.
In 2022, the poverty rate increased and incomes fell as high inflation and the loss of pandemic-era safety net programs overshadowed labor market improvements. Even though those safety net programs have not returned, the Census data will likely show that a continued strong labor market coupled with falling inflation meant that livings standards increased among U.S. households in 2023.
In this blog post, we find:
- The labor market continued to pull workers off the sidelines as job growth was strong across demographic groups, particularly for those often left behind by economic growth.
- After spiking in 2022, inflation dropped sharply in 2023, far faster than the milder deceleration in nominal hourly and weekly wages. Real—inflation-adjusted—wages rose between 2022 and 2023, particularly among lower-wage workers, women, and Black workers.
The labor market recovery strengthened in 2023
The labor market experienced a tremendous bounceback from the depths of the pandemic recession. Large-scale policy interventions early in the recovery, such as expanded unemployment benefits and economic impact payments, helped families stay afloat and drove a recovery several times faster than the drawn-out recovery from the Great Recession. This strong fiscal boost is why it took just two years to regain the pre-pandemic prime-age employment-to-population ratio (EPOP)—the share of the population 25–54 years old with a job—compared with about 10 years to reach the same point following the Great Recession.
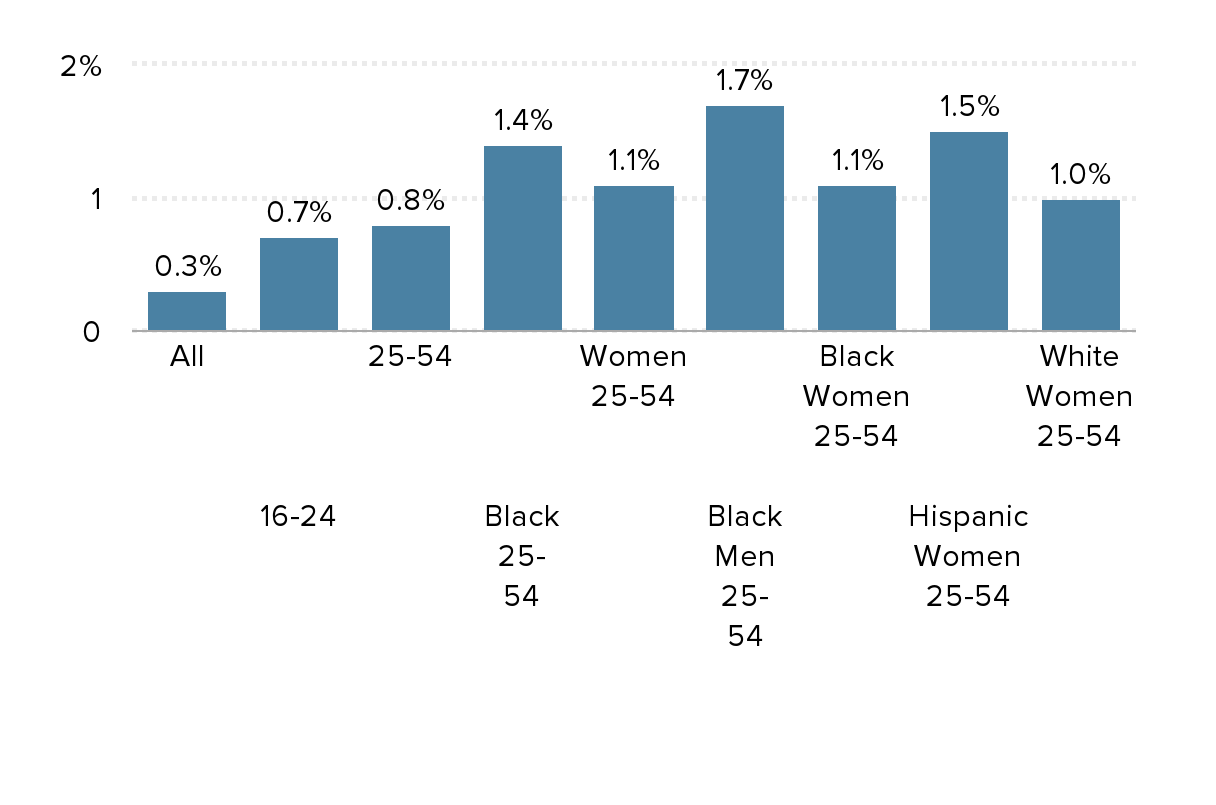
Figure A illustrates that the labor market continued to expand for workers in 2023. Even as the low unemployment rate held steady at 3.6%, the share of the population with a job grew, including for young adults (18–24 years old) and prime-age adults.
Among prime-age workers, Black and women workers had the largest gains. In particular, Black men’s EPOP rose 1.7 percentage points and Hispanic women’s EPOP rose 1.5 percentage points between 2022 and 2023. Black and white women also experienced solid gains.
In fact, Black workers and women overall—including Black, Hispanic, and white women—experienced historically high employment rates in 2023. While disparities remain, this means that the stakes for a robust labor market recovery are even higher for historically marginalized groups.
Labor market expansion between 2022 and 2023 was experienced most acutely by women as well as Black workers: Percentage-point change in employment-to-population ratio between 2022 and 2023 for select demographic groups
| Category | 2022-2023 percentage point change in EPOP |
|---|---|
| All | 0.3% |
| 16-24 | 0.7% |
| 25-54 | 0.8% |
| Black 25-54 | 1.4% |
| Women 25-54 | 1.1% |
| Black Men 25-54 | 1.7% |
| Black Women 25-54 | 1.1% |
| Hispanic Women 25-54 | 1.5% |
| White Women 25-54 | 1.0% |

Note: Race and ethnicity categories are mutually exclusive (i.e., Black non-Hispanic, Hispanic, all races). Young adults is defined as between the ages of 16 and 24. Prime-age is defined as between the ages of 25 and 54.
Source: Economic Policy Institute, State of Working America Data Library, “Employment-to-population ratio,” 2024.
Inflation fell sharply in 2023—paving the way for real wage increases
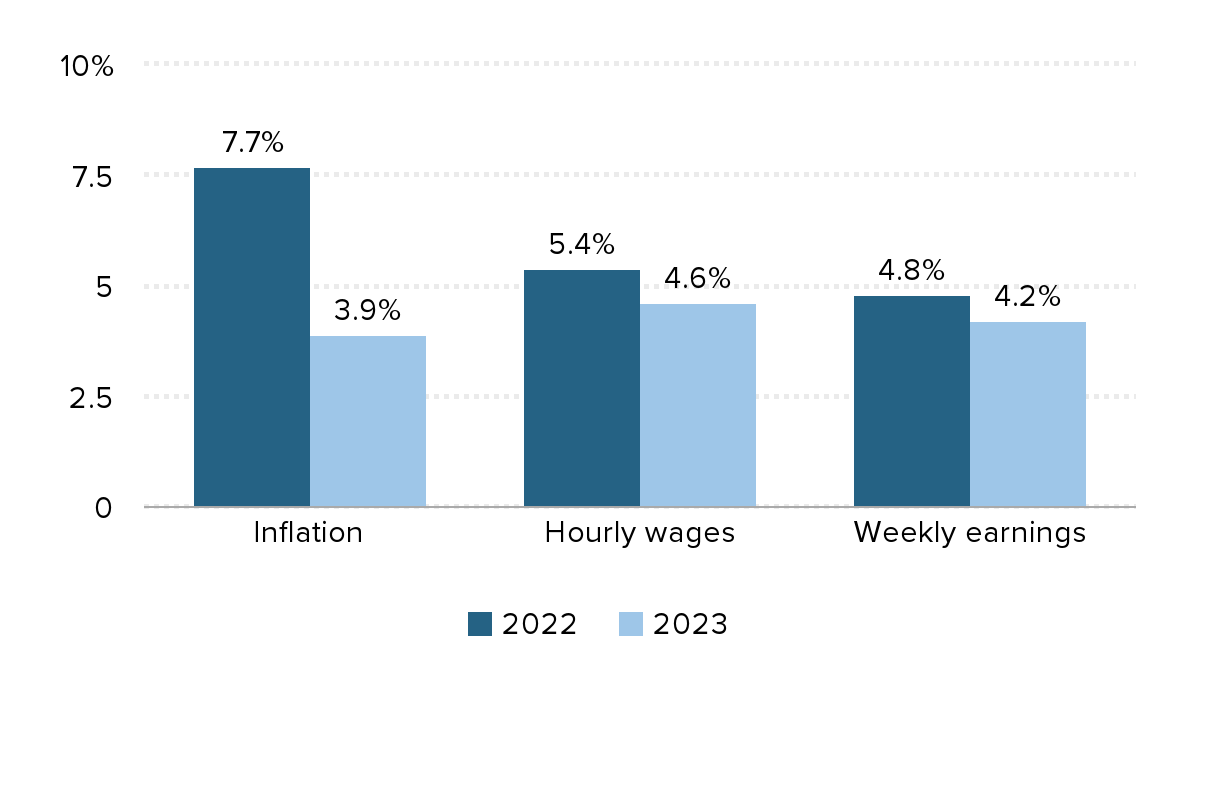
Even though job growth was strong and unemployment fell sharply in 2022 from the year before, the inflationary spike of that year swamped much of those gains. Between 2022 and 2023, however, inflation fell nearly in half, from 7.7% to 3.9%. Figure B shows this sharp decline in inflation juxtaposed against the much slower deceleration in average hourly wages and weekly earnings. As a result, nominal wages exceeded price growth in 2023, causing real hourly wages to rise.
Average nominal weekly earnings—perhaps a better signal for the annual income data out next week—also increased faster than inflation between 2022 and 2023.
Inflation fell sharply in 2023 even as nominal wages decelerated: Percent change in inflation, nominal hourly wages, and nominal weekly earnings in 2022 and 2023
| Category | 2022 | 2023 |
|---|---|---|
| Inflation | 7.7% | 3.9% |
| Hourly wages | 5.4% | 4.6% |
| Weekly earnings | 4.8% | 4.2% |

Note: Inflation data for 2023 represents a change in annual prices using the Chained CPI from 2022 to 2023; likewise, inflation data for 2022 is the annual change between 2021 and 2022.
Source: EPI analysis of Bureau of Labor Statistics Current Employment Statistics and Consumer Price Index public data series.
Real wages rose in 2023
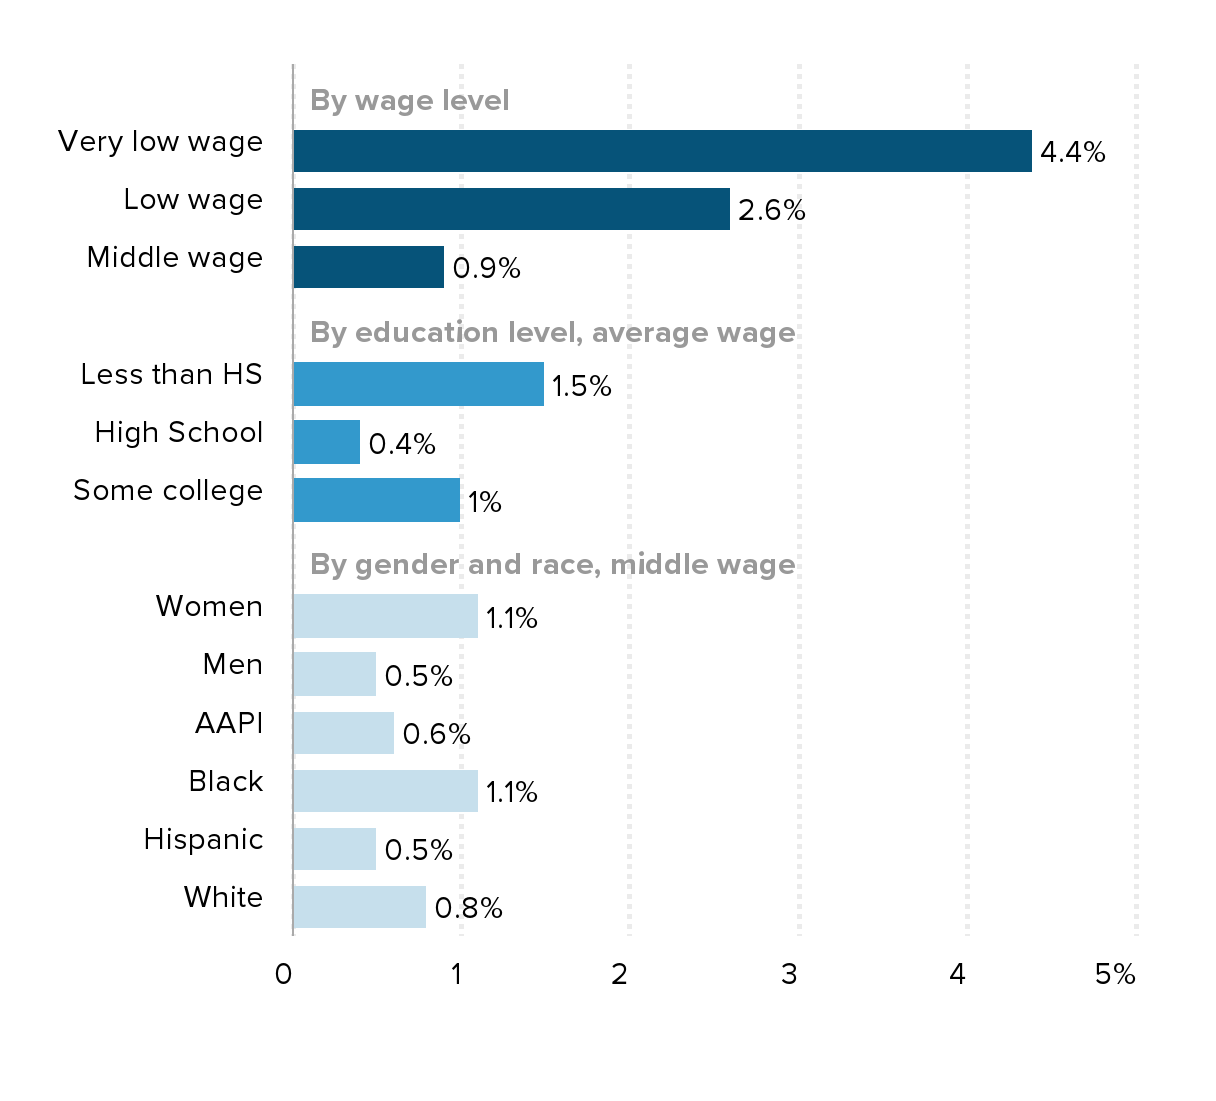
Figure C illustrates real wage changes between 2022 and 2023 for select wage levels, educational attainment, and demographic characteristics. As with the last four years in general, lower-wage workers have experienced faster wage growth.
Very low-wage workers (10th percentile) and low-wage workers (20th percentile) saw strong wage growth of 4.4% and 2.6%, respectively. Workers with lower levels of formal educational attainment also experienced relatively faster wage growth. Taken together with expanding employment, these trends are a promising sign that poverty may have fallen in 2023. Unfortunately, the pandemic safety net measures so critical coming out of the recession have long since expired, dashing any hopes of returning to the historically low poverty rates of 2021 (as measured by the supplemental poverty measure which includes those additional income sources).
While slower than the tremendous growth for lower-wage workers, middle-wage workers—the average of the 40th to 60th percentiles—saw their hourly pay rise by 0.9%. As with employment opportunities, the strongest middle-wage growth was among Black workers and women workers, each increasing 1.1% over the year.
Real wages rose between 2022 and 2023: Percent change in inflation-adjusted wages for select part of the wage distribution and demographic groups
| Wage Levels | |
|---|---|
| Very low wage | 4.4% |
| Low wage | 2.6% |
| Middle wage | 0.9% |
| Less than HS | 1.5% |
| High School | 0.4% |
| Some college | 1.0% |
| Women | 1.1% |
| Men | 0.5% |
| AAPI | 0.6% |
| Black | 1.1% |
| Hispanic | 0.5% |
| White | 0.8% |

Note: Race and ethnicity categories are mutually exclusive (i.e., Black non-Hispanic, Hispanic, all races). AAPI is Asian American Pacific Islander. Very low wage is the 10th percentile wage, low wage is the 20th percentile wage, and middle wage refers to the average of the 40th to 60th percentiles for all demographic groups. Wages by education group represent average changes.
Source: EPI analysis of the Current Population Survey Outgoing Rotation Group microdata, EPI Current Population Survey Extracts, Version 1.0.48 (2024a), https://microdata.epi.org.
Overall, I’m optimistic that a growing labor market, falling inflation, and rising wages will lead to a solid Census report on earnings, incomes, and poverty. Hopefully the stronger growth among historically disadvantaged groups will mean some shrinking of persistent large disparities.
Enjoyed this post?
Sign up for EPI's newsletter so you never miss our research and insights on ways to make the economy work better for everyone.
