Briefing Paper #329
The current debate over a bill that will greatly restrict public employee rights to collective bargaining in Ohio has focused attention on public employee compensation. In February, the Economic Policy Institute published a study that showed that full-time Ohio state and local public employees earn 3.3 percent less in wages and salaries than similar private sector workers and 3.5 percent less in total compensation. The findings presented in Are Ohio Public Employees Over-compensated? (Keefe 2011) were recently called into question by an Ohio Business Roundtable paper claiming that public workers make 43 percent more in total compensation than their private-sector colleagues (Biggs and Richwine 2011). The authors, Andrew G. Biggs of the American Enterprise Institute and Jason Richwine of the Heritage Foundation, concur with the EPI paper’s conclusion that public employees earn less in wages and salaries than comparable private-sector workers. But they object to the findings on compensation, writing, “Missing from the Keefe study are several aspects of compensation; specifically, retiree health benefits, the guaranteed nature of public-sector pensions, and the value of job security” (Biggs and Richwine 2011, 5). According to Biggs and Richwine, these omissions produced a 46 percent net increase in the value of public employee compensation. But their analysis is flawed because they projected a very low rate of return on public pension fund assets and committed other errors and obfuscations.
Problems with Biggs and Richwine’s Analysis
- Double counting Ohio retiree health benefits—which in Ohio are prefunded from employer and employee pension contributions—by counting them in addition to employer pension-fund contributions.
- Treating Ohio retiree health benefits as guaranteed benefits, when they are discretionary benefits.
- Using a 4 percent interest rate to project the value of future pension assets, when the Ohio Public Employees Retirement System (OPERS) has achieved 8.99 percent rate of return over the last 30 years. This undervaluation of pension assets inflates public employee compensation costs by overestimating what employers must contribute to meet future pension obligations.
- Calculating future pension liabilities based upon wage increases as if they are fixed and guaranteed when instead they are negotiated and depend on many environmental factors. This overvaluation of pension liabilities adds to the overestimation of what employers must contribute to meet future pension obligations.
- Estimating employee pension contributions as if they are fixed, though in fact they can be increased by the plan trustees if necessary to compensate for any shortfalls arising from a lower than expected return on pension asset investments.
- Arbitrarily reducing private-sector employer tax contributions for Social Security from 6.2 percent of payroll (up to $106,200) to 2 percent of payroll because they do not believe the Social Security benefits are worth 6.2 percent.
- Arguing that public employee job security confers a premium worth 9.3 percent that should be added to the estimated cost of employee compensation, even though there is no guaranteed job security in the Ohio public sector and no empirical evidence offered by the authors to support their claim of a job security premium or penalty.
- Making a number of important calculation obfuscations, including discount rate adjustment factor and normal cost of pensions that could not be replicated.
Furthermore, Biggs and Richwine’s analysis focuses on issues that are outside the scope of collective bargaining in Ohio and thus not pertinent to the debate over SB 5. Because retiree health benefits, the guaranteed nature of public-sector pensions, and job security are not subjects of public sector collective bargaining, the parties cannot enter into a binding enforceable contract involving any of these issues. Rather, retiree health benefits and public-sector pensions are legislated, not bargained, and management retains the right to set employment levels in public employment and can hire, fire, and lay off employees.
As Biggs and Richwine observe, “The main impact of SB 5, however, would be to reduce the number of employment issues that are collectively bargained …. SB 5 would disallow collective bargaining over most non-wage benefits and workplace conditions” (Biggs and Richwine 2011, 4).1
In short, Biggs and Richwine’s analysis is incorrect, and, even if it were not, it does nothing to inform the debate over SB 5. Rather than focusing on erroneous conclusions that are a diversion from the issues raised by SB 5, policymakers can make use of data directly relevant to the debate—data already published in the February EPI paper.
The EPI findings and Biggs and Richwine’s response
An often repeated argument for ending collective bargaining is to bring public employee costs in line with the private sector. But the research documented in Are Ohio Public Employees Over-compensated? shows that state and local government employees in Ohio are not overpaid. Comparisons controlling for education, experience, organizational size, gender, race, ethnicity, citizenship, and disability reveal that employees of state and local governments (referred to in this paper as public employees) earn lower wages than comparable private-sector employees. Average annual wages and salaries of full-time state and local public employees in Ohio are 5.9 percent lower than those of comparable private-sector employees. However, some full-time public employees work fewer hours on average, particularly college-educated employees. When annual hours worked are factored in, full-time state and local employees earn 3.3 percent less in wages and salaries than similar private-sector workers.
Looking at total compensation (wages and nonwage benefits), Ohio public employees annually earn 6.0 percent less on average than comparable private-sector employees and 3.5 percent lesson on an hourly basis. The analyses were adjusted for the increases in employer contributions to pension and retiree health insurance from 12 percent to 15 percent of total compensation, which reduced the hourly total compensation comparison to zero. In other words, public employees in Ohio earn no more and no less than similar private-sector employees in the state.
These comparisons account for important factors that affect earnings, the most important of which is level of education. Because occupations in the public sector require much higher levels of education, Ohio public-sector workers, on average, are more highly educated than private-sector workers; 49 percent of full-time public-sector workers in Ohio hold at least a bachelor’s degree, compared with 26 percent of full-time private-sector workers. Ohio state and local governments pay college-educated employees 24 percent less in annual total compensation, on average, than private employers.
The comparisons also reflect a big difference between the mix of wages and nonwage benefits in public and private sector compensation packages in Ohio. State and local government employees receive a higher portion of their compensation in the form of employer-provided benefits, and the composition of benefits is different from that provided in the private sector. For example, 29.7 percent of state and local government employee compensation expenses are devoted to nonwage benefits, compared with 18.9 percent to 22.8 percent of private-sector employee compensation costs. Public employers devote a larger share of their compensation packages to health insurance and pension benefits. Health insurance accounts for 12.9 percent of state and local government compensation but only 7 percent to 9.5 percent of private-sector compensation. Retirement benefits, including retiree health benefits, also account for a substantially greater share of Ohio public employee compensation—15 percent compared with 2.5 percent to 4.9 percent in the private sector.
Most public-sector employees also continue to participate in defined-benefit pension plans managed by the state, while most private-sector employers have switched to defined-contribution plans, particularly 401(k) plans, and many private-sector employers do not provide any contribution toward their employees’ retirement compensation beyond Social Security. On the other hand, public employees receive considerably less supplemental pay and somewhat less vacation time, and public employers contribute significantly less to legally mandated benefits financed through payroll taxes. For example, Ohio state government employees do not participate in Social Security, nor do most municipal workers.
To summarize, while some benefits are more generous in the public sector, it would be wrong to conclude that comparability of compensation between the public and private sectors requires that every element of compensation be the same. What is important is this: Considering both the cost of employer-provided benefits and direct wages, public-sector workers in Ohio receive compensation that is equal to what they would receive in the private sector.
The analysis that produced the findings above was criticized by Biggs and Richwine (2011) on three counts: that it omits the costs of retiree health benefits, doesn’t account for the guaranteed nature of public-sector pensions, and doesn’t factor in the value of job security. According to Biggs and Richwine, when these alleged omissions are included, Ohio public employees are overpaid by 43 percent.
Valuing retiree health benefits
Most states have pay-as-you-go financing of retiree health care benefits. This means that each year a state must allocate funds from its operating revenue to pay for health care for retired public employees. Ohio does not. Instead, Ohio prefunds its retiree health benefits from employer and employee pension contributions, which are then invested, with the investment income substantially contributing to the provision of these benefits. Ohio is considered a model plan for other states that still rely on pay-as-you-go financing. The Government Accountability Office estimated that retiree health benefits cost states approximately 2 percent of salary or 1.5 percent of total compensation (U.S. GAO 2007). While many states are debating whether they should begin prefunding these benefits, Ohio already does it.
Biggs and Richwine (2011) criticized the EPI study analyzing Ohio public employee pay for failing to account for retiree health benefits. They are mistaken. Because the analysis includes employer contributions to pensions, and because these contributions are invested to help cover retiree health care, the EPI analysis does include the retiree health benefit contribution.
Furthermore, a basic premise of the accounting in the Biggs and Richwine study (2011) is false. Biggs and Richwine maintain that retiree health insurance is an irrevocable and unalterable right, which is mandated to be funded by the state irrespective of any changes in the labor force or the state’s finances. But in Ohio public-employee retiree health care is not a guaranteed benefit. As the Ohio Public Employees Retirement System website explains, the OPERS Board of Trustees has made a commitment to provide health insurance as long as funds are available. OPERS has a separate retiree health insurance fund, and OPERS reports that “health care funding progress is measured by solvency period. OPERS has accumulated funds for a solvency expectation of about 11 years for this discretionary benefit”(OPERS 2011a). The 2010 OPERS Post-employment Health Care fund reserve was $12,319,743,979 as of Dec. 31 (OPERS 2011a, 34).
Finally, Biggs and Richwine’s accounting of how many and what proportion of state and local employees and private-sector employees participate in the retiree health insurance is too high. The most reliable source of data on current practices is the Medical Expenditure Panel conducted by the U.S. Department of Health and Human Services. According to panel data (U.S. DHHS 2011) only 36.4 percent of state and local governments provide health insurance to retirees under age 65, with 25.4 percent providing health insurance to retirees over age 65.
While it’s true that most state governments (all of which are large employers) offer retiree health benefits, many large private-sector firms (with more than 1,000 employees) also continue to provide health benefits to retirees: 34.5 percent of private firms with more than 1,000 workers provide such benefits to those under age 65 and 31.8 percent of such firms provide them to those over age 65. Other reports estimate employee use of retiree health insurance by looking at current employees who may become eligible if they eventually meet the age and service requirements.
For example, Richwine and Biggs (2011) cite a Pew Center on the States study (2010) that reports that 82 percent of state and local government employees in governmental units larger than 200 were eligible to receive retiree health care. However, to be eligible does not mean that employees will eventually receive these benefits. Employees must qualify for benefits through minimum years of service. Nonetheless, given the high rate of health cost inflation in the United States, the future prospects for retiree health insurance are grim. Ohio, however, retains considerable discretion over these benefits, including the rights to change co-insurance payments and even to cancel these benefits as is being done in the private sector. Presently, a number of states are integrating their retiree health benefits plans with Medicare Part D, which should offer significant savings for retiree prescription drug plans.
In summary, since retiree health benefits are discretionary, separately pre-funded, and not as widespread as estimated, the criticisms presented by Biggs and Richwine are incorrect. As a result their assertion that the provision of retiree health insurance represents a 6.3 percent additional cost to employee compensation is wrong.
It should be noted that the Pew Center on the States, which has been highly critical of the states’ management of public employee pension management and retiree health plan funding, gave Ohio its highest rating for managing long-term liabilities for both pensions and retiree health care in its 2010 report. They praised Ohio as a national leader in managing its long-term liabilities, and classified Ohio as a “solid performer” with respect to its pension fund and post retirement benefits—one of only 16 states to achieve that distinction.
Valuing employer contributions to public employee defined-benefit pensions and Social Security
There is substantial disagreement in the pension literature about measuring the present value of future pension payouts. This disagreement revolves around the “discount rate”—the appropriate interest rate to use when calculating the amount of money needed to be set aside today in order to make promised payments to retirees in the future. This rate is important in the discussion of employee compensation because it impacts how the cost of the pension component of compensation is calculated. Biggs and Richwine use an unnecessarily low rate which inflates the amount of money needed to be reserved to cover pension obligations. They compound this flaw by overestimating what those pension obligations will amount to in the first place (by, among other things, double counting retiree health costs, as explained above).
Many financial economists prefer the “riskless rate” measured as the yield on a 10-year (2.01 percent) or 30-year (3.26 percent) U.S. Treasury Bond to discount future pension obligations.2 In contrast, standard actuarial analyses based on generally accepted state and local accounting rules calculate liabilities using the historical return on plans’ return on assets, i.e., a discount rate of 8 percent, although this may be changing with the new Governmental Accounting Standards Board (GASB) guidelines.
In keeping with this standard, OPERS’ actuaries assume that over a 30-year period, the full working career of a public employee, the plan will earn 8 percent annually, on average. Over the past 30-year period, OPERS has exceeded that objective by earning on average 8.99 percent annually. Historically, investment returns fund approximately two-thirds of the income used to pay members’ Ohio public pension benefits. (Public employee defined-benefit pension plans in Ohio are funded by sizeable employer contributions of 14 percent to 18 percent of payroll (which includes 6 percent for retiree health insurance) and 10 percent to 11.1 percent of employee contributions.3
Despite OPERS’ 8.99 percent historical annual rate of return on long-term investments, Biggs and Richwine (2011) argue that because the Ohio public pension plans guarantee payments to retirees, the actuaries should be using a 4 percent “risk-free” interest rate to discount the pension plan’s long-term obligations. Citing an actuarial study commissioned by the state of Florida, they estimate that halving the projected rate of return (from OPERS’ assumed 8 percent to 4 percent) multiplies pension costs by an “adjustment factor” of 3.59, despite the fact that the Florida study does not actually estimate pension costs with an 8 percent discount rate.4 They then apply the adjustment factor to an erroneous pension normal cost of 15.44 percent of wages that double-counts retiree health costs, before subtracting the employee contribution of 10 percent. This procedure results in a pension cost equal to a whopping 45.4 percent of salaries.
In contrast to Biggs and Richwine, the OPERS trustees report a much lower employer normal cost of 5.35 of wages for the pension Traditional Plan (OPERS 2011a, 146). Even if we accept Biggs’ and Richwine’s dubious adjustment factor of 3.59, multiplying this by the trustees’ normal costs for the employer yields a pension cost of 19.21 percent, not 45.4 percent, of salaries.
This estimate is still predicated on an artificially low discount rate. Biggs and Richwine’s use of a 4 percent discount rate is based on the assumption that benefits are guaranteed and funding methods are fixed. In other words, this is the estimated long-run rate of return if OPERS wanted to guarantee that the amount contributed today would be sufficient to pay estimated future benefits and were willing invest in virtually risk-free assets such as U.S. Treasury bonds to ensure a fixed rate of return.
In fact, OPERS, like nearly all pension funds, invests in a balanced portfolio that includes stocks and corporate bonds among other assets. The risk-free rate is much lower than the expected rate of return on these assets, which OPERS estimates at 8 percent. If OPERS based required contributions on the risk-free rate rather than the expected rate of return on these assets, this would result in systematic overfunding and would shift pension costs from future taxpayers (who are likely to be wealthier due to economic growth) to current taxpayers.
Biggs and Richwine do not claim that the risk-free rate is the expected rate of return on pension fund assets, and Biggs has elsewhere assumed a higher rate of return for individual retirement accounts (Biggs 2002; Morrissey 2011). Instead, their argument is that a risk-free rate should be used because pension benefits are guaranteed. This is an incorrect assumption. While benefits accrued to date are guaranteed, a pension’s normal cost is based on projections that assume wage growth and other factors. So, for example, if pension benefits are based on years of service and an employee’s final average salary, pension funds estimate the normal cost based on a projected future salary rather than the employee’s current salary, though the employee is guaranteed neither continued employment nor salary increases (and employers facing unexpectedly high pension costs are more likely to constrain pay growth and lay off workers).
Furthermore, the trustees can adjust not only employer but also employee contributions to meet obligations if the realized rate of return is different than the projected rate of return. In the last several years, for example, employee contributions to OPERS increased from 8.5 percent of wages to 10 percent of wages in response to the financial collapse of Wall Street in 2008, and OPERS has done well to recover most of those investment loses (OPERS 2011a). Selecting the appropriate discount rate is critical in pricing any long-term project or investment. Since investment returns cover roughly two-thirds of the cost of OPERS pension benefits, using the appropriate discount rate is essential in evaluating the plans’ current and future performance. Table 1 illustrates the impact of alternative discount rates.
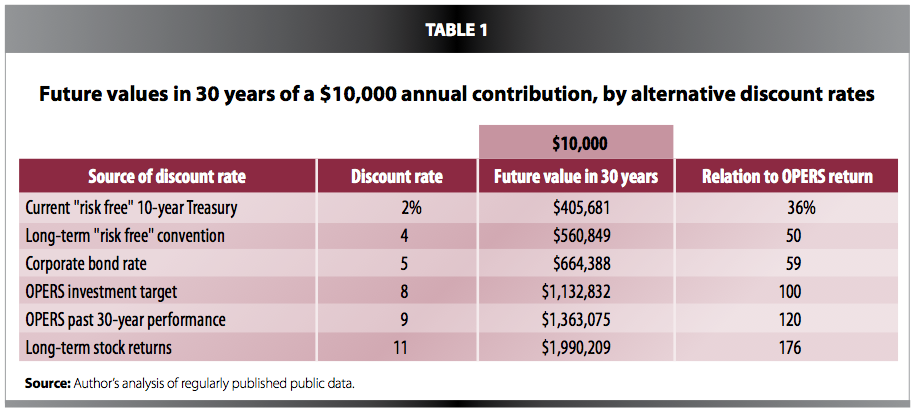
As the table shows, the selection of the appropriate discount rate greatly influences the valuation of $10,000 invested annually over 30 years. What the table does not show is the likely increase in volatility in returns as the discount rate rises. The advantage of a defined-benefit pension plan is that it creates a perpetual investment fund that can diversify against volatility over a long period of time (for example, an employee’s career of 30 or 40 years) in order to invest in securities that are more likely to produce higher returns.
In the past 30 years OPERS exceeded its investment goal by 20 percent, earning 2.43 times more than they would have earned with a 4 percent risk-free investment. In the past decade, OPERS, like most pension plans, has been unable to achieve its investment goals due to two serious recessions and a global financial crisis. Nonetheless, while earning only a 5 percent annual return during this last difficult decade for investors, OPERS has managed its portfolio well and should be able to achieve its goals over the next 30 years. A discount rate of 4 percent as applied by Biggs and Richwine clearly understates the value of Ohio’s pension assets.
A quick note about Social Security
As with pensions and retiree health insurance, Biggs and Richwine (2011) lose their focus on the cost of employer contributions to Social Security. They correctly report that private employers contribute 6.2 percent of payroll for Social Security taxes for wages up to $106,800 paid in 2011. But they then arbitrarily value that contribution at 2 percent.5
This is illogical. Comparing private and public employee earnings requires comparing employer costs for total hourly compensation, controlling for a variety of human capital attributes (education, experience, etc.). Compensation packages of equal cost are equal regardless of how compensation is allocated across wages and benefits. Thus the task is to compare employer costs of compensation, not what employees do or what others do on behalf of the employees with their compensation. The employer contributions to Social Security are part of the cost of the employees’ compensation. The EPI study accounts for the full Social Security contributions private-sector employers make on behalf of their employees in its benefits markup, based on the Employer Costs for Employee Compensation (ECEC) survey data collected by the Bureau of Labor Statistics (U.S. BLS 2010). Richwine and Biggs (2011) use their misrepresentation in accounting for employer contributions to Social Security as an arbitrary device to reduce the private-sector employers’ compensation costs by 4 percent, which inflates their estimated relative value of public employee pay.
Misapplying a compensating earnings differential for earnings instability
Biggs and Richwine (2011) assert that Ohio public employees receive an unwarranted compensation premium arising from job security. It is important to make a distinction between job security, which involves a legal guarantee of a job, and job stability, which arises from the normal working of the labor market. Ohio public employees have had job stability, but they do not have job security. More than 40,000 Ohio public employee jobs have been lost in the last five years (U.S. BLS 2011a), which clearly demonstrates that Ohio public employees lack any legal guarantee of job security.
Failing to make the distinction between security and stability leads Biggs and Richwine (2011) to misapply the finance concept of a “certainty equivalent” in building their model of job security to estimate a compensating earnings premium of 1.8 percent. Biggs and Richwine (2011) say that the utility model that they built shows that this increased public employee job security is equal to a 1.8 percent increase in compensation, based on revealed preference theory, i.e., that employees act “as if” they value a preference without actually demonstrating they do value an outcome or preference. This is a model based on a theory of job security that has no empirical support. In their discussion of job stability among Ohio private and public employees, they also conceptually shift from involuntary job loss to unemployment as their measure of instability, but unemployment is primarily composed of entrants to the labor force and is therefore not a accurate measure of job instability.
Instead of building a hypothetical model, we will directly examine the empirical evidence on job stability and compensating wage differentials. The Bureau of Labor Statistics’ Job Openings and Labor Turnover Survey (JOLTS) data (U.S. BLS 2011b) indicate that in 2010 the average private-sector worker had an 18 percent chance of being discharged or laid off during the year while the average state and local public employees had a 7 percent chance of involuntary job loss. The private sector has a wide range of practices; for example construction workers had a 57 percent change of involuntary job loss, while workers in finance and insurance had the same 7 percent rate as state and local public employees in 2010.
Empirically, if job stability is as valuable as Biggs and Richwine claim, we should be able to observe its effects on earnings across industries. Using the JOLTS data for 14 private-sector industries, average annual rate of discharge and layoff is averaged over the years 2001 to 2009 and reported in Table 2 in column one. We use the largest employing sector, retail, to make our relative comparisons. With a 20 percent annual rate of discharges and layoffs, retail has a rate slightly higher than the average for the entire private sector. If employment stability is as highly valued as Biggs and Richwine claim, there should be an observable compensating wage differential, all else equal, reflected in a large and observable pay premium, to attract workers to high involuntary turnover industries, while those who work in lower than average involuntary turnover industries should receive a large pay penalty, similar to what Biggs and Richwine predict for government workers.

Specific predictions are based on the rankings and rates of involuntary turnover by industry: those experiencing an involuntary turnover rate greater than 20 percent should have an instability premium, while those with a turnover rate less than 20 percent should have a stability penalty. If there is a meaningful compensating job stability differential, workers in the arts, entertainment, and recreation industry, for example, should receive the largest instability premium, since 49 percent of them on average experience an involuntary turnover per year, whereas workers in finance and insurance should receive the largest earnings penalty, since their annual involuntary turnover rate is only 9 percent.
A private-sector earnings equation with data from the BLS’ Current Population Survey with a complete set of human capital controls was estimated, so as not to confound the results with government earnings. The industry-omitted variable is retail, so the results reported in column two are in relation to the retail sector. Column three reports the variance of the estimated actual earnings differential from the predicted earnings differential. As is apparent in column three, without the need for any statistical tools, the predictions are uncorrelated with the results.
There is no obvious industry-level compensating wage differential for employment instability. The finance and insurance industry, which should have the largest job-stability penalty, has the third largest premium,6 whereas the accommodation and food services industry, which should have a large instability premium, in fact, has the largest penalty. It is not surprising that the estimates for a compensating wage differential premium/penalty failed.
Compensating differentials are notoriously difficult to capture. While most labor economists believe that compensating wage differentials do exist, there are many offsetting factors. Jobs are bundles of tasks and attributes that make them simultaneously both attractive and unattractive. Stability may be offset by a lack of control, autonomy, authority, safety, desirable work environment, commuting distance, or flexibility. There is no observable job instability compensating wage differential.
In the case of Ohio, our empirical results indicate that public employees are compensated roughly equal to private-sector employees. Biggs and Richwine, however, believe that Ohio public employees receive compensation approximately 31.2 percent higher than they would be likely to receive in alternative private-sector employment, because of their upward adjustments to hypothetical—not actual—employer contributions to pensions and retiree health benefits. Since they believe that job security protects not just the public employee job, but the pay premium as well, they incorporate their calculated 31.2 percent premium into their utility model and their estimated value of job security increases from 1.8 percent to 9.3 percent of compensation. Because we find no evidence of a compensation premium from job stability, we reject Biggs’ and Richwine’s assertion that public employees receive a 9.3 percent stability premium, and we reject their contention that Ohio public employees are overpaid by 43 percent.
The nature of the labor market for state and local government employees offers more plausible explanation for job stability. Approximately 49 percent of Ohio public employees are college educated. Americans with a college education had an average annual unemployment rate of 3.1 percent (ranging from 2.0 percent to 4.7 percent) from 2001 to 2011, while those with a high school education had an average unemployment rate of 6.3 percent (ranging from 4.2 percent to 10.7 percent) for the same period (U.S. BLS 2011c). A low unemployment rate labor market, indicating labor scarcity, requires organizations to devise different human resource policies regarding retention and turnover than a labor market that provides an ample supply of qualified labor.
Furthermore, state and local government employees actually experience much higher rates of layoffs than are recorded in the data. Most full-time employees working in education (kindergarten through university), who account for 54 percent of state- and local-government employment, are on 10-month contracts that provide extended 10-month salary payments and health benefits to be paid over 12 months. These teachers, faculty, and support staff represent more than 4 million employees nationally whose employment is interrupted each year but who are not subject to formal layoffs, which provides each state enormous savings in payouts for unemployment benefits that other seasonal workers often depend upon. As a consequence of the structure of their 10-month employment contracts, these public workers do not appear in the layoff data each year. Public employees experience instability in employment that is unaccounted for in the data and therefore understated in any employment stability analysis.
Conclusion: Public employees are not overcompensated
The earnings equation estimates from the EPI paper Are Ohio Public Employees Over-compensated? indicate that state and local government employees are not overpaid. These findings remain sound. Comparisons controlling for education, experience, hours of work, gender, race, ethnicity, citizenship, and disability find that public-sector wages and benefits are less than private-sector wages and benefits. There is no significant net difference between private and public employee compensation costs.
The analysis presented in this new EPI paper demonstrates that the criticisms that the earlier research failed to account for retiree health benefits, guaranteed pension benefits, and employment security is erroneous. The prior research has accounted for these issues, and represents a much more accurate assessment of public employee compensation costs, as summarized below.
EPI’s analysis accounts for retiree health benefits; Biggs and Richwine double counts them
Public employee retiree health benefits in Ohio are prefunded through employer pension contributions, and are discretionary benefits, not guaranteed by the state. The cost of retiree health insurance was included in the ECEC pension benefit contributions in the earlier analysis. The assertion that retiree health benefits represent an additional unaccounted for 6.3 percent cost to the state of Ohio is erroneous.
EPI’s analysis calculates employee pension costs based on a realistic rate of return; Biggs and Richwine inflate the cost by using a “risk free” rate of return
Public employee defined-benefit pension plans in Ohio are funded by sizeable employer contributions of 14 percent to 18 percent of payroll (which includes 6 percent for retiree health insurance) and 10 percent to 11.1 percent of employee contributions. Over the last 30 years OPERS has earned an 8.99 percent rate of return, exceeding its target rate of 8 percent by a 20 percent accrued value. Biggs and Richwine’s assertion that the plan should use a 4 percent “risk-free” interest rate to discount the pension plan’s long-term obligations because Ohio public pension plans guarantee payments to retirees and have inflexible funding is incorrect. While benefits accrued to date are guaranteed, a pension’s normal cost is based on projections that assume wage growth and other factors arising from wage and employment years that are not guaranteed. Furthermore, OPERS has the authority to increase contributions and use the retiree health-benefit plan contributions to meet pension obligations. By halving the projected rate of return and multiplying an erroneous normal pension cost that double counts retiree health costs by an unsubstantiated “adjustment factor,” Biggs and Richwine conclude that public employee pension costs equals 45.4 percent of salaries. This hypothetical cost is inflated and does not reflect current employer costs of employing an Ohio state or local employee.
Biggs and Richwine arbitrarily deflate private-sector Social Security costs
Biggs and Richwine’s treatment of the cost of Social Security payments is a manipulation to reduce private-sector compensation and widen the alleged compensation gap. They disagree with the funding mechanism for Social Security that has been in place since 1935. They arbitrarily decided that the employer’s 6.2 percent contribution is worth only 2 percent to employees. Since Ohio does not pay Social Security taxes for public employees, this lowers private-sector compensation costs by 4.2 percent and widens the alleged pay gap between private- and public-sector workers. This 4.2% adjustment to private-sector compensation costs has no logic in what is being computed—the cost of employing an employee. Private-sector employers who pay Social Security taxes do not receive the Biggs and Richwine adjustment.
There is no evidence for Biggs and Richwine’s job stability premium for public-sector workers
Although our comparison of job stability and pay in various industries shows no evidence of a job stability premium, Biggs and Richwine say that public employees earn a 9.3 percent compensation premium. This calculation is based on the faulty hypothetical upward adjustments to employer contributions to pensions and retiree health benefits discussed above, that produced an alleged 31.2 percent compensation premium. But they offer no evidence for a job stability premium for public employees in Ohio or elsewhere.
None of the issues raised by Biggs and Richwine are subjects of public employment collective bargaining in Ohio, and thus should not divert us from what is important in the public debate over Ohio Senate Bill 5.
Our research informs that debate. It revealed substantially different approaches to staffing and compensation between the private and public sectors. On average, Ohio state and local public-sector workers are more highly educated than the private-sector workforce; 49 percent of full-time state and local public-sector workers have at least a four-year college degree, compared with 26 percent of full-time private-sector workers. For workers with a bachelor’s degree, state and local governments pay salaries on average over 25 percent lower than private employers. The total compensation of college-educated private-sector employees is more than 20 percent higher than the compensation of similarly educated public employees. The earnings differential is greatest for professional employees such as lawyers and doctors. These earnings differences may create opportunities for cost saving by reviewing professional outsourcing contracts to examine what work might be performed by lower cost public employees.
The public sector appears to set a floor on compensation that raises the compensation of workers with high school educations in comparison with similarly educated workers in the private sector. This result is in part because the compensation floor has collapsed in the private sector.
Benefits are allocated differently between Ohio private- and public-sector full-time workers. State and local government employees receive a higher portion of their compensation in the form of employer-provided benefits, and the mix of benefits is different than in the private sector. Public employers underwrite 34.1 percent of employee compensation in benefits, whereas small private employers devote 26.3 percent of their compensation for benefits for employees, versus 33.1 percent for large employers. Ohio public employers provide better health insurance and pension benefits. Health insurance accounts for 7.4 percent of private-sector compensation but 11.2 percent of state and local government employee costs, a 50 percent greater share of employer costs. Retirement benefits also account for a substantially greater share of Ohio public employee compensation, 15 percent compared with 9.2 percent in the private sector including Social Security. Public employees also continue to participate in defined-benefit plans managed by the state, while private-sector employers have switched to defined-contribution plans, particularly 401(k) plans. On the other hand, public employees receive considerably less supplemental pay and less vacation time, and public employers contribute significantly less to legally mandated benefits.
A comprehensive assessment of the total costs of employing Ohio state and local government employees reveals that they are neither overpaid nor underpaid when compared to comparable private-sector employees.
—Jeffrey H. Keefe is associate professor of labor and employment relations at the School of Management and Labor Relations, Rutgers University, where he conducts research on labor markets, human resources, and labor-management relations to inform public policy. He teaches courses on collective bargaining, negotiations, financial analysis, benefits and social insurance, and strategic research. He earned his Ph.D. at Cornell University.
Endnotes
- It also eliminates most dispute resolution procedures and removes the right to collective bargaining from a substantial portion of the public-sector workforce.
- The current risk free rate is set by the yield on a 10-year Treasury bond, which is currently 2.01, as of September 12, 2011. This risk free rate should be used by Biggs and Richwine; however, the use the conventional risk free rate of 4%, which is completely arbitrary. If the used the 2.01 percent rate, the unfunded liabilities would be so large that no one could accept their estimates.
- Consulting firm Aon Hewitt (2011) reports that large employers provide 13.8 percent of compensation toward retirement which includes Social Security, while the state of Ohio contributes 14 percent.
- The letter from actuarial and consulting firm Milliman (DuZebe 2011) that they use to calculate the adjustment factor does not provide an analysis of an 8 percent target rate and thus does not indicate a 3.59 adjustment factor. It provides an analysis of 7.75 percent target rate for Florida. Using the 4 percent rate, Milliman provides an adjustment factor of 2.97. Biggs and Richwine do not provide documentation on how they arrive at a 3.59 adjustment factor.
- Biggs and Richwine use the 2 percent figure because they disagree with Social Security as a pay-as-you-go plan, even though it provides the majority of income for more than 80 percent of the retired workforce—an arbitrary and incorrect decision.
- In 2010 and 2011, the finance and insurance industry had the lowest involuntary turnover in the United States, considerably lower than public employment, while providing the highest compensation after controlling for human capital, strongly suggesting there is not a powerful compensating differential for stability operating in U.S. labor markets.
References
Aon Hewitt. 2011. “Aon Hewitt Benefit Index: Summary of 2010 results for Ohio PERS.” PowerPoint presentation accessed from Ohio Public Employees Retirement System website. https://www.opers.org/news/ORSC/2011/Aon-Hewitt_Benefit_Summary.pdf
Biggs, Andrew G. 2002. “The Stock Market and Social Security Reform.” Cato Institute website, Sept. 21. http://www.cato.org/pub_display.php?pub_id=3601
Biggs, Andrew and Jason Richwine. 2011. Public vs. Private Sector Compensation in Ohio: Public workers make 43 percent more in total compensation than their private‐sector colleagues. Columbus, Ohio: Ohio Business Roundtable.
DuZebe, Robert S. 2011. Study Reflecting Impact to the FRS of Changing the Investment Return. Seattle: Milliman.
Keefe, Jeffrey H. 2011. Are Ohio Public Employees Over-Compensated? Economic Policy Institute Briefing Paper # 296. Washington, D.C.: EPI.
Morrissey, Monique. 2011. Discounting public pensions: Reports of trillions in shortfalls ignore expected returns on assets. Economic Policy Institute Policy Memorandum #179. Washington, D.C.: EPI. http://www.epi.org/page/-/EPI_PolicyMemorandum_179.pdf
Ohio Public Employees Retirement System (OPERS). 2011a. The Comprehensive Annual Financial Report 2010. Columbus, Ohio: OPERS.
Ohio Public Employees Retirement System (OPERS). 2011b. 2010 Summary Annual Financial Report. Columbus, Ohio: OPERS.
Pew Center on the States. 2010. The Trillion Dollar Gap: Underfunded State Retirement Systems and the Road to Reform. Washington, D.C.: Pew Center on the States.
Richwine, Jason and Andrew Biggs. 2011. Are California Public Employees Overpaid? Heritage Foundation Center for Data Analysis Report No. CDA11-01. Washington, D.C.: Heritage Foundation; http://www.heritage.org/ Research/Reports/2011/03/Are-California-Public-Employees-Overpaid.
U.S. Bureau of Labor Statistics (BLS). 2010. “Employer Costs for Employee Compensation, June 2010,” BLS website (accessed March 2011.) (With unpublished detailed compensation data for the East North Central Census Division).
U.S. Bureau of Labor Statistics (BLS). 2011a. “Current Employment Statistics. State and Area Employment, Hours, and Earnings.” BLS website accessed Sept. 20.
U.S. Bureau of Labor Statistics (BLS). 2011b. “Job Openings and Labor Turnover Survey” (JOLTS). BLS Office of Employment and Unemployment Statistics website, accessed Sept. 20. http://www.bls.gov/jlt/
U.S. Bureau of Labor Statistics (BLS). 2011c. “Current Population Survey, annual averages, household data,” BLS website accessed Sept. 20. http://www.bls.gov/cps/tables.htm#charunem_m
U.S. Government Accountability Office (GAO). 2007. State and Local Government Retiree Benefits: Current Status of Benefit Structures, Protections, and Fiscal Outlook for Funding Future Costs. Report to the U.S. Senate Committee on Finance. Washington, D.C.: GAO; http://www.gao.gov/new.items/d071156.pdf
U.S. Department of Health and Human Services (DHHS)/Agency for Health Care Research and Quality (AHRQ) and National Center for Health Statistics (NCHS) Medical Expenditure Panel Survey (MEPS). Accessed March 10 2011.
