Briefing Paper #323
An update of this paper, titled The China Toll, was released in 2012.
Since China entered the World Trade Organization in 2001, the extraordinary growth of U.S. trade with China has had a dramatic effect on U.S. workers and the domestic economy. The United States is piling up foreign debt and losing export capacity, and the growing trade deficit with China has been a prime contributor to the crisis in U.S. manufacturing employment. Between 2001 and 2010, the trade deficit with China eliminated or displaced 2.8 million jobs, 1.9 million (69.2 percent) of which were in manufacturing. The 1.9 million manufacturing jobs eliminated or displaced due to trade with China represents nearly half of all U.S. manufacturing jobs lost or displaced between China’s entry into WTO and 2010.
Supplemental Table A: Jobs displaced due to trade deficits with China, 2001-10, by congressional district (ranked by share of jobs displaced) [PDF][Excel]
Supplemental Table B: Jobs displaced due to trade deficits with China, 2001-10, by congressional district (sorted by state and congressional district) [PDF][Excel]
Supplemental Table C: Imports, exports, and trade balance between the United States and China, 2001-10 [PDF][Excel]
The 2.8 million jobs lost or displaced in all sectors include 453,100 jobs lost or displaced from 2008 to 2010 alone—even though imports from China and the rest of world collapsed in 2009. (Imports from China have since recovered and surpassed their peak in 2008.) The growing trade deficit with China has cost jobs in every congressional district, including the District of Columbia and Puerto Rico.
The trade deficit in the computer and electronic parts industry grew the most, displacing 909,400 jobs—32.6% of all jobs displaced between 2001 and 2010. As a result, the hardest-hit congressional districts were in California, Texas, Oregon, and Massachusetts, where remaining jobs in those industries are concentrated. Some districts in North Carolina, Georgia, and Colorado were also especially hard hit by job displacement in a variety of manufacturing industries, including computers and electronic parts, textiles and apparel, and furniture.
But the jobs impact of the China trade deficit is not restricted to job loss and displacement. Competition with low-wage workers from less-developed countries such as China has driven down wages for workers in U.S. manufacturing and reduced the wages and bargaining power of similar, non-college educated workers throughout the economy. The affected population includes essentially all workers with less than a four-year college degree—roughly 70% of the workforce (Mishel, Bernstein, and Shierholz 2009), or about 100 million workers (Bureau of Labor Statistics 2011a).
Put another way, for a typical full-time median-wage earner in 2006, earnings losses due to globalization totaled approximately $1,400 (Bivens 2008). China is the most important source of downward wage pressure from trade with less-developed countries, because it pays very low wages and because its products make up such a large portion of U.S. imports (China was responsible for 54% of U.S. non-oil imports from less-developed countries in 2010).
These conclusions about the jobs impact of trade with China arise from the following specific findings of this study:
- Most of the jobs lost or displaced by trade with China between 2001 and 2010 were in manufacturing industries (1.93 million jobs, or 69.2%).
- Within manufacturing, rapidly growing imports of computer and electronic parts (including computers, parts, semiconductors, and audio-video equipment) accounted for more than 44% of the $194 billion increase in the U.S. trade deficit with China between 2001 and 2010. The growth of this deficit contributed to the elimination of 909,400 U.S. jobs in computer and electronic products in this period. Indeed, in 2010, the total U.S. trade deficit with China was $278.3 billion—$124.3 billion of which was in computer and electronic parts.
- Global trade in advanced technology products—often discussed as a source of comparative advantage for the United States—is instead dominated by China. This broad category of high-end technology products includes the more advanced elements of the computer and electronic parts industry as well as other sectors such as biotechnology, life sciences, aerospace, and nuclear technology. In 2010, the United States had a $94.2 billion deficit in advanced technology products with China, which was responsible for 34% of the total U.S.-China trade deficit. In contrast, the United States had a $13.3 billion surplus in ATP with the rest of the world in 2010.
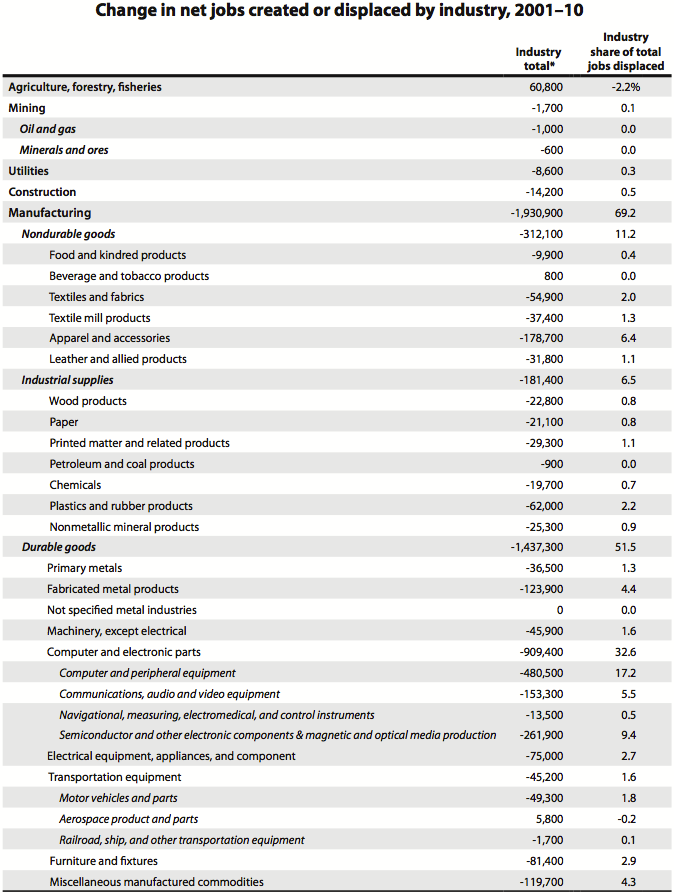
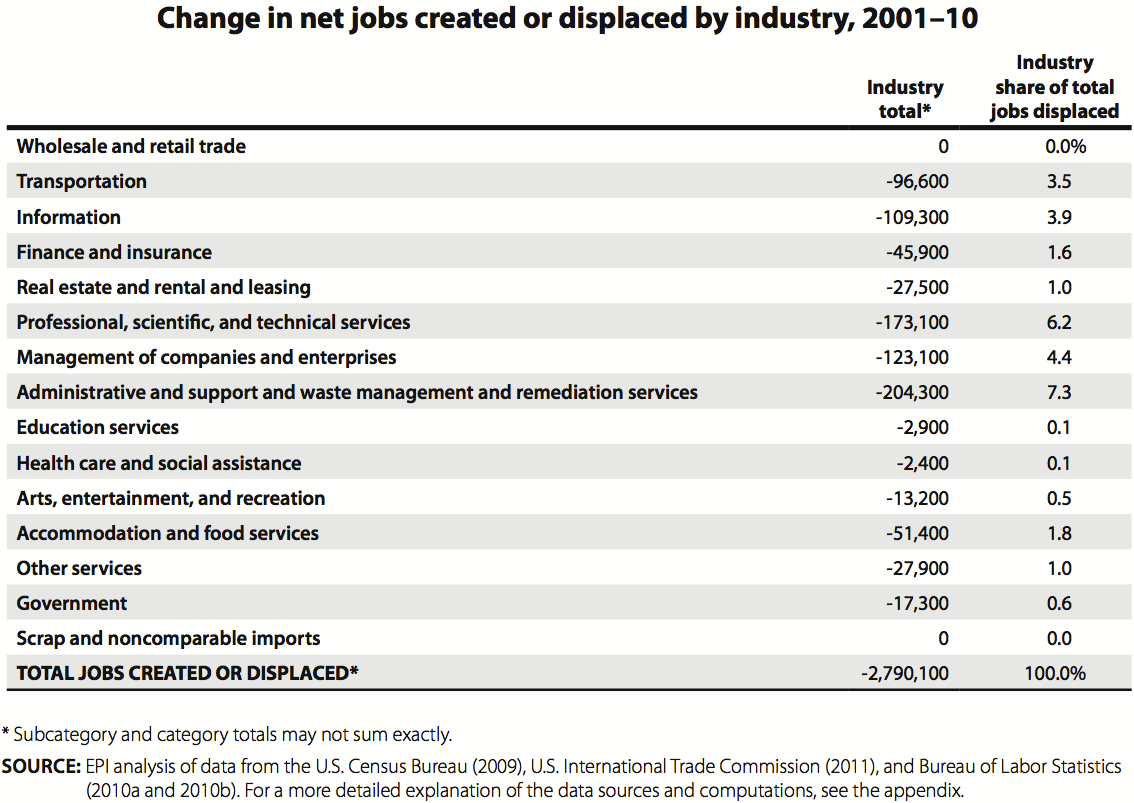
- Other industrial sectors hit hard by growing trade deficits with China between 2001 and 2010 include apparel and accessories (178,700 jobs), textile fabrics and products (92,300), fabricated metal products (123,900), plastic and rubber products (62,000), motor vehicles and parts (49,300), and miscellaneous manufactured goods (119,700). Several service sectors were also hit hard by indirect job losses including administrative, support, and waste management services (204,300) and professional, scientific, and technical services (173,100).
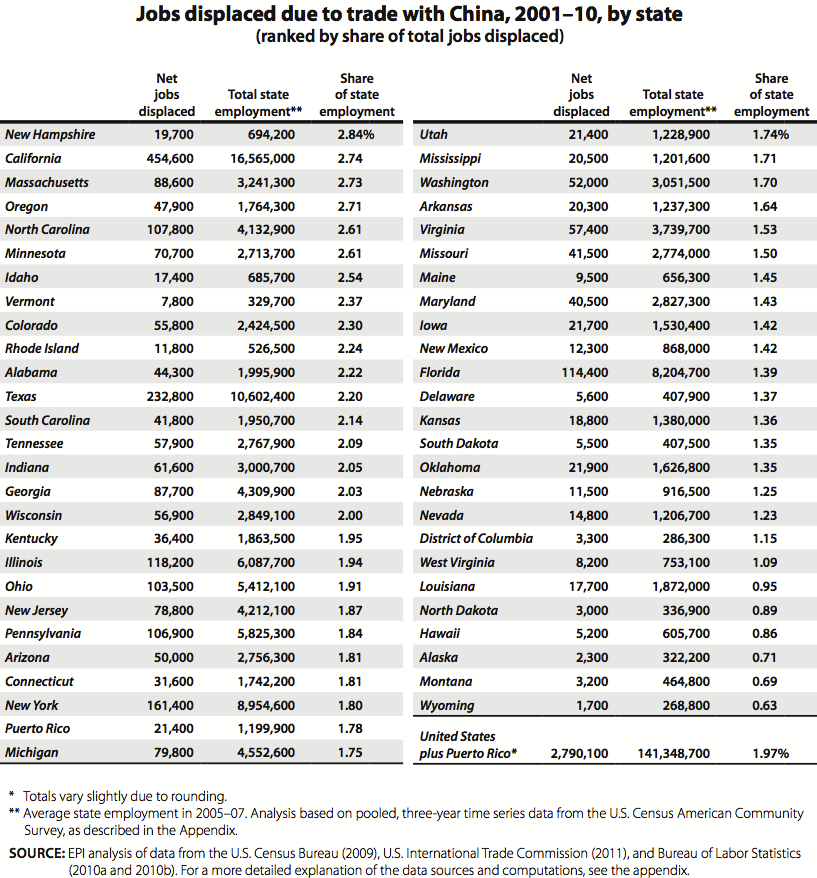
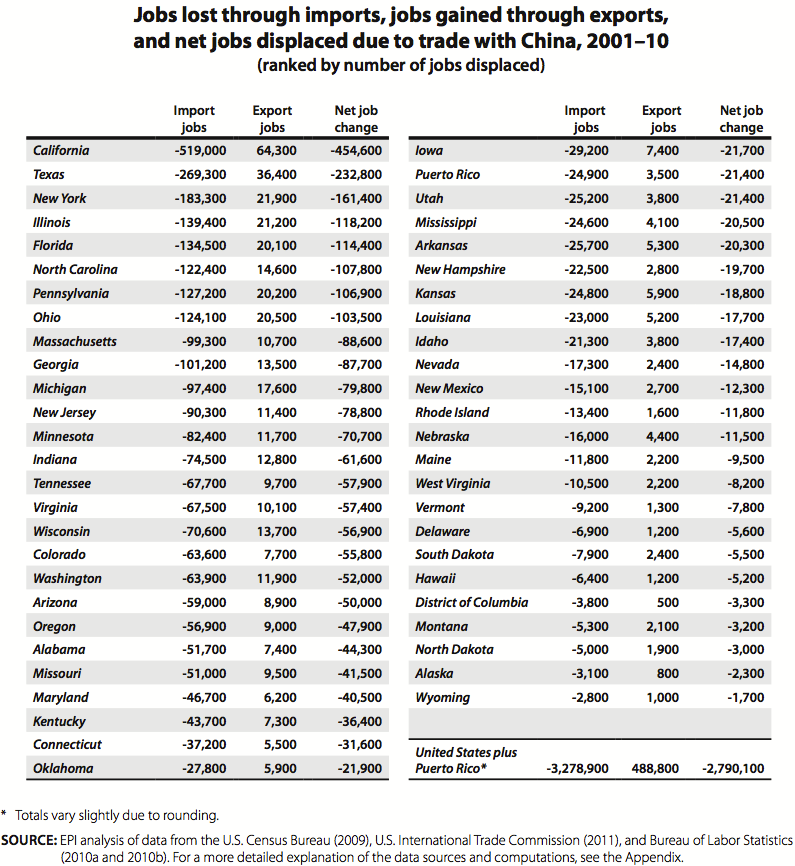
- The 2.8 million U.S. jobs lost or displaced by the trade deficit with China between 2001 and 2010 were distributed among all 50 states, the District of Columbia, and Puerto Rico, with the biggest net losses occurring in California (454,600 jobs), Texas (232,800), New York (161,400), Illinois (118,200), Florida (114,400), North Carolina (107,800), Pennsylvania (106,900), Ohio (103,500), Massachusetts (88,600), and Georgia (87,700).
- Jobs displaced due to growing deficits with China exceeded 2.2% of total employment in the 10 hardest-hit states (i.e., jobs lost or displaced as a share of total state employment): New Hampshire (19,700, 2.84%), California (454,600, 2.74%), Massachusetts (88,600, 2.73%), Oregon (47,900, 2.71%), North Carolina (107,800, 2.61%) Minnesota (70,700, 2.61%), Idaho (17,400, 2.54%), Vermont (7,800 2.37%), Colorado (55,800, 2.30%), and Rhode Island (11,800, 2.24%).
- The hardest-hit congressional districts were concentrated in states that were heavily exposed to growing China trade deficits in computer and electronic products and other industries such as furniture, textiles, apparel, and durable goods manufacturing. The three hardest-hit Congressional districts were all located in Silicon Valley in California, including the 15th (Santa Clara County, 39,669 jobs, 12.23% of all jobs in the district), the 14th (Palo Alto and nearby cities, 28,866 jobs, 9.0%), and the 16th (San Jose and other parts of Santa Clara County, 26,478 jobs, 8.72%). Of the top 20 hardest-hit districts, eight were in California (in rank order, the 15th, 14th, 16th, 13th, 31st, 34th, 50th, and 47th), four were in Texas (31st, 10th, 25th, and 3rd), three were in North Carolina (4th, 10th and 6th), two were in Massachusetts (5th and 3rd), and one each in Oregon (1st), Georgia (9th), and Colorado (4th). Each of these districts lost at least 9,500 jobs or 3.4% of its total jobs. One-fourth of the hardest-hit 20 districts (representing about 1% of the nation’s 435 congressional districts) lost at least 20,000 jobs apiece or 5.8% percent of their total jobs.
The job displacement estimates in this study are conservative. They include only the direct and indirect jobs displaced by trade, and exclude jobs in domestic wholesale and retail trade and advertising. The U.S. unemployment rate averaged 9.6 percent in 2010 (Bureau of Labor Statistics 2011b). During the Great Recession of 2007‒2009, and continuing through 2010, jobs displaced by China trade reduced wages and spending, which led to further job losses in the economy. This spillover effect certainly arose from the loss of 453,100 jobs due to growing trade deficits with China between 2008 and 2010.
Introduction: High expectations attended China’s entry into WTO
Today’s international trading system grew out of the Bretton Woods Agreements negotiated among Allied nations in July 1944, which established rules for financial relations among signatories and established the International Monetary Fund and the World Bank. A subsequent U.N. Conference on Trade and Employment produced the General Agreement on Tariffs and Trade (GATT) in 1947. The GATT treaty established the international trading system, which evolved as a series of global trade negotiations refined the rules of the system while progressively lowering tariffs and non-tariff barriers. The Uruguay Round, which lasted from September 1986 until December 1993, led to the 1994 creation of the World Trade Organization, an institutional body charged with settling disagreements among nations regarding the rules agreed upon in GATT.
The World Trade Organization was empowered with the ability to engage in dispute resolution and to authorize imposition of offsetting duties if its decisions were ignored or rejected by member governments. It expanded the trading system’s coverage to include a huge array of subjects never included in trade agreements before, such as food safety standards, environmental laws, social service policies, intellectual property standards, government procurement rules, and more (Wallach and Woodall 2011).
Over time, countries that were not part of the original GATT group have sought entry into the WTO to gain improved market access for their goods at lower tariff levels, and to encourage development of their traded goods industries.
Proponents of China’s entry into the WTO frequently claimed that it would create jobs in the United States, increase U.S. exports, and improve the trade deficit with China. In 2000, President Clinton claimed that the agreement then being negotiated to allow China into the WTO “creates a win-win result for both countries.” Exports to China “now support hundreds of thousands of American jobs,” and these figures “can grow substantially with the new access to the Chinese market the WTO agreement creates,” he said (Clinton 2000, 9-10).
China’s entry into the WTO was supposed to bring it into compliance with an enforceable, rules-based regime that would require China to open its markets to imports from the United States and other nations by reducing tariffs and addressing non-tariff barriers to trade. Promoters of liberalized U.S.-China trade argued that the United States would benefit because of increased exports to a large and growing consumer market in China. The United States also negotiated a series of special safeguard measures designed to limit the disruptive effects of surging imports from China on domestic producers.
However, as a result of China’s currency manipulation and other trade distorting practices, including extensive subsidies, legal and illegal barriers to imports, dumping and suppression of wages and labor rights, the envisioned flow of U.S. exports to China did not occur. Further, the agreement spurred foreign direct investment in Chinese enterprises, which has expanded China’s manufacturing sector at the expense of the United States. Finally, the core of the agreement failed to include any protections to maintain or improve labor or environmental standards.
In retrospect, the promises about jobs and exports misrepresented the real effects of trade on the U.S. economy: Trade both creates and displaces and destroys jobs. Increases in U.S. exports tend to create jobs in the United States, but increases in imports will lead to job loss—by destroying existing jobs and preventing new job creation—as imports displace goods that otherwise would have been made in the United States by domestic workers. This is what has occurred with China since it entered WTO. The United States’ widening trade deficit with China is costing U.S. jobs.
Currency manipulation is a major cause of the trade deficit
A major cause of the rapidly growing U.S. trade deficit with China is currency manipulation. Unlike other currencies, the Chinese yuan does not fluctuate freely against the dollar.1 Instead, China has tightly pegged its currency to the U.S. dollar at a rate that encourages a large bilateral surplus with the United States.
As China’s productivity has soared, its currency should have adapted, increasing in value to maintain balanced trade. But the yuan has instead remained artificially low as China has aggressively acquired dollars and other foreign exchange reserves to further depress the value of its own currency. (To depress the value of its own currency, a government sells its own currency, which increases its foreign reserves.) China had to purchase $450 billion in U.S. treasury bills and other securities between December 2009 and December 2010, alone, to maintain the peg to the U.S. dollar (International Monetary Fund 2011). China’s foreign exchange reserve purchases surged to an unprecedented $728.8 billion between June 30, 2010 and June 30, 2011. As of June 30, 2011, China held a total of $3.2 trillion in foreign exchange reserves (Oliver 2011), about 70% of which were held in U.S. dollars. This intervention makes the yuan artificially cheap relative to the dollar, effectively subsidizing Chinese exports. The best estimates place this effective subsidy at roughly 28.5% of the U.S. dollar, even after recent appreciation in the yuan (Cline and Williamson 2011). Currency intervention also artificially raises the cost of U.S. exports to China and the rest of the world by a similar amount, making U.S. goods less competitive in that country, and in every country where U.S. exports compete with Chinese goods. This is because China is the most important competitor for the United States in all other third country markets, even more important than Germany and all other members of the European Union combined.
China’s currency manipulation has compelled other countries to follow similar policies in order to protect their relative competitiveness and to promote their own exports. Widespread currency manipulation has also contributed to the growth of very large, global current account imbalances (a country’s current account balance is the broadest measure of its trade balance). Cline and Williamson (2011) call for rebalancing current global account flows in part through a substantial realignment of the dollar against currencies from China, Hong Kong, Malaysia, Taiwan, and Singapore that are undervalued relative to the dollar. To reduce the U.S. current account deficit to 3.0% of GDP in 2016 (from a projected 4.6% if currencies are not realigned), the yuan needs to rise 28.5% against the U.S. dollar, and currencies from the other four Asian countries listed need to rise by 27.5% to 38.5% against the dollar, Cline and Williamson estimate. They project that global currency realignment (a rise in value of the five Asian currencies discussed here as well as coordinated shifts in the values of other currencies) would result in an 8.5% fall in the trade-weighted value of the U.S. dollar across all currencies. Reducing the U.S. current account balance to a lower level, such as 1% of GDP, would require proportionately greater rebalancing of currencies, especially those of Asian countries.
A recent report showed that full revaluation of the yuan and other undervalued Asian currencies would improve the U.S. current account balance by up to $190.5 billion, increasing U.S. GDP by as much as $285.7 billion, adding up to 2.25 million U.S. jobs, and reducing the federal budget deficit by up to $857 billion over 10 years (Scott 2011a). This change to the current account balance would also help workers in China and other Asian countries by reducing inflationary overheating and increasing workers’ purchasing power.
It would also benefit other countries. The undervaluation of the yuan has put the burden of global current account realignment pressures on other countries such as Australia, New Zealand, South Africa, and Brazil, whose currencies have also become overvalued on a trade-weighted basis.
Other illegal laws, regulations and policies are also responsible for the large U.S. trade deficit with China
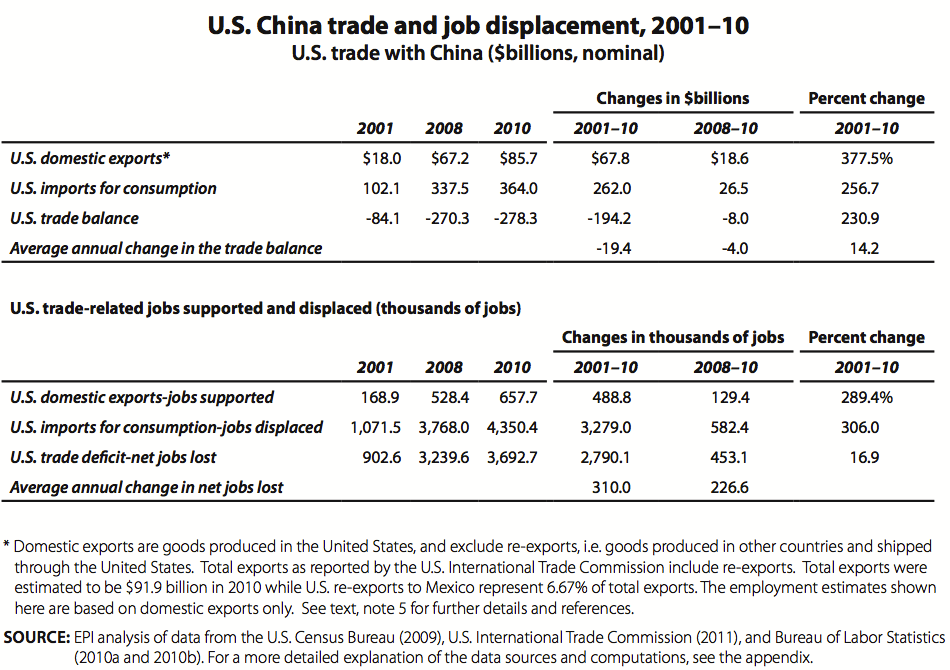
Currency manipulation is one example of a practice that violates the rules of the international trading system set out in the GATT and WTO agreements (Stewart and Drake 2010). Other Chinese government policies also illegally encourage exports. China extensively suppresses labor rights, which lowers production costs within China. An AFL-CIO study estimated that repression of labor rights by the Chinese government has lowered manufacturing wages of Chinese workers by 47% to 86% (AFL-CIO, Cardin, and Smith 2006, 138). China also provides massive direct export subsidies to many key industries (see, for example, Haley 2008, 2009). Finally, it maintains strict, non-tariff barriers to imports. As a result, China’s $364.05 billion of exports to the United States in 2010 were more than four times greater than U.S. exports to China, which totaled only $85.7 billion (Table 1), making the China trade relationship the United States’ most imbalanced by far.
Partly because the agreement accepting China into the WTO failed to include any protections to maintain or improve labor or environmental standards, China’s entry into the WTO has further tilted the international economic playing field against domestic workers and firms and in favor of multinational companies from the United States and other countries as well as state- and privately owned exporters in China. This shift has increased the global “race to the bottom” in wages and environmental quality and closed thousands of U.S. factories, decimating employment in a wide range of communities, states, and entire regions of the United States. U.S. national interests have suffered while U.S. multinationals have enjoyed record profits on their foreign direct investments (FDI) (Scott 2007, 2011b).
Some actions have recently been taken in response. In September 2009, the Obama administration announced that it would take action to restrict imports of Chinese tires for three years under the special safeguard measures, the first time since 2001 that these measures had been utilized.
In September 2010, the United Steelworkers (USW) filed a section 301 petition with the U.S. Trade Representative which accuses China of illegally stimulating and protecting producers of green technology exports, ranging from wind and solar energy products to advanced batteries and energy-efficient vehicles. Indeed, the U.S. trade deficit in clean energy products had more than doubled between 2008 and 2010, displacing more than 8,000 U.S. jobs in 2010 alone (Scott 2010a). The 2010 USW petition details more than 80 Chinese laws, regulations, and practices that violate international trade agreements and have hurt U.S. clean energy manufacturing and green technology industries.
Another crucial missing link: Foreign direct investment and outsourcing
Proponents of trade deals such as the agreement to endorse China’s admission to the World Trade Organization usually focus on the impacts of these deals on tariff and non-tariff barriers to trade.2 China agreed to make major tariff reductions as a condition of entry into the WTO. President Clinton and many others argued that since U.S. tariff barriers were already low, the agreement would have a much larger effect on U.S. exports to China than on U.S. imports.
But proponents failed to consider the effect of China’s entry on foreign direct investment (FDI) and outsourcing. FDI has played a key role in the growth of China’s manufacturing sector. China is the largest recipient of FDI of all developing countries (Xing 2010) and is the third largest recipient of FDI over the past three decades, trailing only the United States and the United Kingdom. Foreign-invested enterprises (both joint ventures and wholly owned subsidiaries) were responsible for 55% of China’s exports and 68% of its trade surplus in 2010 (Scott 2011b). Outsourcing —through foreign direct investment in factories that make goods for export to the United States—has played a key role in the shift of manufacturing production and jobs from the United States to China since it entered the WTO in 2001.
Failed expectations of a growing Chinese market for U.S. goods
Another critically important promise made by the promoters of liberalized U.S.-China trade was that the United States would benefit because of increased exports to a large and growing consumer market in China. However, despite widespread reports of the rapid growth of the Chinese middle class, this growth has not resulted in a significant increase in U.S. consumer exports to China. The most rapidly growing exports to China are bulk commodities such as grains, scrap, and chemicals; intermediate products such as semiconductors; and producer durables such as aircraft (see Supplemental Table C to this report found at www.epi.org). Furthermore, the increase in U.S. exports to China since 2001 has been overwhelmed by the growth of U.S. imports, as discussed next.
Trade-distorting policies and unplanned for investment shifts have combined to radically increase China’s share of the U.S. trade deficit
The bottom line of the influences discussed above is: As a result of China’s currency manipulation and other trade distorting practices (including extensive subsidies, legal and illegal barriers to imports, dumping and suppression of wages and labor rights), the increase in foreign direct investment in China and related growth of its manufacturing sector, and the absence of a growing market for U.S. consumer goods in China, the U.S. trade deficit with China rose from $84 billion in 2001 to $278 billion in 2010, an increase of $194 billion, as shown in Table 1. Since China entered the WTO in 2001, this deficit has increased by $19.4 billion per year, on average, or14.2% per year. These figures reflect how China’s share of the U.S. trade deficit has soared.
Despite the collapse in world trade caused by the great recession of 2008-09, the U.S. trade deficit with China increased $8.0 billion between 2008 and 2010. In the same period, the overall U.S. trade deficit declined by $165.4 billion (20.6%), increasing China’s share of the overall U.S. trade deficit from 33.8% to 43.9%. China’s share of the total, U.S. non-oil trade deficit jumped from 69.6% in 2008 to 78.3% in 2010 (U.S. International Trade Commission 2011 and author’s calculations).
Unless China raises the real value of the yuan by at least 28.5% and eliminates these other trade distortions, the U.S. trade deficit and related job losses will continue to grow rapidly. (Although China did respond to international pressure in the late 2000s and allow some appreciation in the yuan, it was too little and too late to help arrest the widening U.S.-China trade gap.3)
Growing trade deficits and job losses
Each $1 billion in exports to China from the United States supports American jobs. However, each $1 billion in imports from China displaces the American workers who would have been employed making these products in the United States. On balance, the net employment effect of trade depends on the changes in the trade balance. An improving trade balance can support job creation, but growing trade deficits usually result in growing net U.S. job displacement. The United States has had large trade deficits with China since 2001, which increased in every year except 2009, when U.S. trade with all countries collapsed due to the recession of 2007-2009.
The employment impacts of the growing U.S. trade deficit with China are estimated in this paper using an input-output model that estimates the direct and indirect labor requirements of producing output in a given domestic industry. The model includes 202 U.S. industries, 84 of which are in the manufacturing sector (see data appendix, below, for details on model structure and data sources).
The model estimates the amount of labor (number of jobs) required to produce a given volume of exports and the labor displaced when a given volume of imports is substituted for domestic output.4 The difference between these two numbers is essentially the jobs displaced by growing trade deficits, holding all else equal.
Jobs displaced by the growing China trade deficit are a net drain on employment in trade-related industries, especially those in manufacturing. Even if increases in demand in other sectors absorb all the workers displaced by trade (an unlikely event), job quality will likely suffer because many non-traded industries such as retail trade and home health care pay lower wages and have less comprehensive benefits than traded-goods industries.
U.S. exports to China in 2001 supported 168,900 jobs, but U.S. imports displaced production that would have supported 1,071,500 jobs, as shown in the bottom half of Table 1. Therefore, the $84 billion trade deficit in 2001 displaced 902,600 jobs in that year. Job displacement rose to 3,239,600 jobs in 2008 and 3,692,700 jobs in 2010.
Since China’s entry into the WTO in 2001 and through 2010, the increase in U.S.-China trade deficits eliminated or displaced 2,790,100 U.S. jobs, as shown in the bottom half of Table 1. Between 2008 and 2010 alone 453,100 jobs were lost, either by the elimination of existing jobs or by the prevention of new job creation. On average, 310,000 jobs per year have been lost or displaced since China’s entry into the WTO. The continuing growth in job displacement between 2008 and 2010 despite the relatively small increase in the trade deficit reflects the relatively rapid growth of U.S. imports of computer and electronics products from China, and the fact that the price index for most of these products fell continuously throughout the study period, as noted below. The share of computer and electronic parts in U.S. imports from China (in current, nominal dollars) increased from 32.9% in 2008 to 37.3% in 2010 alone.
Trade and jobs, by industry
The composition of imports from China is changing in fundamental ways, with serious implications for certain kinds of high-skill, high-wage jobs once thought to be the hallmark of the U.S. economy. China is moving rapidly “upscale,” from low-tech, low-skilled, labor-intensive industries such as apparel, footwear, and basic electronics to more capital- and skills-intensive sectors such as computers, electrical machinery, and motor vehicles; it has also developed a rapidly growing trade surplus in high-technology products.
From 2001 to 2010, imports from China increased dramatically, rising from $102 billion in 2001 to $364.0 billion in 2010.5 (Supplemental Table C found at www.epi.org shows the shift in trade flows by sector). In fact, rapidly growing imports of computer and electronic parts (including computers, parts, semiconductors, and audio-video equipment) accounted for more than 44% of the $194 billion increase in the U.S. trade deficit with China between 2001 and 2010. In 2010, the total U.S. trade deficit with China was $278.3 billion—$124.3 billion of which was in computer and electronic parts.
Table 2 provides a snapshot of the current trade balance by sector, broken down by exports and imports. Manufactured goods were 99.1% of total imports in 2010, and included a wide array of commodities. Computer and electronic parts were responsible for 37.3% of total imports in 2010, including computer equipment ($60.1 billion, or 16.5%) and communications, audio, and video equipment ($52.9 billion, 14.5%). Other major importing sectors included apparel ($30.9 billion, 8.5%) and miscellaneous manufactured commodities ($42.1 billion, 11.6%).
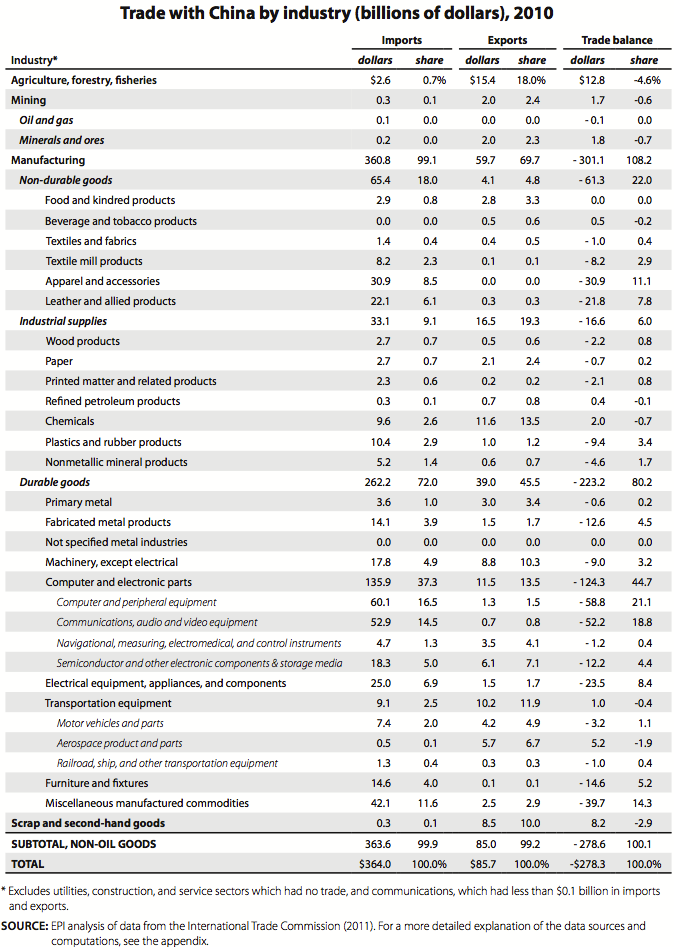
U.S. exports rose rapidly from 2001 to 2010, but from a much smaller base, from $18 billion in 2001 to $85.7 billion in 2010. As Table 2 shows, manufacturing was the top industry exporting to China—70% of exports to China in 2010 were manufactured goods, totaling $59.7 billion. Scrap and second-hand goods industries (which support no jobs, according to Bureau of Labor Statistics models) made up 10% ($8.5 billion) of the total. Within manufacturing, key export sectors included chemicals ($11.6 billion, or 13.5% of total exports), aerospace products and parts ($5.7 billion, 6.7%), machinery ($8.8 billion, 10.3%), and semiconductors and components ($6.1 billion, 7.1%). However, the scale of U.S. exports is dwarfed by imports, which exceeded the value of exports by more than 4 to 1.
The data reflect China’s rapid expansion into higher value-added commodities once considered the strength of the United States, such as computer and electronic parts, which accounted for 37.3% of U.S. imports from China in 2010. This growth is apparent in the shifting trade balance in advanced technology products (ATP), a broad category of high-end technology goods trade tracked by the U.S. Census Bureau.6 ATP includes the more advanced elements of the computer and electronic parts industry as well as other sectors such as biotechnology, life sciences, aerospace, nuclear technology, and flexible manufacturing. The ATP sector includes some auto parts; China is now one of the top suppliers of auto parts to the United States, having recently surpassed Germany (U.S. International Trade Commission 2011).
In 2010, the United States had a $94.2 billion trade deficit with China in ATP, reflecting an eight-fold increase from $11.8 billion in 2002. This ATP deficit was responsible for 34% of the total U.S.-China trade deficit in 2010. It dwarfs the $13.3 billion surplus in ATP that the United States had with the rest of the world in 2010, the result of a 7.1% annual increase in U.S. ATP exports with the rest of the world between 2002 and 2010. As a result of the U.S. ATP deficit with China, the United States ran an overall deficit in ATP products in 2010 (of $80.9 billion), as it has in every year since 2002.
Trade deficits are highly correlated with job loss or displacement by industry, as shown in Table 3. Growing trade deficits with China eliminated 1,930,900 manufacturing jobs between 2001 and 2010, more than two-thirds (69.2%) of the total. By far the largest job displacements occurred in the computer and electronic parts sectors, which lost 909,400 jobs (32.6% of the 2.8 million jobs displaced overall). This sector included computer and peripheral equipment (480,500 jobs, 17.2%) and semiconductors and components (261,900 jobs, 9.4%). Other hard-hit sectors included apparel and accessories (178,700 jobs displaced, 6.4%), textile fabrics and products (92,300, 3.3%), fabricated metal products (123,900, 4.4%), plastic and rubber products (62,000, 2.2%), motor vehicles and parts (49,300, 1.8%), and miscellaneous manufacturing (119,700 jobs, 4.3%). Several service industries, which provide key inputs to traded-goods production, experienced large job displacement, including administrative, support, and waste management services (204,300 jobs, 7.3%) and professional, scientific, and technical services (173,100 jobs, 6.2%).
These job displacement estimates are based on changes in the real value of exports and imports. For example, while the share of computer and electronic parts in U.S. imports from China rose from 23.8% in 2001 to 37.3% in 2010 (to $135.9 billion) the average price indexes (deflators) for most of these products fell sharply between 2001 and 2010—37.6% on a trade-weighted basis. Thus, the real value of computer and electronic imports increased more than 10-fold in this period, rising from $24.6 billion to $257.7 billion in 2010 in constant 2000 dollars.
Job losses by state
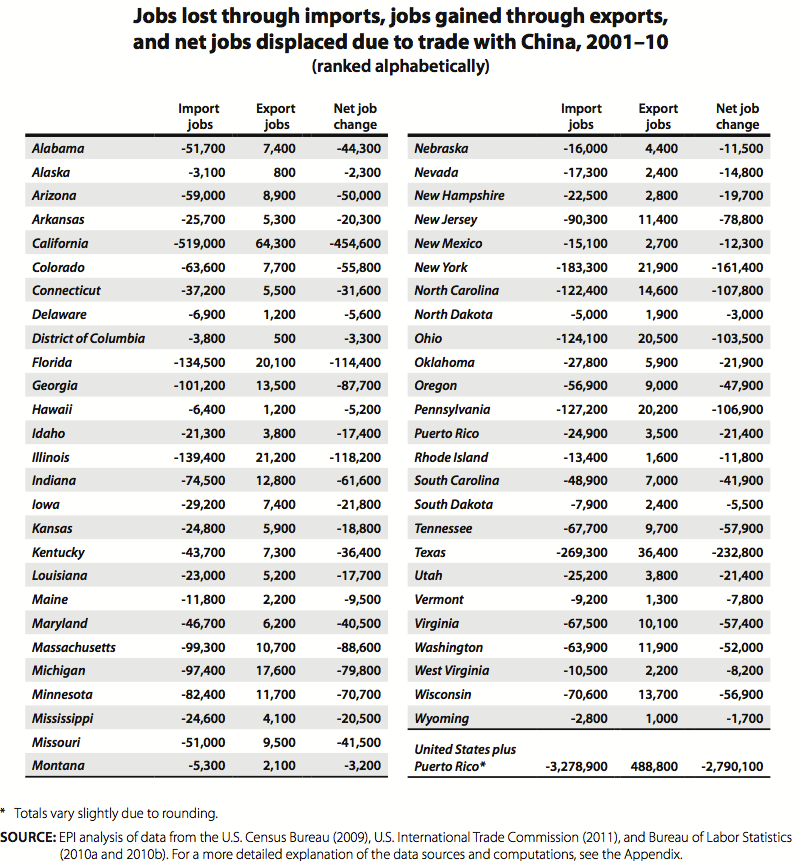
Growing trade deficits with China have reduced demand for goods produced in every region of the United States and led to job displacement in all 50 states and the District of Columbia, as shown in Table 4A and Figure A. Jobs displaced due to growing deficits with China exceeded 2.2% of total employment in states such as New Hampshire, California, Massachusetts, Oregon, North Carolina, Minnesota, Idaho, Vermont, Colorado, and Rhode Island. More than 450,000 jobs were lost in California, more than 230,000 in Texas, and more than 110,000 each in New York, Illinois, and Florida, as shown in the list of state job losses ranked by number of jobs displaced in Table 4B. An alphabetical list of job losses by state is shown in Table 4C. Growing trade deficits with China displaced 2.8 million jobs in the United States and Puerto Rico between 2001 and 2010, about 2.0% of total U.S. employment, as shown in Table 4A.
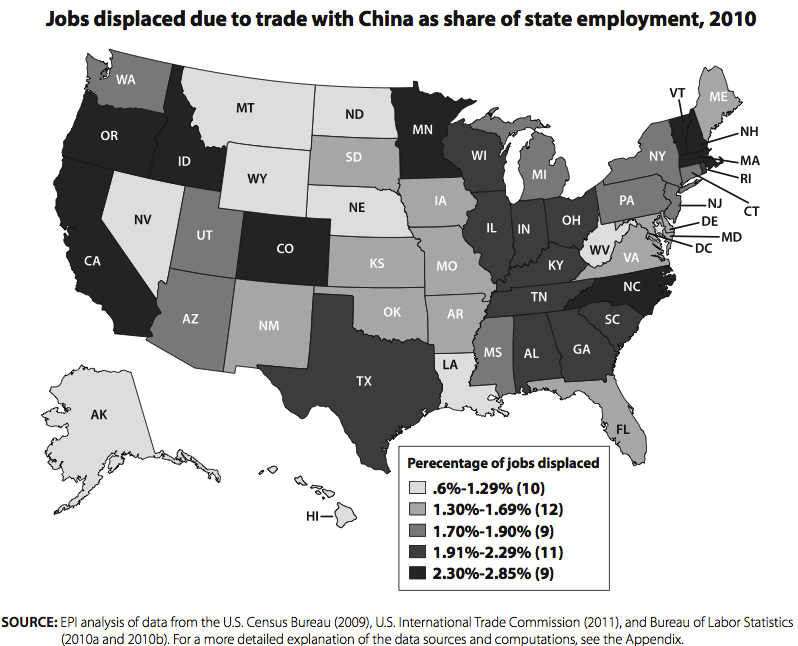
Figure A shows the broad impact of growing trade deficits with China across the United States, with no areas exempt. Job losses have been most concentrated in states with high-tech industries, such as California, Massachusetts, Oregon, Idaho, and Colorado, and in manufacturing states, including New Hampshire, North Carolina, and Vermont. Other hard-hit states include traditional manufacturing powers such as Wisconsin, Tennessee, Indiana, Illinois, Ohio, Kentucky, Alabama, Texas, and South Carolina.
Growing trade deficits with China have clearly reduced domestic employment in traded goods industries, especially in the manufacturing sector, which has been pummeled by plant closings and job losses. Workers displaced by trade from the manufacturing sector have had particular difficulty securing comparable employment elsewhere in the economy. More than one-third of workers displaced from manufacturing dropped out of the labor force (Kletzer 2001, 101, Table D2), and average wages of those who found new jobs fell 11% to 13%.
Some economists have argued that job loss numbers extrapolated from trade flows are uninformative because aggregate employment levels in the United States are set by a broad range of macroeconomic influences, not just by trade flows. However, while the trade balance is but one of many variables affecting aggregate job creation, it plays a much larger role in explaining structural change in employment, especially in the manufacturing sector. Between December 2001 and December 2010, 4.1 million U.S. manufacturing jobs were lost (Bureau of Labor Statistics 2011c). The growth of U.S. trade deficits with China was responsible for the displacement of 1.9 million manufacturing jobs in this period, or 47.1% of manufacturing jobs lost.7 The employment impacts of trade identified in this paper can be interpreted as the “all else equal” effect of trade on domestic employment. The Federal Reserve, for example, may decide to cut interest rates to make up for job losses stemming from deteriorating trade balances (or any other economic influence), leaving net employment unchanged. This, however, does not change the fact that trade deficits by themselves are a net drain on employment.
Many of the mechanisms that could offset employment losses caused by growing trade deficits are not operating in the current downturn. The Federal Reserve cannot cut interest rates any lower than it already has, and interest-sensitive industries such as residential construction are not experiencing employment gains from lower rates. In short, in today’s economy with its high unemployment rate, jobs displaced due to trade deficits with China are much more likely to be actual net, economy-wide losses than simply job reallocations.
Job losses by congressional district
This study also reports the employment impacts of growing trade deficits in every congressional district, including the District of Columbia and Puerto Rico. (Data for 437 districts total are shown in Supplemental Tables A and B posted online along with this report at www.epi.org) Because the computer and electronic parts industry experienced the largest growth in trade deficits with China, the hardest-hit congressional districts were located in California and Texas, where remaining jobs in that industry are concentrated, and in North Carolina, which suffered considerable job displacement in a variety of manufacturing industries.
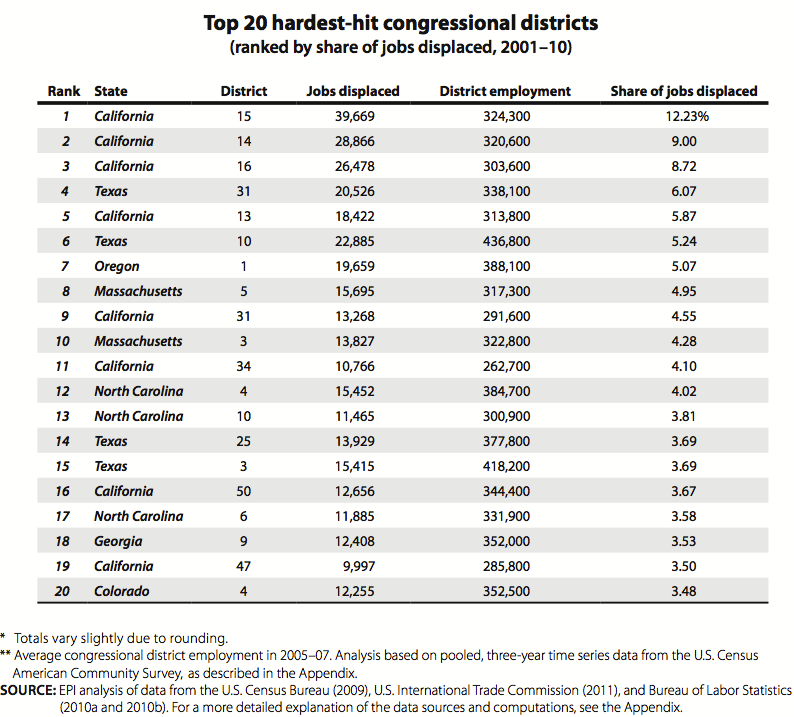
The top 20 hardest-hit congressional districts are shown in Table 5. Of the top 20 hardest-hit districts, eight were in California (in rank order, the 15th, 14th, 16th, 13th, 31st, 34th, 50th, and 47th), four were in Texas (31st, 10th, 25th, and 3rd), three were in North Carolina (4th, 10th and 6th), two were in Massachusetts (5th and 3rd), and one each in Oregon (1st), Georgia (9th), and Colorado (4th). Each of these districts lost at least 9,500 jobs or 3.4% of its total jobs. These distributions reflect both the size of some states (e.g., California and Texas) and also the concentration of the industries hardest hit by growing China trade deficits in computer and electronic products and other industries such as furniture, textiles, apparel, and durable goods manufacturing.
The three hardest-hit Congressional districts were all located in Silicon Valley in California, including the 15th (Santa Clara County, 39,669 jobs, 12.23% of all jobs in the district), the 14th (Palo Alto and nearby cities, 28,866 jobs, 9.0%), and the 16th (San Jose and other parts of Santa Clara County, 26,478 jobs, 8.72%). One-fourth of the hardest-hit 20 districts (representing about 1% of the nation’s 435 congressional districts) lost at least 20,000 jobs apiece or 5.8% of their total jobs).
Conclusion
The growing U.S. trade deficit with China has displaced millions of jobs in the United States and contributed heavily to the crisis in U.S. manufacturing employment, which has heightened over the last decade largely due to trade with China. Moreover, the United States is piling up foreign debt, losing export capacity, and facing a more fragile macroeconomic environment.
Is America’s loss China’s gain? The answer is not clearly affirmative. China has become dependent on the U.S. consumer market for employment generation, suppressed the purchasing power of its own middle class with a weak currency, and, most important, now holds over $3 trillion in hard currency reserves instead of investing them in public goods that could benefit Chinese households. Its vast purchases of foreign exchange reserves have stimulated the overheating of its domestic economy, and inflation in China has accelerated rapidly in the past year. Its repression of labor rights has suppressed wages, thereby artificially subsidizing exports.
The U.S-China trade relationship needs a fundamental change. Addressing the exchange rate policies and labor standards issues in the Chinese economy are important first steps.
—The author thanks Josh Bivens and Ross Eisenbrey for comments, Lora Engdahl for editing, and Nicholas Finio and Hilary Wething for research assistance.
—This research was made possible by support from the Alliance for American Manufacturing.
Appendix
Methodology
The trade and employment analyses in this report are based on a detailed, industry-based study of the relationships between changes in trade flows and employment for each of approximately 202 individual industries of the U.S. economy, specially grouped into 56 custom sectors and using North American Industry Classification System (NAICS) with data obtained from the U.S. International Trade Commission (USITC).
This study separates exports produced domestically from foreign exports—which are goods produced in other countries, exported to the United States, and then re-exported from the United States. Because only domestically produced exports generate jobs in the United States, employment calculations here are based only on domestic exports. The measure of the net impact of trade used here to calculate the employment content of trade is the difference between domestic exports and consumption imports.
The number of jobs supported by $1 million of exports or imports for each of 202 different U.S. industries is estimated using a labor requirements model derived from an input-output table developed by the U.S. Bureau of Labor Statistics (2010a).8 This model includes both the direct effects of changes in output (for example, the number of jobs supported by $1 million in auto assembly) and the indirect effects on industries that supply goods used in the manufacture of cars. The indirect impacts include jobs in auto parts, steel, and rubber, as well as service industries such as accounting, finance, and computer programming. This model estimates the labor content of trade using empirical estimates of labor content and trade flows between U.S. industries in a given base year (an input-output table for the year 2001 was used in this study) that were developed by the U.S. Department of Commerce and the Bureau of Labor Statistics. It is not a statistical survey of actual jobs gained or lost in individual companies, or the opening or closing of particular production facilities (Bronfenbrenner and Luce 2004 is one of the few studies based on news reports of individual plant closings).
Nominal trade data used in this analysis were converted to constant 2000 dollars using industry-specific deflators (see next section for further details). This was necessary because the labor requirements table was estimated using price levels in that year. Data on real trade flows were converted to constant 2000 dollars using industry-specific price deflators from the Bureau of Labor Statistics (2010b). These price deflators were updated using Bureau of Labor Statistics Producer Price Indexes (industry and commodity data; Bureau of Labor Statistics 2011d). Use of constant 2000 dollars was required for consistency with the other BLS models used in this study.
Estimation and data sources
Data requirements
Step 1. U.S.-China trade data were obtained from the U.S. International Trade Commission DataWeb (U.S. International Trade Commission 2011) in four-digit, three-digit, and two-digit NAICS format. Consumption imports and domestic exports are downloaded for each year.
Step 2. To conform to the BLS Employment Requirements tables (Bureau of Labor Statistics 2010a), trade data must be converted into the BLS industry classifications system. For NAICS-based data, there are 202 BLS industries. The data are then mapped from NAICS industries onto their respective BLS sectors.
The trade data, which are in current dollars, are deflated into real 2000 dollars using published price deflators from the Bureau of Labor Statistics (2010b, 2011d).
Step 3. Real domestic employment requirements tables are downloaded from the BLS (2010a). These matrices are input-output industry-by-industry tables that show the employment requirements for $1,000,000 in outputs in 2000 dollars. So, for the i-the industry, the aij entry is the employment indirectly supported in industry i by final sales in industry j and where i=j, the employment directly supported.
Analysis
Step 1. Job equivalents
BLS trade data is compiled into matrices. Let [T2001] be the 202×2 matrix made up of a column of imports and a column of exports for 2001. [T2010] is defined as the 202×2 matrix of 2010 trade data. Finally, [T2008] is defined as the 202×2 matrix of 2008 trade data. Define [E2001] as the 202×202 matrix consisting of the real 2001 domestic employment requirements tables. To estimate the jobs displaced by trade, perform the following matrix operations.
[J2001]=[T2001]×[E2001]
[J2008]=[T2008]×[E2001]
[J2010]=[T2010]×[E2001]
[J2001] is a 202×2 matrix of job displacement by imports and jobs supported by exports for each of 202 industries in 2001. Similarly, [J2008] and [J2010] are 202×2 matrices of job displaced or supported by imports and exports (respectively) for each of 202 industries in 2008 and 2010, respectively.
The employment estimates for retail trade, wholesale trade, and advertising were set to zero for this analysis. We assume that goods must be sold and advertised whether they are produced in the United States or imported for consumption.
To estimate jobs created/lost over certain time periods, we perform the following operations:
[Jnx01-10]=[J2010]-[J2001]
[Jnx01-08]=[J2008]-[J2001]
[Jnx08-10]=[J2010]-[J2008]
Step 2. State-by-state analysis
For states, employment-by-industry data was obtained from Census Bureau’s American Community Survey (U.S. Census Bureau 2009) data for the 2005-07 period and was mapped into 56 census industries.9 We look at job displacement from 2001 to 2010, so from this point, we use [Jnx01-10]. In order to work with 56 sectors, we group the 202 BLS industries into a new matrix, defined as [Jnew01-10], a 56×2 matrix of job displacement numbers. Define [St05-07] as the 56×52 matrix of state employment shares (with the addition of the District of Columbia and Puerto Rico) of employment in each industry. Calculate:
[Stjnx01-10]=[St05-07]T [Jnew01-10]
Where [Stjnx01-10] is the 56×52 matrix of job displacement/support by state by industry. To get state total job displacement, we add up the subsectors in each state.
Step 3. Congressional district analysis
Employment by congressional district, by industry, by state is obtained from the ACS data from 2005-2007. In order to calculate job displacement in each congressional district, we use each column in [Stjnx01-10] which represent individual state job-displacement-by-industry estimates, and define them as [Stj01], [Stj02], [Stji]…[Stj52], with i representing the state number and each matrix being 56×1.
Each state has Y congressional districts, so [Cdi] is defined as the 56xY matrix of congressional district employment shares for each state. Congressional district shares are calculated thus:
[Cdj01]=[Stj01]T [Cd01]
[Cdji]=[Stji]T [Cdi]
[Cdj52]=[Stj52]T Cd52]
Where [Cdji] is defined as the 56xY job displacement in state i by congressional district by industry.
Congressional districts are estimated for the 110th Congress, which met from January 2007 through January 3, 2009 (including a lame duck session) (Beth and Soltis 2009).
To get total job displacement by congressional district, we add up the subsectors in each congressional district in each state.
Endnotes
- The official name of the Chinese currency is the Renminbi (RMB) and the units of value are yuan, the term used to describe the currency throughout this paper.
- China’s admission to the WTO was endorsed by the United States in domestic legislation that offered China permanent normal trade relations status.
- Beginning in 2002, the dollar declined more than 30% against several major currencies such as the Euro and the Canadian dollar. However, yuan appreciation was largely delayed until late 2007 and 2008—too little and too late to be of any help in slowing the current U.S.-China trade gap to date. (It usually takes 18 to 24 months for the full effects of a currency revaluation to take effect.) Furthermore, the appreciation of the yuan has had little effect on the prices of U.S. imports from China, which rose only 2.5% between July 2005 (when the yuan was first adjusted) and May 2008, much less than the 19% appreciation of the yuan in that period (Congressional Budget Office 2008, 2).
- The analysis in this report is based on domestic exports, as shown in Table 1, and excludes re-exports—which are goods produced in other countries, imported into the United States, and then re-exported to China. Since re-exports are not produced domestically, their production does not support domestic employment and they are excluded from the model used here.
- Tables 1 and 2 report U.S. imports for consumption and domestic exports to China. These flows were chosen to emphasize goods produced and consumed in the United States. News reports from the Census Bureau and Commerce Department usually emphasize general imports and total exports. Total exports as reported by the Census Bureau include re-exports, i.e., goods produced in other countries and shipped through the United States. For 2010, general imports from China were $336.9 billion, total exports were $91.9 billion, and the reported trade balance was -$273.1 billion (U.S. International Trade Commission 2011).
- ATPs are an amalgamation of products from a variety of industries and sub-sectors within the broad NAICS-based categories shown in Table 2.
- An additional 1.4 million manufacturing jobs were lost or displaced between January and December 2001, prior to China’s entry into the WTO. Thus a total of 5.6 million manufacturing jobs were lost between 2001 and 2010. Fewer than 300,000 jobs were recovered from the depths of the downturn in manufacturing employment, in February 2010 and July 2011. Thus structural factors were likely responsible for the bulk of manufacturing job loss between 2001 and 2010. See Autor, Dorn and Hanson (2011), for additional research on the impact of China trade on U.S. manufacturing employment and wages.
- The model includes 202 industries. The trade data includes only goods trade. Goods trade data is available for 91 commodity-based industries, plus software, waste and scrap, used or second-hand merchandise and goods traded under special classification provisions (e.g. goods imported from and returned to Canada; small, unclassified shipments). Trade in scrap, used and second-hand goods have no impacts on employment in the BLS model. Some special classification provision goods are assigned to miscellaneous manufacturing.
- The Census Bureau uses its own table of definitions of industries. These are similar to NAICS-based industry definitions, but at a somewhat higher level of aggregation. For this study, we developed a crosswalk from NAICS to Census industries, and using population estimates from the ACS for each cell in this matrix.
References
AFL-CIO, Benjamin L. Cardin, and Christopher H. Smith. 2006. “Section 301 Petition [on China’s repression of workers’ rights].” June 8.
Autor, David H., David Dorn, and Gordon H. Hanson. 2011. “The China Syndrome: Local Labor Market Effects of Import Competition in the United States.” Manuscript. June 22. http://econ-www.mit.edu/files/6613
Beth, Richard S. and Momoko Soltis. 2009. “Lame Duck Sessions of Congress, 1935-2008 (74th – 110th Congresses).” Washington, D.C.: Congressional Research Service. RL33677. http://www.senate.gov/reference/resources/pdf/RL33677.pdf
Bivens, L. Josh. 2008. Everybody Wins, Except for Most of Us: What Economics Teaches About Globalization. Washington, D.C.: Economic Policy Institute.
Bronfenbrenner, Kate, and Stephanie Luce. 2004. The Changing Nature of Corporate Global Restructuring: The Impact of Production Shifts on Jobs in the U.S., China, and Around the Globe. Commissioned research paper for the U.S. Trade Deficit Review Commission. http://www.uscc.gov/researchpapers/2004/cornell_u_mass_report.pdf.
Bureau of Labor Statistics, Office of Employment Projections. 2010a. “Special Purpose Files—Employment Requirements.” Washington, D.C.: U.S. Department of Labor. http://stats.bls.gov/emp/empind4.htm.
Bureau of Labor Statistics, Office of Employment Projections. 2010b. “Special Purpose Files—Industry Output and Employment.” Washington, D.C.: U.S. Department of Labor. http://www.bls.gov/emp/empind2.htm.
Bureau of Labor Statistics. 2011a. “Labor Force Statistics from the Current Population Survey–Civilian Labor Force Level.” Washington, D.C.: U.S. Department of Labor. http://data.bls.gov/cgi-bin/surveymost?ln
Bureau of Labor Statistics. 2011b. “Labor Force Statistics from the Current Population Survey–Employment Status–Employment status of the civilian noninstitutional population, 1940 to date.” Washington, D.C.: U.S. Department of Labor. ftp://ftp.bls.gov/pub/special.requests/lf/aat1.txt
Bureau of Labor Statistics. 2011c. “Employment, Hours, and Earnings from the Current Employment Statistics survey (National): Manufacturing Employment.” Washington, D.C.: U.S. Department of Labor. http://data.bls.gov/cgi-bin/surveymost?ce
Bureau of Labor Statistics. 2011d. “Producer Price Indexes: Industry and Commodity data.” http://stats.bls.gov/ppi/
Cline, William R., and John Williamson. 2011. Estimates of Fundamental Equilibrium Exchange Rates, May 2011. Peterson Institute for International Economics Policy Brief 11-5. Washington, D.C.: Peterson Institute for International Economics. Policy Brief 11-5. http://www.iie.com/publications/interstitial.cfm?ResearchID=1841
Clinton, Bill. 2000. “Expanding trade, protecting values: Why I’ll fight to make China’s trade status permanent.” New Democrat, Vol. 12, No. 1, pp. 9-11.
Congressional Budget Office. 2008. How Changes in the Value of the Chinese Currency Affect U.S. Imports. Washington, D.C.: Congress of the United States, Congressional Budget Office.
Haley, Usha C.V. 2008. Shedding Light on Energy Subsidies in China: An Analysis of China’s Steel Industry from 2000-2007. Washington, D.C.: Alliance for American Manufacturing. http://www.americanmanufacturing.org/wordpress/wp-content/uploads/2008/01/energy-subsidies-in-china-jan-8-08.pdf
Haley, Usha C.V. 2009. Through China’s Looking Glass—Subsidies to the Chinese Glass Industry from 2004-08. Economic Policy Institute Briefing Paper #242. Washington, D.C.: EPI. http://www.epi.org/publications/entry/bp242/
International Monetary Fund. 2011. International Financial Statistics CD ROM. Washington, D.C.: IMF.
Kletzer, Lori G. 2001. Job Loss from Imports: Measuring the Costs. Washington, D.C.: Institute for International Economics.
Mishel, Larry, Jared Bernstein, and Heidi Shierholz. 2009. The State of Working America 2008/2009. An Economic Policy Institute book. Ithaca, N.Y.: ILR Press, an imprint of Cornell University Press, p. 163.
Oliver, Chris. 2011. “China forex reserves hit $3.2 trillion: PBOC.” MarketWatch, The Wall Street Journal Digital Network. July 12. http://www.marketwatch.com/story/china-forex-reserves-hit-32-trillion-pboc-2011-07-12.
Scott, Robert E. 2007. The Hidden Costs of Insourcing: Higher Trade Deficits and Job Losses for U.S. Workers. Economic Policy Institute, Issue Brief #236. Washington, D.C.: EPI.
Scott, Robert E. 2010a. “China’s Subsidies to Green Industries Lead to Growing Trade Deficits in Clean Energy Products.” Economic Policy Institute commentary, October 18. Washington, D.C.: EPI. http://www.epi.org/publications/entry/ib287/
Scott, Robert E. 2010b. Unfair China Trade Costs Local Jobs: 2.4 million Jobs Lost, Thousands Displaced in Every Congressional District. Economic Policy Institute, Briefing Paper #260. Washington, D.C.: EPI. http://www.epi.org/publications/entry/bp260/
Scott, Robert E. 2011. The Benefits of Revaluation: Full revaluation of the Chinese yuan would increase U.S. GDP and employment, reduce the federal budget deficit and help workers in China and other Asian countries. Economic Policy Institute, Briefing Paper #318. Washington, D.C.: EPI. http://www.epi.org/publications/entry/revaluing_chinas_currency_could_boost_us_economic_recovery/
Scott, Robert E. 2011b. Testimony before the U.S. China Economic and Security Review Commission hearing, “Chinese State-Owned Enterprises and U.S.-China Bilateral Investment; Panel II: U.S. Investments in China,” March 30. http://www.epi.org/publications/entry/testimony_leveling_the_playing_field_in_u.s.-china_trade/
Stewart, Terence P., and Elizabeth J. Drake. 2010. Written testimony for Committee on Ways and Means hearing on China’s Exchange Rate Policy, U.S. House of Representatives, March 24.
U.S. Census Bureau. 2009. “American Community Survey: Custom Tabulation, Employment by state and 110th congressional district by industry, using pooled 2005-2007 data.” Washington, D.C. U.S. Census Bureau. http://www.census.gov/acs/www/data_documentation/custom_tabulations/
U.S. Census Bureau. 2011. Current Population Survey, Historical Time Series, “Table A-2: Percent of People 25 Years and Over Who Have Completed High School or College, by Race, Hispanic Origin and Sex: Selected Years 1940 to 2010.” http://www.census.gov/hhes/socdemo/education/data/cps/historical/tabA-2.xls
U.S. International Trade Commission. 2011. USITC Interactive Tariff and Trade DataWeb. http://dataweb.usitc.gov/scripts/user_set.asp
Wallach, Lori and Patrick Woodall. 2011. Whose Trade Organization: A Comprehensive Guide to the WTO. Washington, D.C.: Public Citizen.
Xing, Yuqing. 2010. “Facts About and Impacts of FDI on China and the World Economy.” China: an International Journal, Vol. 8, No. 2, pp. 309-327.
