What to watch on Jobs Day: Job growth has only been fast enough to keep up with population growth
On Friday, the Bureau of Labor Statistics will release the October numbers on the state of the labor market. As usual, I will be looking closely at nominal wage growth. Wage growth—a key indicator of labor market slack—remains far below target levels. It’s important to continue to encourage the Federal Reserve to keep their foot off the brakes until wage growth picks up. But, right now, I want to talk about the pace of job growth.
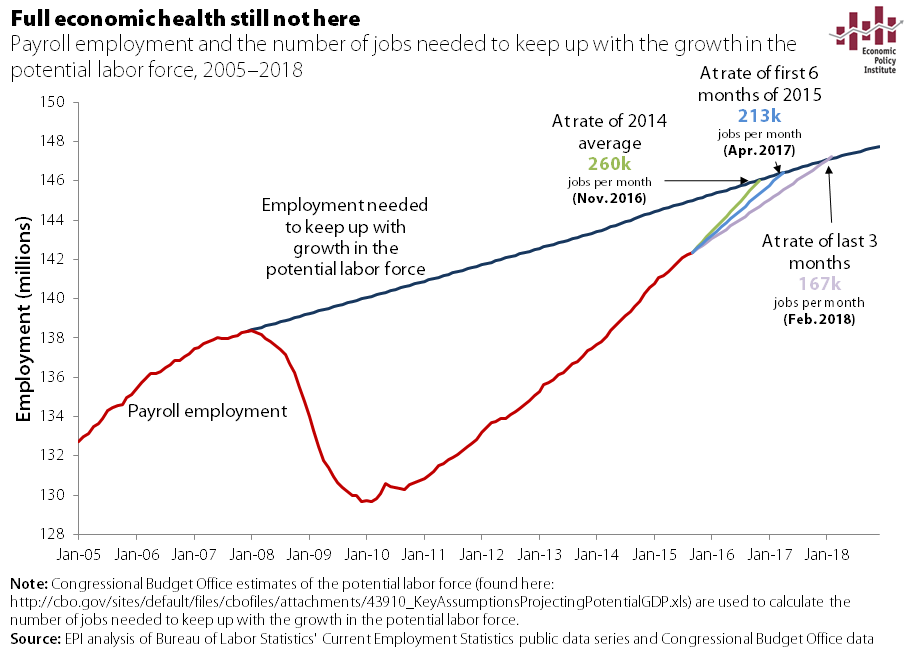
Previously, I’ve written about how payroll employment has been slower in 2015 compared with 2014. Average monthly job gains were 260,000 in 2014. This year so far job growth has averaged only 198,000— and moreover, job growth the last three months was noticeably slower than the previous three months. In the third quarter, average job gains were 167,000, compared with an average of 231,000 in the second quarter.
So, job growth has slowed, but what do these numbers really mean? Recent months are clearly weaker, slower, more sluggish than previous months, but are we still on the right track? At this recent slower rate of growth, a full jobs recovery is still almost two and a half years away.
Another way to get at the same story is to look at the prime-age employment-to-population ratio (EPOP), one of the best indicators of labor market health. Prime-age EPOP—the share of the working age population that is actually working—fell dramatically during the Great Recession, then saw some solid increases once the recovery began to take hold. You can see it flattening out for the last year—the prime-age EPOP in September was the same as it was in January. The slow employment growth over the last year is the root cause of flat prime-age EPOP. We have seen job growth over the last three months at a pace to pretty much just keep up with population growth. The working age population changes as some people enter that group, by simply aging in or by moving, while others age out or move out.
Employment-to-population ratio of workers ages 25-54, 2006-2015
| Month | Employment-to-population ratio |
|---|---|
| 2006-01-01 | 79.6% |
| 2006-02-01 | 79.7% |
| 2006-03-01 | 79.8% |
| 2006-04-01 | 79.6% |
| 2006-05-01 | 79.7% |
| 2006-06-01 | 79.8% |
| 2006-07-01 | 79.8% |
| 2006-08-01 | 79.8% |
| 2006-09-01 | 79.9% |
| 2006-10-01 | 80.1% |
| 2006-11-01 | 80.0% |
| 2006-12-01 | 80.1% |
| 2007-01-01 | 80.3% |
| 2007-02-01 | 80.1% |
| 2007-03-01 | 80.2% |
| 2007-04-01 | 80.0% |
| 2007-05-01 | 80.0% |
| 2007-06-01 | 79.9% |
| 2007-07-01 | 79.8% |
| 2007-08-01 | 79.8% |
| 2007-09-01 | 79.7% |
| 2007-10-01 | 79.6% |
| 2007-11-01 | 79.7% |
| 2007-12-01 | 79.7% |
| 2008-01-01 | 80.0% |
| 2008-02-01 | 79.9% |
| 2008-03-01 | 79.8% |
| 2008-04-01 | 79.6% |
| 2008-05-01 | 79.5% |
| 2008-06-01 | 79.4% |
| 2008-07-01 | 79.2% |
| 2008-08-01 | 78.8% |
| 2008-09-01 | 78.8% |
| 2008-10-01 | 78.4% |
| 2008-11-01 | 78.1% |
| 2008-12-01 | 77.6% |
| 2009-01-01 | 77.0% |
| 2009-02-01 | 76.7% |
| 2009-03-01 | 76.2% |
| 2009-04-01 | 76.2% |
| 2009-05-01 | 75.9% |
| 2009-06-01 | 75.9% |
| 2009-07-01 | 75.8% |
| 2009-08-01 | 75.6% |
| 2009-09-01 | 75.1% |
| 2009-10-01 | 75.0% |
| 2009-11-01 | 75.2% |
| 2009-12-01 | 74.8% |
| 2010-01-01 | 75.1% |
| 2010-02-01 | 75.1% |
| 2010-03-01 | 75.1% |
| 2010-04-01 | 75.4% |
| 2010-05-01 | 75.1% |
| 2010-06-01 | 75.2% |
| 2010-07-01 | 75.1% |
| 2010-08-01 | 75.0% |
| 2010-09-01 | 75.1% |
| 2010-10-01 | 75.0% |
| 2010-11-01 | 74.8% |
| 2010-12-01 | 75.0% |
| 2011-01-01 | 75.2% |
| 2011-02-01 | 75.1% |
| 2011-03-01 | 75.3% |
| 2011-04-01 | 75.1% |
| 2011-05-01 | 75.2% |
| 2011-06-01 | 75.0% |
| 2011-07-01 | 75.0% |
| 2011-08-01 | 75.1% |
| 2011-09-01 | 74.9% |
| 2011-10-01 | 74.9% |
| 2011-11-01 | 75.3% |
| 2011-12-01 | 75.4% |
| 2012-01-01 | 75.6% |
| 2012-02-01 | 75.6% |
| 2012-03-01 | 75.7% |
| 2012-04-01 | 75.7% |
| 2012-05-01 | 75.7% |
| 2012-06-01 | 75.7% |
| 2012-07-01 | 75.6% |
| 2012-08-01 | 75.7% |
| 2012-09-01 | 75.9% |
| 2012-10-01 | 76.0% |
| 2012-11-01 | 75.8% |
| 2012-12-01 | 75.9% |
| 2013-01-01 | 75.7% |
| 2013-02-01 | 75.9% |
| 2013-03-01 | 75.9% |
| 2013-04-01 | 75.9% |
| 2013-05-01 | 76.0% |
| 2013-06-01 | 75.9% |
| 2013-07-01 | 76.0% |
| 2013-08-01 | 75.9% |
| 2013-09-01 | 75.9% |
| 2013-10-01 | 75.5% |
| 2013-11-01 | 76.0% |
| 2013-12-01 | 76.1% |
| 2014-01-01 | 76.5% |
| 2014-02-01 | 76.5% |
| 2014-03-01 | 76.6% |
| 2014-04-01 | 76.5% |
| 2014-05-01 | 76.4% |
| 2014-06-01 | 76.8% |
| 2014-07-01 | 76.6% |
| 2014-08-01 | 76.8% |
| 2014-09-01 | 76.8% |
| 2014-10-01 | 76.9% |
| 2014-11-01 | 76.9% |
| 2014-12-01 | 77.0% |
| 2015-01-01 | 77.2% |
| 2015-02-01 | 77.3% |
| 2015-03-01 | 77.2% |
| 2015-04-01 | 77.2% |
| 2015-05-01 | 77.2% |
| 2015-06-01 | 77.2% |
| 2015-07-01 | 77.1% |
| 2015-08-01 | 77.2% |
| 2015-09-01 | 77.2% |

Source: EPI analysis of Bureau of Labor Statistics' Current Population Survey public data
So, if the prime-age EPOP stays flat, it means the labor market is simply absorbing the new population, not expanding. It isn’t shrinking, but it sure isn’t really growing either. And, that’s why a full job recovery is so far off into the future.
To put this year’s prime-age EPOP of 77.2 percent in perspective, it is still below the lowest point of the previous two business cycles. In fact, in the last business cycle, the prime-age EPOP trough was 78.6 percent, 1.4 percentage points higher than we are now. The closest we got to today’s rate was back in 1993, when prime-age EPOPs bottomed out at 78.1 percent, still 0.9 percentage points higher than today.
Employment-to-population ratio of workers ages 25–54, 1989–2015
| Date | Employment-to-population ratio |
|---|---|
| 1989-01-01 | 80.0% |
| 1989-02-01 | 79.9% |
| 1989-03-01 | 79.9% |
| 1989-04-01 | 79.8% |
| 1989-05-01 | 79.8% |
| 1989-06-01 | 79.8% |
| 1989-07-01 | 79.8% |
| 1989-08-01 | 79.9% |
| 1989-09-01 | 80.0% |
| 1989-10-01 | 79.9% |
| 1989-11-01 | 80.2% |
| 1989-12-01 | 80.1% |
| 1990-01-01 | 80.2% |
| 1990-02-01 | 80.2% |
| 1990-03-01 | 80.1% |
| 1990-04-01 | 79.9% |
| 1990-05-01 | 79.9% |
| 1990-06-01 | 79.8% |
| 1990-07-01 | 79.6% |
| 1990-08-01 | 79.5% |
| 1990-09-01 | 79.4% |
| 1990-10-01 | 79.4% |
| 1990-11-01 | 79.2% |
| 1990-12-01 | 79.0% |
| 1991-01-01 | 78.9% |
| 1991-02-01 | 78.9% |
| 1991-03-01 | 78.7% |
| 1991-04-01 | 79.0% |
| 1991-05-01 | 78.6% |
| 1991-06-01 | 78.7% |
| 1991-07-01 | 78.6% |
| 1991-08-01 | 78.5% |
| 1991-09-01 | 78.6% |
| 1991-10-01 | 78.5% |
| 1991-11-01 | 78.4% |
| 1991-12-01 | 78.3% |
| 1992-01-01 | 78.4% |
| 1992-02-01 | 78.2% |
| 1992-03-01 | 78.2% |
| 1992-04-01 | 78.4% |
| 1992-05-01 | 78.4% |
| 1992-06-01 | 78.5% |
| 1992-07-01 | 78.4% |
| 1992-08-01 | 78.4% |
| 1992-09-01 | 78.3% |
| 1992-10-01 | 78.2% |
| 1992-11-01 | 78.2% |
| 1992-12-01 | 78.2% |
| 1993-01-01 | 78.2% |
| 1993-02-01 | 78.1% |
| 1993-03-01 | 78.2% |
| 1993-04-01 | 78.2% |
| 1993-05-01 | 78.5% |
| 1993-06-01 | 78.6% |
| 1993-07-01 | 78.6% |
| 1993-08-01 | 78.8% |
| 1993-09-01 | 78.6% |
| 1993-10-01 | 78.7% |
| 1993-11-01 | 79.0% |
| 1993-12-01 | 79.0% |
| 1994-01-01 | 78.9% |
| 1994-02-01 | 78.9% |
| 1994-03-01 | 78.9% |
| 1994-04-01 | 79.0% |
| 1994-05-01 | 79.2% |
| 1994-06-01 | 78.8% |
| 1994-07-01 | 79.1% |
| 1994-08-01 | 79.2% |
| 1994-09-01 | 79.6% |
| 1994-10-01 | 79.6% |
| 1994-11-01 | 79.8% |
| 1994-12-01 | 79.8% |
| 1995-01-01 | 79.7% |
| 1995-02-01 | 80.0% |
| 1995-03-01 | 79.9% |
| 1995-04-01 | 79.8% |
| 1995-05-01 | 79.7% |
| 1995-06-01 | 79.5% |
| 1995-07-01 | 79.7% |
| 1995-08-01 | 79.6% |
| 1995-09-01 | 79.8% |
| 1995-10-01 | 79.8% |
| 1995-11-01 | 79.7% |
| 1995-12-01 | 79.7% |
| 1996-01-01 | 79.8% |
| 1996-02-01 | 79.9% |
| 1996-03-01 | 79.9% |
| 1996-04-01 | 79.9% |
| 1996-05-01 | 80.0% |
| 1996-06-01 | 80.1% |
| 1996-07-01 | 80.4% |
| 1996-08-01 | 80.5% |
| 1996-09-01 | 80.4% |
| 1996-10-01 | 80.6% |
| 1996-11-01 | 80.5% |
| 1996-12-01 | 80.5% |
| 1997-01-01 | 80.5% |
| 1997-02-01 | 80.4% |
| 1997-03-01 | 80.6% |
| 1997-04-01 | 80.7% |
| 1997-05-01 | 80.6% |
| 1997-06-01 | 80.9% |
| 1997-07-01 | 81.1% |
| 1997-08-01 | 81.3% |
| 1997-09-01 | 81.1% |
| 1997-10-01 | 81.1% |
| 1997-11-01 | 81.0% |
| 1997-12-01 | 81.0% |
| 1998-01-01 | 81.0% |
| 1998-02-01 | 81.0% |
| 1998-03-01 | 81.0% |
| 1998-04-01 | 81.1% |
| 1998-05-01 | 81.0% |
| 1998-06-01 | 81.0% |
| 1998-07-01 | 81.1% |
| 1998-08-01 | 81.2% |
| 1998-09-01 | 81.3% |
| 1998-10-01 | 81.1% |
| 1998-11-01 | 81.2% |
| 1998-12-01 | 81.3% |
| 1999-01-01 | 81.8% |
| 1999-02-01 | 81.5% |
| 1999-03-01 | 81.3% |
| 1999-04-01 | 81.3% |
| 1999-05-01 | 81.4% |
| 1999-06-01 | 81.4% |
| 1999-07-01 | 81.2% |
| 1999-08-01 | 81.3% |
| 1999-09-01 | 81.3% |
| 1999-10-01 | 81.5% |
| 1999-11-01 | 81.6% |
| 1999-12-01 | 81.5% |
| 2000-01-01 | 81.8% |
| 2000-02-01 | 81.8% |
| 2000-03-01 | 81.7% |
| 2000-04-01 | 81.9% |
| 2000-05-01 | 81.5% |
| 2000-06-01 | 81.5% |
| 2000-07-01 | 81.3% |
| 2000-08-01 | 81.1% |
| 2000-09-01 | 81.1% |
| 2000-10-01 | 81.1% |
| 2000-11-01 | 81.3% |
| 2000-12-01 | 81.4% |
| 2001-01-01 | 81.4% |
| 2001-02-01 | 81.3% |
| 2001-03-01 | 81.3% |
| 2001-04-01 | 80.9% |
| 2001-05-01 | 80.8% |
| 2001-06-01 | 80.6% |
| 2001-07-01 | 80.5% |
| 2001-08-01 | 80.2% |
| 2001-09-01 | 80.2% |
| 2001-10-01 | 79.9% |
| 2001-11-01 | 79.7% |
| 2001-12-01 | 79.8% |
| 2002-01-01 | 79.6% |
| 2002-02-01 | 79.8% |
| 2002-03-01 | 79.6% |
| 2002-04-01 | 79.5% |
| 2002-05-01 | 79.4% |
| 2002-06-01 | 79.2% |
| 2002-07-01 | 79.1% |
| 2002-08-01 | 79.3% |
| 2002-09-01 | 79.4% |
| 2002-10-01 | 79.2% |
| 2002-11-01 | 78.8% |
| 2002-12-01 | 79.0% |
| 2003-01-01 | 78.9% |
| 2003-02-01 | 78.9% |
| 2003-03-01 | 79.0% |
| 2003-04-01 | 79.1% |
| 2003-05-01 | 78.9% |
| 2003-06-01 | 78.9% |
| 2003-07-01 | 78.8% |
| 2003-08-01 | 78.7% |
| 2003-09-01 | 78.6% |
| 2003-10-01 | 78.6% |
| 2003-11-01 | 78.7% |
| 2003-12-01 | 78.8% |
| 2004-01-01 | 78.9% |
| 2004-02-01 | 78.8% |
| 2004-03-01 | 78.7% |
| 2004-04-01 | 78.9% |
| 2004-05-01 | 79.0% |
| 2004-06-01 | 79.1% |
| 2004-07-01 | 79.2% |
| 2004-08-01 | 79.0% |
| 2004-09-01 | 79.0% |
| 2004-10-01 | 79.0% |
| 2004-11-01 | 79.1% |
| 2004-12-01 | 78.9% |
| 2005-01-01 | 79.2% |
| 2005-02-01 | 79.2% |
| 2005-03-01 | 79.2% |
| 2005-04-01 | 79.4% |
| 2005-05-01 | 79.5% |
| 2005-06-01 | 79.2% |
| 2005-07-01 | 79.4% |
| 2005-08-01 | 79.6% |
| 2005-09-01 | 79.4% |
| 2005-10-01 | 79.3% |
| 2005-11-01 | 79.2% |
| 2005-12-01 | 79.3% |
| 2006-01-01 | 79.6% |
| 2006-02-01 | 79.7% |
| 2006-03-01 | 79.8% |
| 2006-04-01 | 79.6% |
| 2006-05-01 | 79.7% |
| 2006-06-01 | 79.8% |
| 2006-07-01 | 79.8% |
| 2006-08-01 | 79.8% |
| 2006-09-01 | 79.9% |
| 2006-10-01 | 80.1% |
| 2006-11-01 | 80.0% |
| 2006-12-01 | 80.1% |
| 2007-01-01 | 80.3% |
| 2007-02-01 | 80.1% |
| 2007-03-01 | 80.2% |
| 2007-04-01 | 80.0% |
| 2007-05-01 | 80.0% |
| 2007-06-01 | 79.9% |
| 2007-07-01 | 79.8% |
| 2007-08-01 | 79.8% |
| 2007-09-01 | 79.7% |
| 2007-10-01 | 79.6% |
| 2007-11-01 | 79.7% |
| 2007-12-01 | 79.7% |
| 2008-01-01 | 80.0% |
| 2008-02-01 | 79.9% |
| 2008-03-01 | 79.8% |
| 2008-04-01 | 79.6% |
| 2008-05-01 | 79.5% |
| 2008-06-01 | 79.4% |
| 2008-07-01 | 79.2% |
| 2008-08-01 | 78.8% |
| 2008-09-01 | 78.8% |
| 2008-10-01 | 78.4% |
| 2008-11-01 | 78.1% |
| 2008-12-01 | 77.6% |
| 2009-01-01 | 77.0% |
| 2009-02-01 | 76.7% |
| 2009-03-01 | 76.2% |
| 2009-04-01 | 76.2% |
| 2009-05-01 | 75.9% |
| 2009-06-01 | 75.9% |
| 2009-07-01 | 75.8% |
| 2009-08-01 | 75.6% |
| 2009-09-01 | 75.1% |
| 2009-10-01 | 75.0% |
| 2009-11-01 | 75.2% |
| 2009-12-01 | 74.8% |
| 2010-01-01 | 75.1% |
| 2010-02-01 | 75.1% |
| 2010-03-01 | 75.1% |
| 2010-04-01 | 75.4% |
| 2010-05-01 | 75.1% |
| 2010-06-01 | 75.2% |
| 2010-07-01 | 75.1% |
| 2010-08-01 | 75.0% |
| 2010-09-01 | 75.1% |
| 2010-10-01 | 75.0% |
| 2010-11-01 | 74.8% |
| 2010-12-01 | 75.0% |
| 2011-01-01 | 75.2% |
| 2011-02-01 | 75.1% |
| 2011-03-01 | 75.3% |
| 2011-04-01 | 75.1% |
| 2011-05-01 | 75.2% |
| 2011-06-01 | 75.0% |
| 2011-07-01 | 75.0% |
| 2011-08-01 | 75.1% |
| 2011-09-01 | 74.9% |
| 2011-10-01 | 74.9% |
| 2011-11-01 | 75.3% |
| 2011-12-01 | 75.4% |
| 2012-01-01 | 75.6% |
| 2012-02-01 | 75.6% |
| 2012-03-01 | 75.7% |
| 2012-04-01 | 75.7% |
| 2012-05-01 | 75.7% |
| 2012-06-01 | 75.7% |
| 2012-07-01 | 75.6% |
| 2012-08-01 | 75.7% |
| 2012-09-01 | 75.9% |
| 2012-10-01 | 76.0% |
| 2012-11-01 | 75.8% |
| 2012-12-01 | 75.9% |
| 2013-01-01 | 75.7% |
| 2013-02-01 | 75.9% |
| 2013-03-01 | 75.9% |
| 2013-04-01 | 75.9% |
| 2013-05-01 | 76.0% |
| 2013-06-01 | 75.9% |
| 2013-07-01 | 76.0% |
| 2013-08-01 | 75.9% |
| 2013-09-01 | 75.9% |
| 2013-10-01 | 75.5% |
| 2013-11-01 | 76.0% |
| 2013-12-01 | 76.1% |
| 2014-01-01 | 76.5% |
| 2014-02-01 | 76.5% |
| 2014-03-01 | 76.6% |
| 2014-04-01 | 76.5% |
| 2014-05-01 | 76.4% |
| 2014-06-01 | 76.8% |
| 2014-07-01 | 76.6% |
| 2014-08-01 | 76.8% |
| 2014-09-01 | 76.8% |
| 2014-10-01 | 76.9% |
| 2014-11-01 | 76.9% |
| 2014-12-01 | 77.0% |
| 2015-01-01 | 77.2% |
| 2015-02-01 | 77.3% |
| 2015-03-01 | 77.2% |
| 2015-04-01 | 77.2% |
| 2015-05-01 | 77.2% |
| 2015-06-01 | 77.2% |
| 2015-07-01 | 77.1% |
| 2015-08-01 | 77.2% |
| 2015-09-01 | 77.2% |
Source: EPI analysis of Bureau of Labor Statistics' Current Population Survey public data
For the labor market to be truly expansionary, we need to see faster job growth—to employ the new labor market entrants, unemployed workers, and the 4 million missing workers who have left or never entered the labor market because of weak job opportunities.
Enjoyed this post?
Sign up for EPI's newsletter so you never miss our research and insights on ways to make the economy work better for everyone.