New Fed data shows families falling even farther behind in retirement saving
The Federal Reserve just published findings from the 2010 Survey of Consumer Finances, a triennial survey of household finances. Though it’s no surprise that these took a dive with the collapse of the housing and stock bubbles, the extent of the plunge is still shocking as the median family saw their net worth fall by 39 percent between 2007 and 2010.1
By 2010, the economy had begun its slow recovery. Housing prices had leveled off and stocks rebounded, recouping about half their losses by the end of the year. But this wasn’t just a temporary setback. Households—especially younger households—were in serious trouble long before the twin asset bubbles burst.
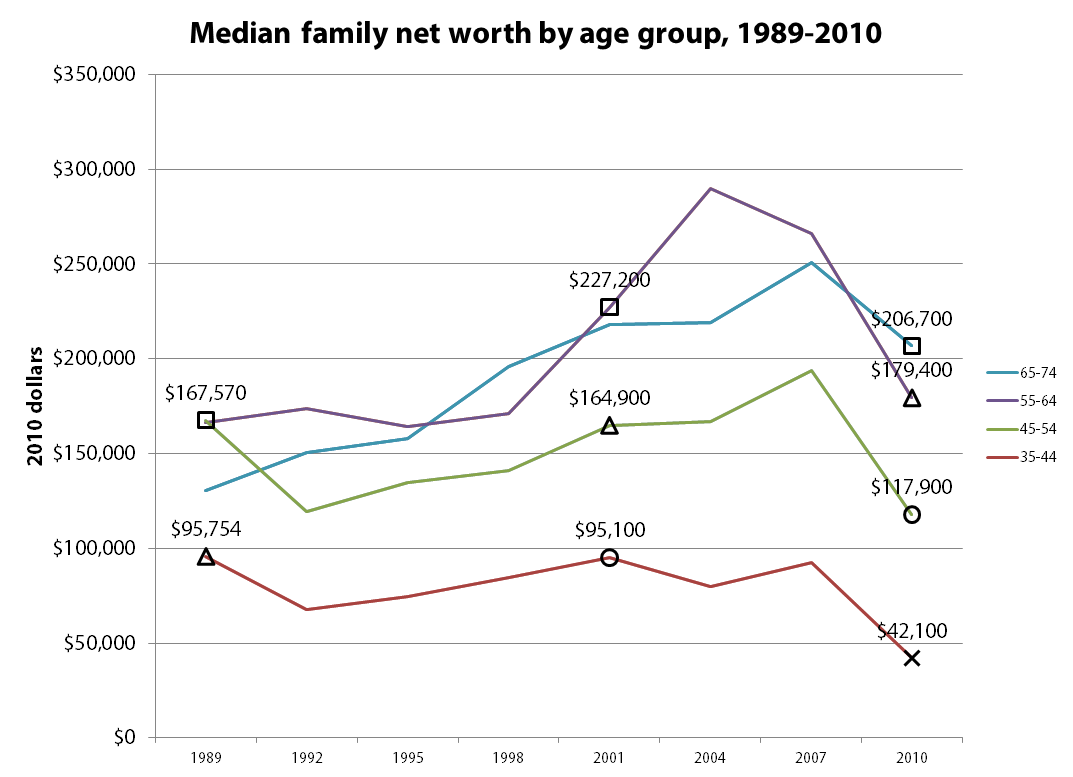
Families headed by someone age 35 to 44—the age when workers typically start getting serious about saving for retirement—had seen declines in net worth in the wake of two previous recessions (1990-91 and 2001) without fully regaining the lost ground in the intervening years (see chart below). So the financial meltdowns that precipitated the Great Recession only exacerbated an existing problem. As a result, GenXers had only accumulated $42,100 in 2010, less than half what the Baby Boomers had accumulated at the same age adjusted for inflation (in the chart, Depression and War Babies are indicated by squares, Early Boomers by triangles, Late Boomers by circles, and GenXers by an X).2
The fact that net worth declined for younger age groups even before the Great Recession is remarkable when you consider that the economy grew by a third on a per capita inflation-adjusted basis between 1989 and 2010, though this growth was not widely shared. Furthermore, families should have been saving more to make up for declines in pension coverage and Social Security benefits. As a result, the Center for Retirement Research has estimated that the average family in the broad 35-64 age range had a Retirement Income Deficit of $90,000 in 2010, a measure of how far behind they were in saving and accumulating benefits for retirement.
Even a generation that fared relatively well—the cohort born during the last years of the Great Depression and World War II—had only accumulated $227,000 as it approached retirement in 2001. This is roughly four times the median income for that age group in 2001, or enough to purchase a 20-year annuity worth $3,750 a year at a 3 percent real interest rate.3 As these Depression and War Babies began tapping their retirement savings during the boom and bust years of the new millennium, their net worth fell to $206,700 in 2010, whereas the preceding generation had seen increases in net worth during their early retirement years.
Baby Boomers fared much worse than the Depression and War Babies, lulled into complacency by asset bubbles that inflated during their prime earning years and popped as the leading edge of the Boomer generation approached retirement. Early Boomers born in the late 1940s and early 1950s saw their net worth increase by around $69,000 between 1989 and 2001 (a 4.6 percent annual rate), but only by a meager $14,500 between 2001 and 2010 (a 0.9 percent annual rate). Late Boomers fared no better, and, like GenXers, are now far behind where earlier generations had been at the same age.
Though it may be tempting to chastise families for not saving enough for retirement, most of the blame lies with former Federal Reserve Chairman Alan Greenspan and others in positions of responsibility who watched asset bubbles inflate without warning that these paper gains weren’t real, and promoted homeownership and 401(k)s as the path to a secure retirement without acknowledging the extent of the risks involved.
1. A special 2009 survey that re-interviewed families who had participated in the 2007 survey found a much smaller 19 percent drop in median net worth between 2007 and 2009.
2. The published survey results don’t allow precise tracking of generational cohorts because demographic breakdowns are by 10-year age group and the survey is conducted every three years. However, the 45-54 “Depression and War Baby” cohort in 1989 approximately corresponds to the 55-64 age group in 2001 and with the 65-74 age group in 2010, etc.
3. In practice, the typical household holds most of their wealth in the form of home equity and doesn’t annuitize liquid assets.
Enjoyed this post?
Sign up for EPI's newsletter so you never miss our research and insights on ways to make the economy work better for everyone.