A weekly presentation of downloadable charts and short analyses designed to graphically illustrate important economic issues. Updated every Wednesday.
Snapshot for August 14, 2002.
Tax cuts account for most of drop in surplus
How much last year’s tax cut contributed to the fall in projected federal budget surpluses has been the source of intense debate. In January 2001, the Congressional Budget Office (CBO) projected the “baseline” surplus over the ensuing 10 years (2002 to 2011) at $5.6 trillion. The CBO cautioned that a recession would reduce this projection by a total of $133 billion over that same 10 year period (see Table 5-5, Economic and Budget Outlook, January 2001).
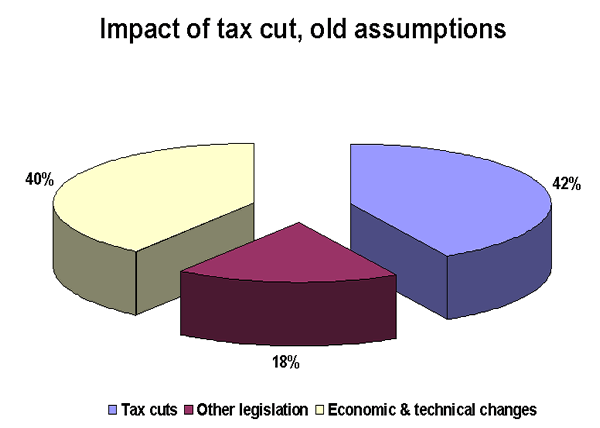
The actual drop in the surplus for 2002 to 2011 has been $3.9 trillion. How much is due to the tax cuts as opposed to other factors? Here is a pie chart from the Republican staff of the Senate Budget Committee:

According to this chart, tax cuts have accounted for 42% of the surplus reduction. The chart also shows that the “economic and technical adjustments” are nearly as large as the tax cut itself, accounting for 40% of the total, or more than $1.5 trillion. The problem is that this $1.5 trillion is more than 10 times the size of the CBO’s projected recession adjustment of $133 billion. In other words, the CBO’s January 2001 model was wrong. With the benefit of a better model, the projection in January 2001 would have been $4.2 trillion, not $5.6.
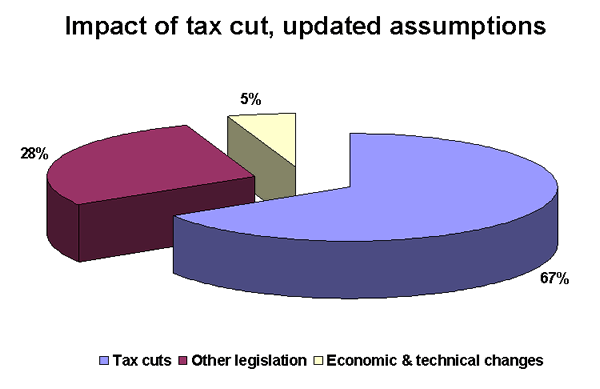
Presently the surplus for FY2002-11 is projected at $1.7 trillion. So the reduction, from the standpoint of a correct projection, is $4.2 trillion minus $1.7 trillion, or $2.5 trillion. But this means the tax cut looms ever larger in the surplus reduction. Here is a revised pie chart, assuming an economic adjustment for a recession of $133 billion:

With better foresight in the preparation of the projections in 2001, the impact of the tax cut would not be 40% but rather 67%. In the context of the incorrect model of January 2001, the tax cut looks smaller than it is with the benefit of more accurate assumptions.
That the CBO did its best in 2001 should not be doubted. Nor should we be especially uncomfortable with the extent of surplus reduction in the next couple of years. More debatable is the implied allocation of resources in the long term, that is, the extent of the surplus devoted to tax cuts, as opposed to other national priorities.
Sources: Author’s analysis of Congressional Budget Office, Current Budget Projections, http://www.cbo.gov/showdoc.cfm?index=1944&sequence=0; Congressional Budget Office, Economic and Budget Outlook, 2002-2011, January 2001; Senate Budget Committee, Republican staff, Informed Budgeteer, February 18, 2002, 107th Congress, No. 3.
This week’s Snapshot by EPI economist Max B. Sawicky.
Check out the archive for past Economic Snapshots.
