Snapshot for April 23, 2003.
Underemployment hits 10% as gap with unemployment expands
For various reasons, many analysts have wondered if the unemployment rate, which was 5.8% in March, is always the best measure of labor market weakness. Unemployment rates only reflect those actively seeking work, and thus overlook some other important dimensions of joblessness that are particularly germane in a period of slow growth. For example, the growth of the labor force receded over the course of the recession, as millions decided not to look for work in an inhospitable job market, and this dampened the rise in unemployment.
A more comprehensive measure of labor utilization is underemployment. This Bureau of Labor Statistics (BLS) concept includes the unemployed, discouraged workers (people who looked for work at some point over the past year, but have given up due to lack of prospects), involuntary part-timers (part-time workers who would prefer full-time work), and a smaller group of people who want to work but face a barrier such as lack of transportation or child care. The figure below plots both unemployment and underemployment.
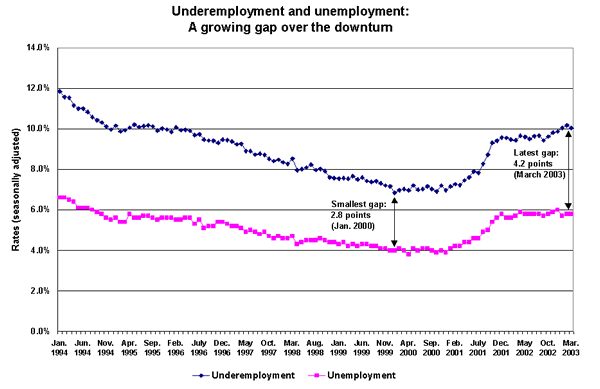
Two points stand out from the figure. First, underemployment is consistently just below twice unemployment, on average. Second, the gap between the two series declined over the boom and has expanded in the recession/jobless recovery period (underemployment data tracking begins in 1994). These changes in the gap are due to the fact that the number of discouraged workers and involuntary part-timers is countercyclical, falling in good times and rising in bad (e.g., there were 4.7 million involuntary part-timers this March, up from 3.3 million two years ago). Thus, the gap between unemployment and underemployment went from a low of 2.8 percentage points in January 2000 to 4.2 points in March 2003. Since unemployment bottomed out in December 2000, it has increased by 1.9 percentage points, while underemployment is up by 3.1 points.
Note: The source of these data is the BLS, and both the unemployment and underemployment data are seasonally adjusted in the figure. Since the BLS does not seasonally adjust underemployment rates, in this instance they have been adjusted by the author.
This week’s Snapshot by EPI economist Jared Bernstein, with research assistance by Brendan Hill.
Check out the archive for past Economic Snapshots.
