See Snapshots archive.
Snapshot for June 6, 2007.
A Tale of Two Time Periods for Low-Income Families
A recent study [PDF] by the Congressional Budget Office (CBO) provided a useful look at the income trends of low-income families with children (i.e., those in the bottom fifth of the income scale).
Some analysts, notably Ron Haskins in a Washington Post op-ed, reported quite glowingly on the findings from the study, especially the fact that the income of such families grew 35% in real terms from 1991 to 2005 for all families, and 28% for single mothers.
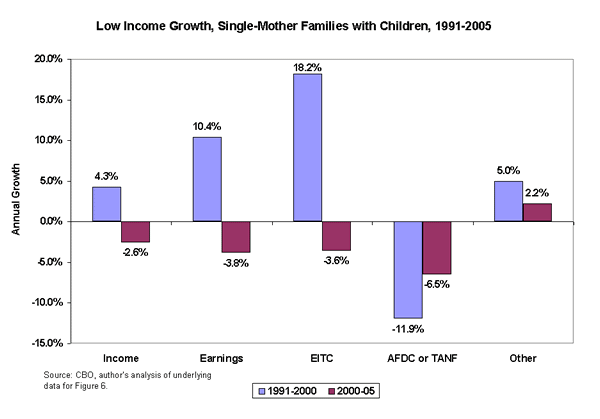
But, as the chart below reveals, this is really a tale of two very different time periods.

Though the trend is similar for all low-income families with children,1 the chart focuses on single mothers (average 2005 income: $13,700), comparing growth rates for their total income and its various components in the 1990s to those rates in the 2000s. Over the course of the 1990s, the new welfare reform rules interacted with tight labor markets and an expansion of the Earned Income Tax Credit to generate historically large income gains and significant poverty reduction for these families. As shown in the fourth set of bars (“AFDC or TANF”), welfare benefits fell sharply, but, at least while the job market boomed, this decline was more than offset by increases in earnings and the EITC.
But when the job market faltered in the 2000s, not only did real earnings reverse course, but the safety net failed to catch these vulnerable families as their employment opportunities took a recessionary hit. The growth of EITC benefits reversed sharply, from 10.4% per year in the 1990s, to -3.8% in the 2000s. Perhaps of greatest concern, welfare benefits failed to pick up the slack. True, these benefits fell more slowly in the 2000s than in the 1990s (-6.5% compared to -11.9% per year), but they failed families at a time they needed them most.
The result was a real income decline of 2.6% per year, amounting to a $1,900 dollar loss between 2000 and 2005.
This last point is critical. While the welfare-to-work aspects of welfare reform have been widely viewed as an unequivocal policy success—Haskins recommends extending these reforms to food stamps and housing programs—a clearer understanding of what has happened since 2000 should give pause to policy makers. The combination of a booming labor market and generous subsidies did, in fact, prove to be a powerful anti-poverty combination in the 1990s. But in the absence of robust job creation and plentiful employment opportunities, the real incomes of low-income families with children have steadily eroded, not improved. To ignore this reality by conflating the very different trends over these two very different periods is a real mistake.
Note
1. For all low-income families with children, real income grew 4.6% per year in the 1990s and fell 2.2% per year in the 2000s.
