A common theme uniting many conservative economic plans is that policymakers in recent years have somehow hamstrung the ability of American business to make profits. This theme comes up most clearly when conservatives decry a “regulatory onslaught” and when they call for a cut in corporate income tax rates to make U.S. corporations more internationally “competitive.”
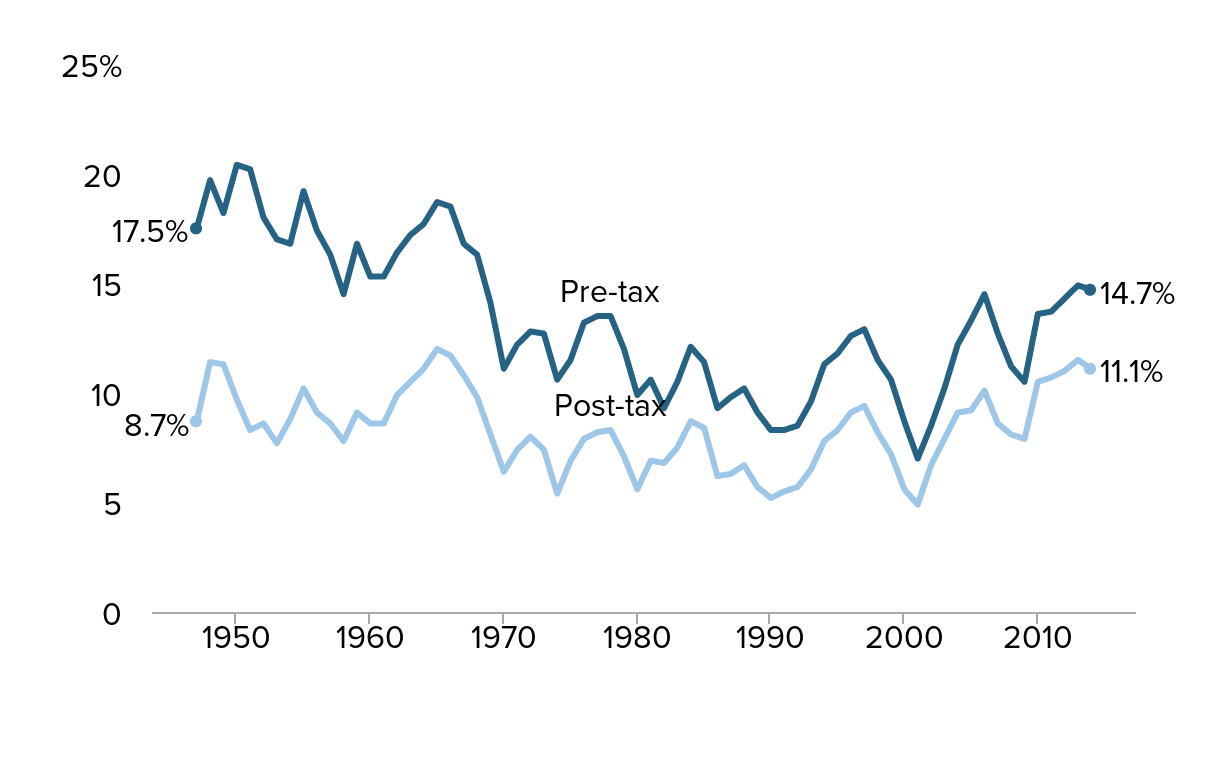
However, the claim that American business is suffering seems awfully hard to square with the data. The figure below shows pre- and post-tax profit margins in the U.S. non-financial corporate sector. The profit margin is the share of unit prices that is claimed by profits rather than employee compensation or other business costs like depreciation. Both pre- and post-tax margins have been extraordinarily high in recent years, with each reaching their highest levels since the mid-to-late 1960s. In other words, there is little need to increase our coddling of corporate profits.
The data show little need to increase our coddling of corporate profits: U.S. corporate pre- and post-tax profit margin rate*, 1947–2014
| Year | Pre-tax | Post-tax |
|---|---|---|
| 1947 | 17.5% | 8.7% |
| 1948 | 19.7% | 11.4% |
| 1949 | 18.2% | 11.3% |
| 1950 | 20.4% | 9.7% |
| 1951 | 20.2% | 8.3% |
| 1952 | 18.0% | 8.6% |
| 1953 | 17.0% | 7.7% |
| 1954 | 16.8% | 8.8% |
| 1955 | 19.2% | 10.2% |
| 1956 | 17.4% | 9.1% |
| 1957 | 16.3% | 8.6% |
| 1958 | 14.5% | 7.8% |
| 1959 | 16.8% | 9.1% |
| 1960 | 15.3% | 8.6% |
| 1961 | 15.3% | 8.6% |
| 1962 | 16.4% | 9.9% |
| 1963 | 17.2% | 10.5% |
| 1964 | 17.7% | 11.1% |
| 1965 | 18.7% | 12.0% |
| 1966 | 18.5% | 11.7% |
| 1967 | 16.8% | 10.8% |
| 1968 | 16.3% | 9.8% |
| 1969 | 14.1% | 8.1% |
| 1970 | 11.1% | 6.4% |
| 1971 | 12.2% | 7.4% |
| 1972 | 12.8% | 8.0% |
| 1973 | 12.7% | 7.4% |
| 1974 | 10.6% | 5.4% |
| 1975 | 11.5% | 6.9% |
| 1976 | 13.2% | 7.9% |
| 1977 | 13.5% | 8.2% |
| 1978 | 13.5% | 8.3% |
| 1979 | 12.0% | 7.1% |
| 1980 | 9.9% | 5.6% |
| 1981 | 10.6% | 6.9% |
| 1982 | 9.3% | 6.8% |
| 1983 | 10.5% | 7.5% |
| 1984 | 12.1% | 8.7% |
| 1985 | 11.4% | 8.4% |
| 1986 | 9.3% | 6.2% |
| 1987 | 9.8% | 6.3% |
| 1988 | 10.2% | 6.7% |
| 1989 | 9.1% | 5.7% |
| 1990 | 8.3% | 5.2% |
| 1991 | 8.3% | 5.5% |
| 1992 | 8.5% | 5.7% |
| 1993 | 9.6% | 6.5% |
| 1994 | 11.3% | 7.8% |
| 1995 | 11.8% | 8.3% |
| 1996 | 12.6% | 9.1% |
| 1997 | 12.9% | 9.4% |
| 1998 | 11.5% | 8.2% |
| 1999 | 10.6% | 7.2% |
| 2000 | 8.7% | 5.6% |
| 2001 | 7.0% | 4.9% |
| 2002 | 8.5% | 6.7% |
| 2003 | 10.2% | 7.9% |
| 2004 | 12.2% | 9.1% |
| 2005 | 13.3% | 9.2% |
| 2006 | 14.5% | 10.1% |
| 2007 | 12.7% | 8.6% |
| 2008 | 11.2% | 8.1% |
| 2009 | 10.5% | 7.9% |
| 2010 | 13.6% | 10.5% |
| 2011 | 13.7% | 10.7% |
| 2012 | 14.3% | 11.0% |
| 2013 | 14.9% | 11.5% |
| 2014 | 14.7% | 11.1% |

* The profit margin is defined as unit profits (profit per unit of sales) divided by price per unit in the non-financial corporate sector.
Source: Author's analysis of Bureau of Economic Analysis National Income and Product Account Table 1.1.15