Though the country has come a long way from the depths of the Great Recession—with unemployment falling considerably over the past five years—a significant portion of the drop in unemployment is due to job-seekers giving up on the job search and dropping out of the labor force.
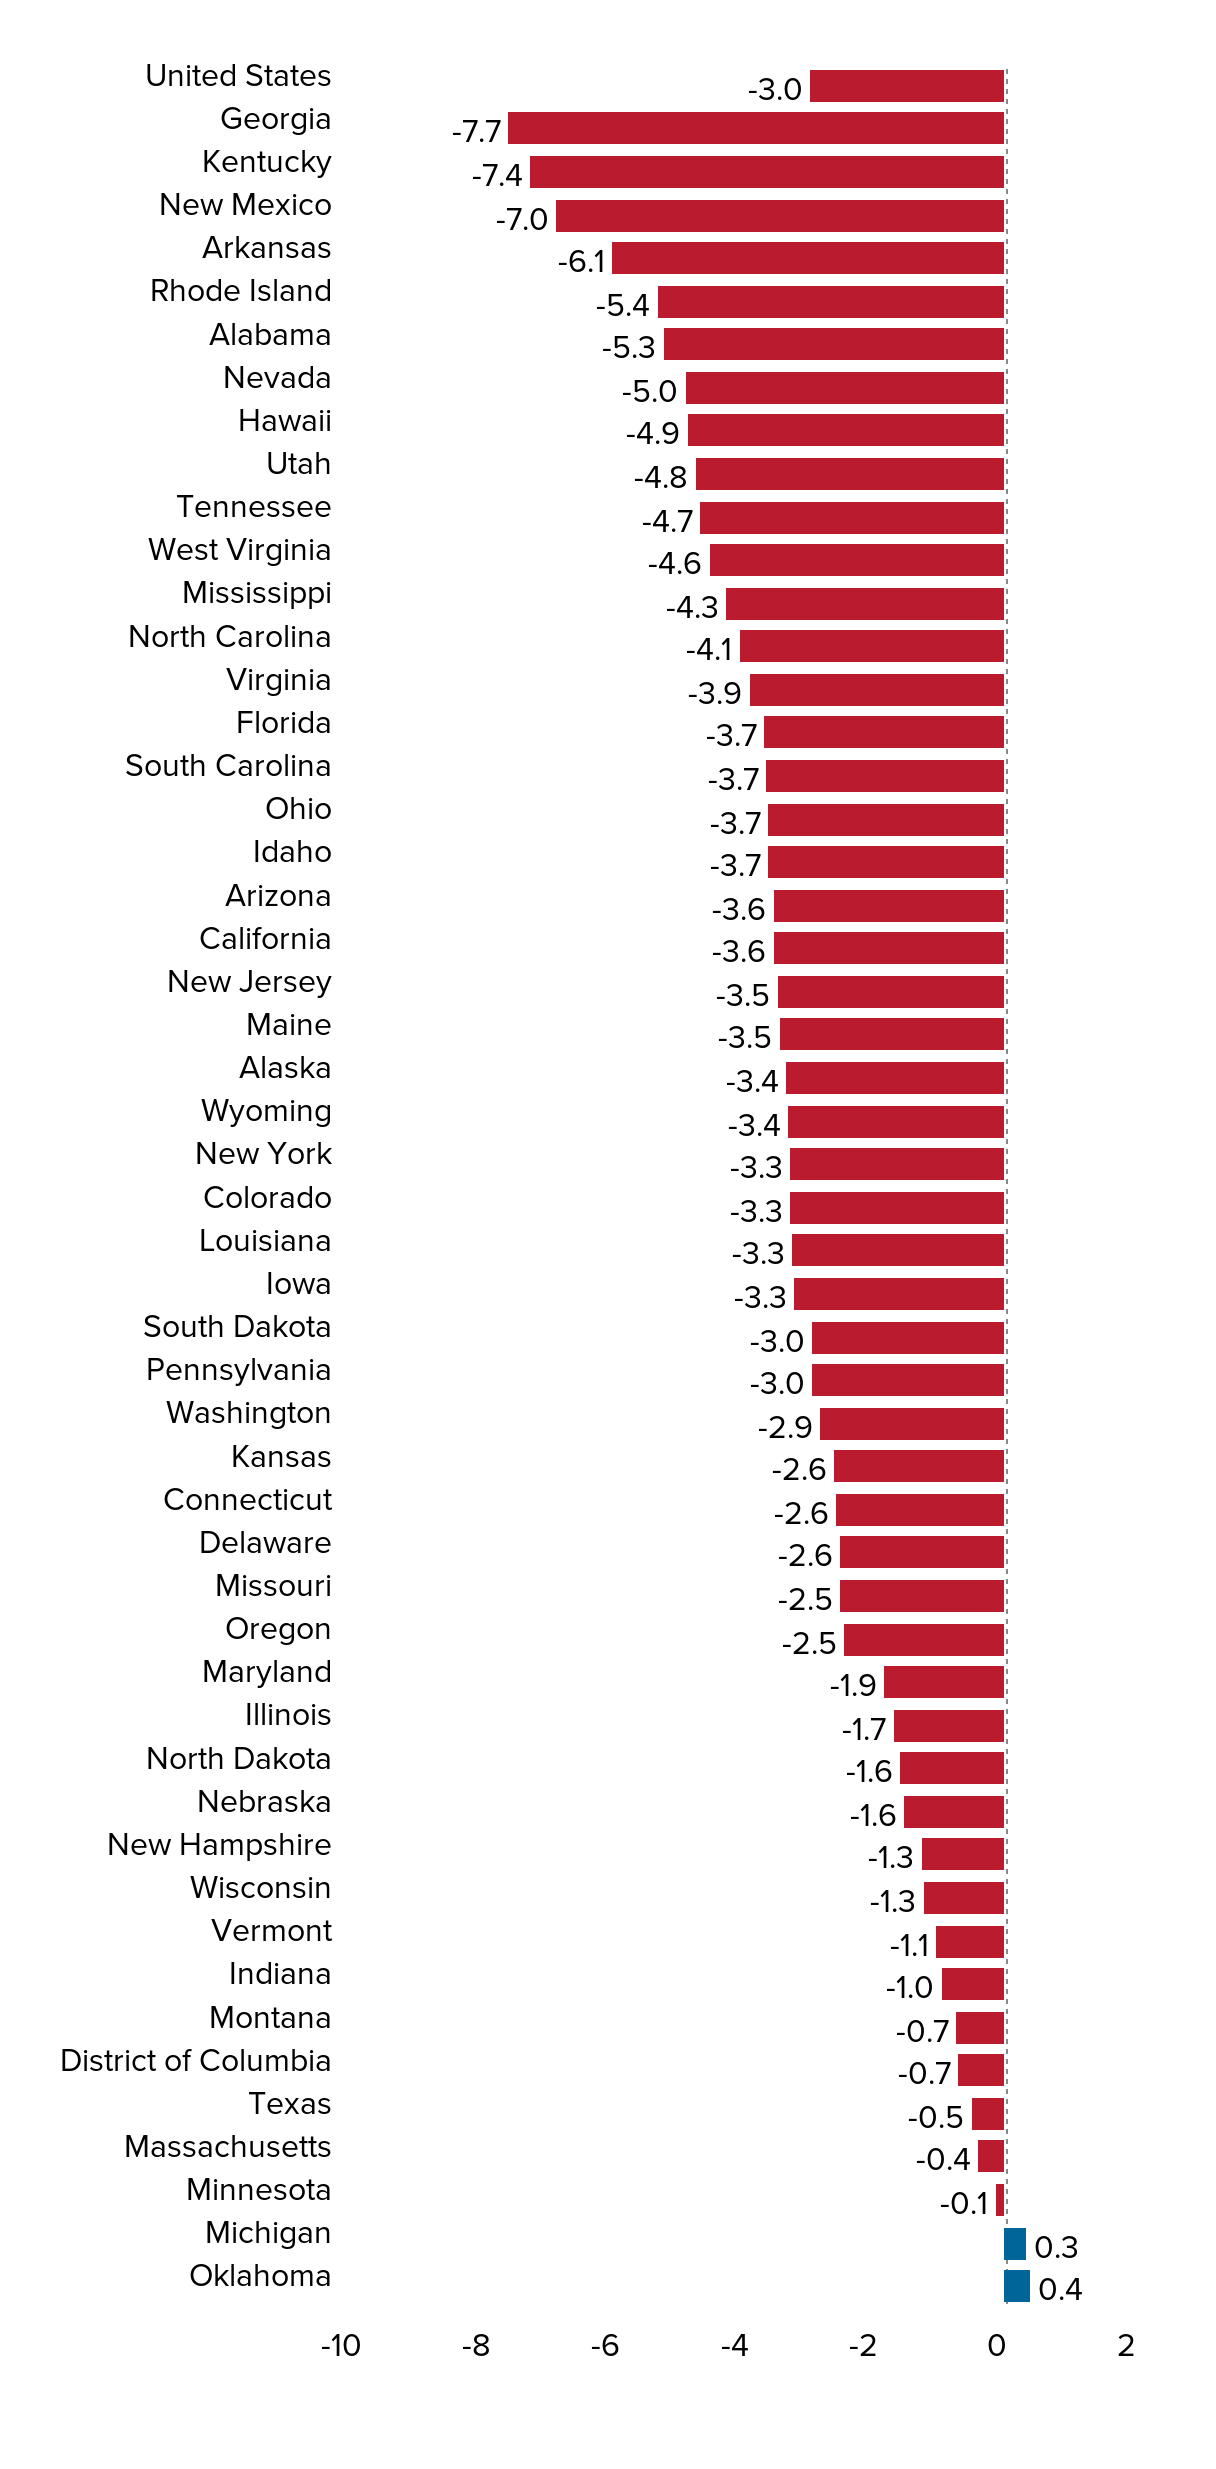
The clearest measure of true labor market health is the prime-age employment-to-population (EPOP) ratio—the percentage of the population ages 25 to 54 with a job. Looking only at the population ages 25 to 54 excludes changes in the EPOP that might be driven by the aging of the population or more young people going to school. The figure shows the difference in the prime-age employment-to-population ratio in each state from the third quarter of 2007 to the third quarter of 2014. While the share of Americans ages 25 to 54 with a job declined by 3.1 percentage points nationally over that period, three states experienced a decline of 7 percentage points or more: New Mexico, Kentucky, and Georgia. Oklahoma and Michigan are the only two states where a larger share of the 25-to 54-year-old population is working now than in the quarter before the Recession hit. Unfortunately, in both cases, the 25- to 54-year-old population has shrunk—by 2.8 percent in Oklahoma and 12.5 percent in Michigan—meaning that the EPOP changes in these two states are driven by a declining working-age population, not by strong job growth. This is another reminder that workers in every state would greatly benefit from policies that create more jobs.
The share of the prime-working-age population with a job has declined in all but two states: Change in employment-to-population ratio of workers ages 25–54, 2007Q3–2014Q3 (percentage points)
| State | Change |
|---|---|
| United States | -3.02 |
| Georgia | -7.70 |
| Kentucky | -7.37 |
| New Mexico | -6.97 |
| Arkansas | -6.10 |
| Rhode Island | -5.38 |
| Alabama | -5.28 |
| Nevada | -4.96 |
| Hawaii | -4.90 |
| Utah | -4.78 |
| Tennessee | -4.73 |
| West Virginia | -4.57 |
| Mississippi | -4.32 |
| North Carolina | -4.11 |
| Virginia | -3.94 |
| Florida | -3.73 |
| South Carolina | -3.71 |
| Ohio | -3.68 |
| Idaho | -3.68 |
| Arizona | -3.59 |
| California | -3.59 |
| New Jersey | -3.51 |
| Maine | -3.50 |
| Alaska | -3.39 |
| Wyoming | -3.37 |
| New York | -3.34 |
| Colorado | -3.34 |
| Louisiana | -3.31 |
| Iowa | -3.27 |
| South Dakota | -3.00 |
| Pennsylvania | -2.98 |
| Washington | -2.86 |
| Kansas | -2.65 |
| Connecticut | -2.62 |
| Delaware | -2.57 |
| Missouri | -2.55 |
| Oregon | -2.51 |
| Maryland | -1.88 |
| Illinois | -1.73 |
| North Dakota | -1.64 |
| Nebraska | -1.57 |
| New Hampshire | -1.30 |
| Wisconsin | -1.26 |
| Vermont | -1.07 |
| Indiana | -0.98 |
| Montana | -0.75 |
| District of Columbia | -0.74 |
| Texas | -0.50 |
| Massachusetts | -0.43 |
| Minnesota | -0.15 |
| Michigan | 0.331 |
| Oklahoma | 0.403 |

Source: EPI Analysis of Current Population Survey microdata, 2007Q3–2014Q3