
According to the employment report just released by the Bureau of Labor Statistics, April was another strange month of mixed messages in the labor market. The payroll survey came in surprisingly strong, with 244,000 jobs added. Excluding temporary hiring for the 2010 U.S. Census from monthly jobs numbers, April’s increase was the largest monthly gain in five years. The household survey, however, went in the opposite direction, with the unemployment rate increasing from 8.8% to 9.0%. This increase in unemployment was not due to formerly sidelined workers deciding to look for work, because the labor force increased by only 15,000 people in April—not nearly enough to keep up with working-age population growth. The rule of thumb when the payroll and household surveys go in opposite directions is to put more weight on the payroll survey, since it is much larger and less volatile month-to-month. And while net jobs growth of 244,000 is relatively good news, this country has nearly 14 million unemployed workers, and millions more jobless workers who have given up even trying to find a new job. At April’s job growth rate, it would take until the fall of 2016 to get back to the prerecession unemployment rate. Still, payroll job growth has exceeded 220,000 for the last three months, 700,000 in total, which indicates steady job growth that was not apparent previously.
Though all groups are hurting, some have been hit particularly hard
All major groups of workers have experienced substantial increases in unemployment over the Great Recession and its aftermath. However, young workers, workers with lower levels of schooling, racial and ethnic minorities, men, and workers with disabilities have gotten hit particularly hard.
- In April, unemployment was 17.6% among workers age 16–24, 8.0% among workers age 25–54, and 6.5% among workers age 55+ (up 5.9, 3.9, and 3.3 percentage points, respectively, since the start of the recession in December 2007).
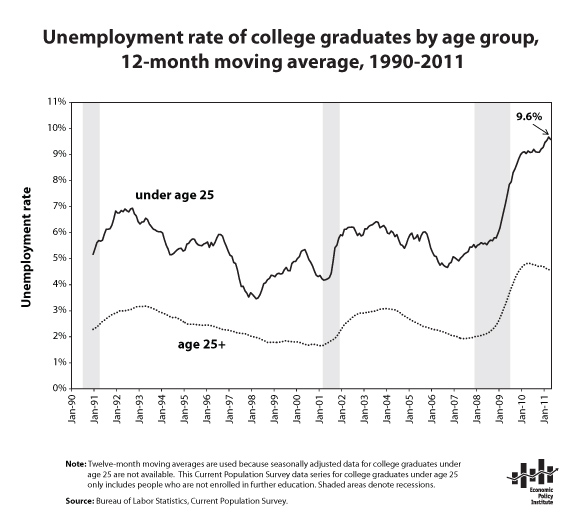
- Among workers younger than age 25 who are not enrolled in school, unemployment over the last year averaged 21.8% for those with a high school degree and 9.6% for those with a college degree (reflecting increases of 9.8 and 4.2 percentage points, respectively, since 2007). The figure shows the unemployment rate for college graduates by age group. There is not close to enough demand even for workers fresh out of college. See the recent EPI report, The Class of 2011, for more information about the plight of today’s young workers.
- Among workers age 25 or older, unemployment in April was 9.7% for workers with a high school education and 4.5% for those with a college degree (up 5.0 and 2.4 percentage points, respectively, since the start of the recession in December 2007).
- Unemployment in April was 16.1% for African American workers, 11.8% for Hispanic workers, and 8.0% for non-Hispanic white workers (up 7.1, 5.5, and 3.6 percentage points, respectively, since the start of the recession in December 2007).
- Unemployment was 9.4% for men, compared with 8.4% for women (up 4.3 and 3.5 percentage points, respectively, since the start of the recession in December 2007).
- Workers with a disability had an unemployment rate of 14.5% in April on a not-seasonally adjusted basis, compared with 8.4% for workers without a disability (up 1.6 and 0.0 percentage points, respectively, since April 2009). (April 2009 is the earliest April for which data are available. Data on labor market outcomes by disability status are available back to the summer of 2008.)
The labor force, unemployment, and the employment-to-population ratio
The labor force participation rate held steady at 64.2% in April, still at its lowest point of the recession. Despite payroll job growth over the last year, the labor force is still smaller than it was a year ago (by more than a million workers), though the working-age population grew by 1.9 million in that time. Consequently, the proportion of the population in the labor force is now 0.9 percentage points below where it was a year ago. If the labor force participation rate had held steady over the last year, there would be roughly 2.3 million more workers in the labor force right now. Instead, they are on the sidelines. If these workers were in the labor force and were unemployed, the unemployment rate would be 10.3% right now instead of 9.0%. In other words, the improvement in the unemployment rate over the last year (from 9.8% to 9.0%) is due to would-be workers deciding to sit out.
Some have claimed that these missing workers are never coming back, but it is far too soon to draw conclusions on that front. There remain 4.4 unemployed workers per available job — far worse than the worst month of the early-2000s recession. In this environment, where the chances of an unemployed worker finding a job are extremely low, the fact that the sidelined workers are not yet reentering in search of work is no surprise.
At a time like this, with the labor force not growing at a steady pace, we should turn to measures other than the unemployment rate to get a sense of how the labor market is evolving. The most basic measure is the employment-to-population ratio, which is simply the share of the working age population that has a job. This measure ticked down slightly in April, from 58.5% to 58.4%. Over the last year, it declined three-tenths of a percentage point, from 58.7% to 58.4%.
Employers not ramping up hours, and earnings fairly flat
The length of the average workweek held steady in April at 34.3 hours. The measure of average hours has seen net growth of only two-tenths of an hour over the last year, and has thus far made up just two-thirds of what it lost in the first 18 months of the downturn (its low point was 33.7 in June 2009). The fact that hours are still far below where they were before the recession started explodes the claim that businesses aren’t hiring right now for reasons other than a lack of demand. If businesses had work to be done but weren’t hiring new workers — either because they couldn’t find workers with the right skills or because they were wary of the potential burdens of laws like health care or regulatory reform — they would strongly ramp up the hours of the workers they have, which isn’t happening.
Average hourly wages were relatively flat in April (+3 cents), and have grown at a 1.6% annualized rate over the last three months and a 1.9% rate over the last year, which is far below the wage growth rate in the period before the recession started. Given that hours and wages were fairly flat, weekly wages were only up slightly in April, by $1.03.
Long-term unemployment still highest on record outside of the current downturn
The share of unemployed workers who have been unemployed for more than six months decreased in April, from 45.5% to 43.4%, as the increase in unemployment in April occurred among people who have been unemployed less than five weeks. However, there remain 5.8 million workers who have been unemployed for l
onger than six months, and the long-term share is still the far highest on record outside of the current downturn. This is unsurprising given the length and severity of the Great Recession compared with prior recessions.
Industry breakdowns show some sectors gaining less than others
The public sector again displayed the ongoing drag of state and local budget problems, with state government employment losing 8,000 jobs and local government employment dropping by 14,000. Over the last six months, state and local governments have shed an average of 24,000 jobs per month, and since their employment peak in August 2008, state and local governments have shed nearly half a million jobs.
The private sector added 268,000 jobs in April. Of these gains, 224,000 were in private service-providing industries and 44,000 were in goods-producing industries. Manufacturing gained 29,000 jobs, another month of positive news but not as strong as the 37,000 average of the prior three months. Construction added 5,000 in April, in line with the 7,000 average gain of the prior three months.
Temporary help services jobs dropped by 2,000, compared with a 15,000 average gain over the prior three months, not a promising sign. Restaurants and bars saw increased employment in April (gaining 27,000 jobs), in line with the sector’s 24,000 average monthly gain over the prior three months. Retail trade was a particular bright spot, increasing by 57,000 in April, compared with a 9,000 average monthly increase over the prior three months. Health care added 37,000 jobs, also an increase over the 25,000 jobs it added on average in the prior three months.
Measure of underemployment deteriorates
The underemployment rate (i.e., the U-6 measure of labor underutilization) is a more comprehensive measure of labor market slack than the unemployment rate because it includes not just the officially unemployed but also jobless workers who have given up looking for work and people who want full-time jobs but have had to settle for part-time work. (Note, however, it does not include people who are underemployed in the sense that they have had to take a job that is below their skills, training, or experience level.) This measure deteriorated in April, to 15.9%, due to a decline in the number of employed (-190,000), an increase in the number of unemployed (+205,000), and an increase in the number of involuntary-part-timers (+167,000). In April there were a total of 24.8 million workers who were either unemployed or underemployed.
Conclusion
In April, the labor market added 244,000 payroll jobs, the third month of job growth exceeding 220,000. However, the labor market remains 7.0 million payroll jobs below where it was at the official start of the recession three years and four months ago. Furthermore, this number hugely understates the size of the gap in the labor market by failing to take into account the fact that simply keeping up with the growth in the working-age population would have required the addition of another 4 million jobs over this period. This means the labor market is now 11.0 million jobs below the level needed to restore the prerecession unemployment rate (5.0% in December 2007). The U.S. workforce needs the current pace of job growth to accelerate further in order to reestablish full employment within any reasonable timeframe.
Nicholas Finio and Andrew Green provided research assistance.