
Two main themes for 2023 and beyond
- The “soft landing”
- So what?
- How?
- Will “secular stagnation” return?
- From (at least) 2000–2019, main macroeconomic problem in the U.S. was a chronic shortfall of aggregate demand relative to economy’s capacity to produce.
- That’s not a problem in 2022–2023
- What does future look like? Pre- or post-COVID state of macro balance?
Being a little more precise about what “soft landing” means
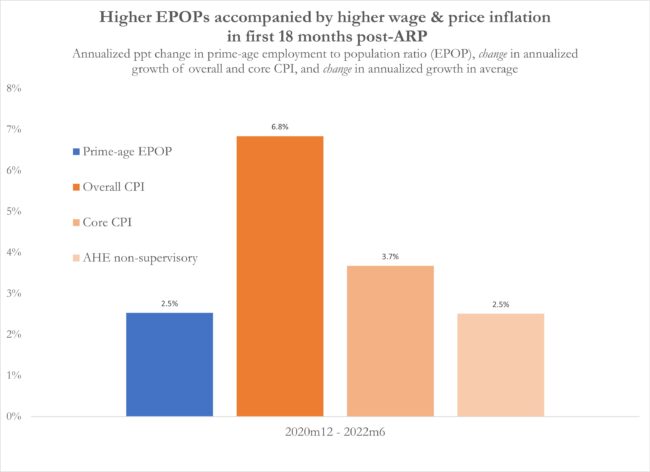
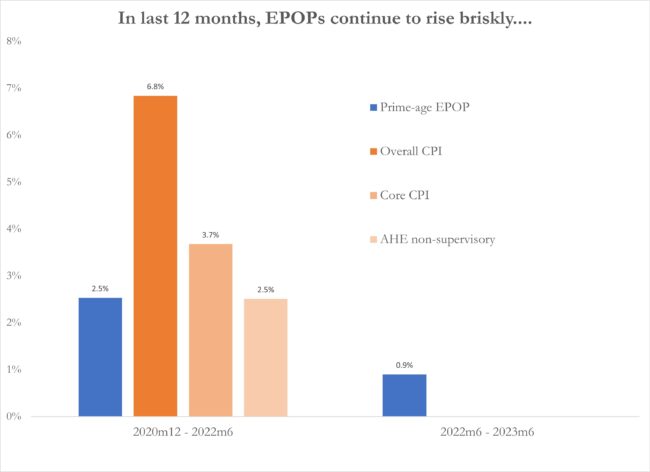
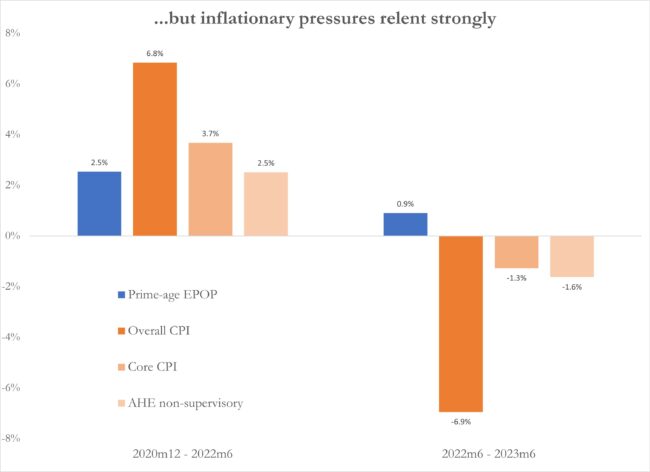
Soft landing: So what?
- Substantively (the obvious one):
- Low unemployment is really good – even better than we think
- Inflation spikes (particularly coming from outside the labor market) are bad
- Intellectually:
- Mainstream macro’s inflation theories are very limited – and of nearly no use during extremely unusual times like the past few years
- Inflationary episode key tool for those who will argue against aggressive fiscal response to future recessions. The aggressive fiscal response to COVID-19’s economic shock was incredibly good and useful – a huge win for human welfare. We shouldn’t let this lesson be forgotten
Soft landing: How?
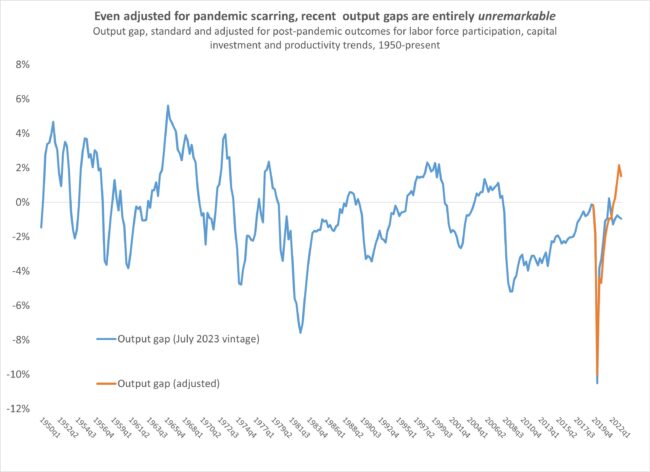
- Inflation was not driven by large and persistent excess of demand over the economy’s productive capacity – this really would’ve required macroeconomic contraction to fight
- Inflationary was driven instead by temporary shocks and associated ripples. It was (yes) transitory
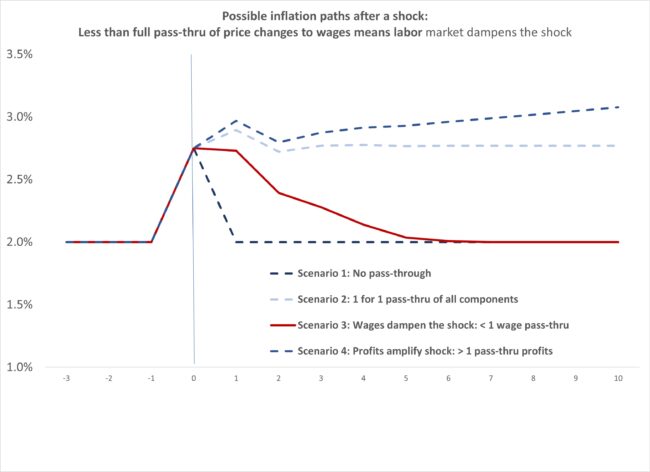
- It took far longer for ripples to fade than some predicted because the shocks kept coming and (most importantly and surprisingly) nominal wage growth did move up in response to non-labor price shocks
- To be totally clear: Wage growth did not cause inflation (shocks did), wage growth was never fast enough to avoid real wage declines for most workers, wage growth lagging behind non-labor price growth meant that wages were muffling, not amplifying, inflationary shock – pulling it all back towards normal
- But, nominal wage growth did perk up in response to non-labor price shocks. This made inflation a bit wider-spread and more-persistent than many predicted, and, it was a very good thing – it protected the real incomes of workers from the non-labor price shocks to a much-greater degree
Level of excess demand doesn’t seem plausible as inflation driver
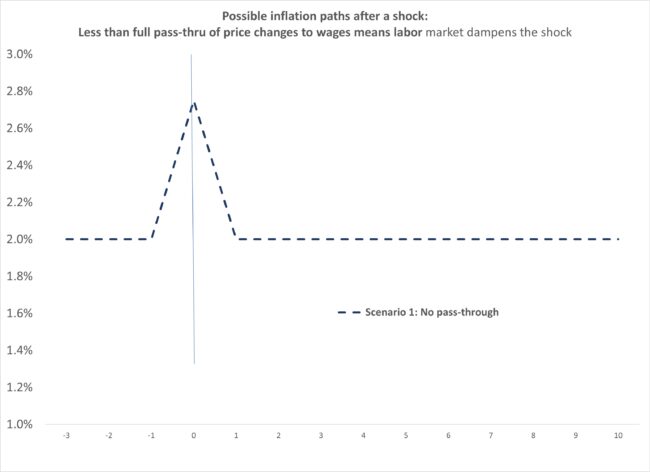
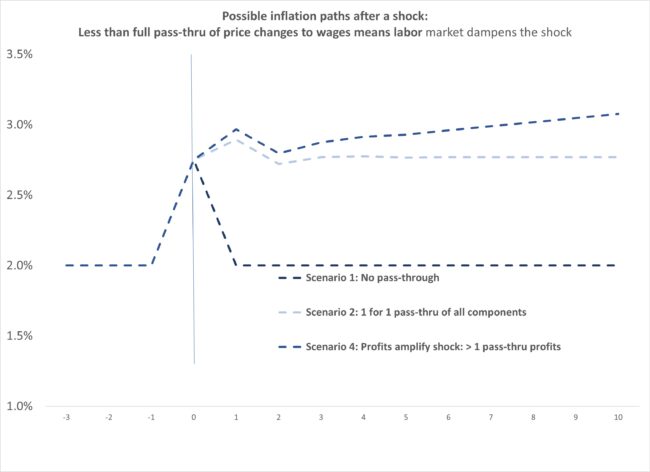
Various scenarios for “shocks and ripples”:
No nominal wage response to non-labor cost shock
Various scenarios for “shocks and ripples”:
1:1 or even 1>1 response of nominal wage growth to non-labor cost shock
Various scenarios for “shocks and ripples”:
Some nominal wage response, but <1:1 wage response (wage growth steadily dampens non-labor cost shock)
Soft landing: How?
- How did growth persist even with rapid interest rate hikes and fiscal consolidation?
- IIJA/IRA provided strength to exact sectors traditionally hobbled by rate hikes (business investment)
- “Dog that didn’t bark” (recession in 2023) likely due to these effects
Going forward?
- 2 big threats to soft landing
- Fed not taking “yes” for answer and/or lagged effects of past rate hikes
- Catastrophic fiscal showdown this fall?
- Key question: will “Secular Stagnation” return?
- Secular stagnation = chronic shortfall of demand.
- Reasons for optimism that it’s permanently banished
- Movement on inequality
- Prospects for stepped up investment driven by climate investments are pretty strong?
Ending secular stagnation does create challenges
- End of secular stagnation would be a huge win for economic prospects of working families
- But, it does make fiscal policy more contentious
- Era of zero interest rates and low inflation => deficits should be larger would be over
- Doesn’t mean cuts are good or ambitions for a better society (universal child care or something) should be curbed – it just means that they now need to be (mostly) paid for
- Figuring out how to get Americans to acquiesce to higher taxes moves much closer to center stage if secular stagnation returns
Federal fiscal relief at the scale of the problem led to a faster recovery from the pandemic recession: Private-sector employment change since business cycle peak, December 2007 and February 2020
| Months since peak | 2007 | 2020 |
|---|---|---|
| 1 | 100.0 | 100.0 |
| 2 | 100.0 | 98.9 |
| 3 | 99.9 | 83.8 |
| 4 | 99.8 | 86.3 |
| 5 | 99.6 | 89.8 |
| 6 | 99.4 | 91.0 |
| 7 | 99.3 | 91.8 |
| 8 | 99.1 | 92.6 |
| 9 | 98.8 | 93.2 |
| 10 | 98.5 | 93.5 |
| 11 | 98.0 | 93.4 |
| 12 | 97.4 | 93.6 |
| 13 | 96.8 | 94.0 |
| 14 | 96.1 | 94.6 |
| 15 | 95.5 | 94.8 |
| 16 | 94.8 | 95.1 |
| 17 | 94.1 | 95.7 |
| 18 | 93.8 | 96.3 |
| 19 | 93.5 | 96.7 |
| 20 | 93.2 | 97.1 |
| 21 | 93.0 | 97.8 |
| 22 | 92.9 | 98.2 |
| 23 | 92.7 | 98.7 |
| 24 | 92.7 | 98.9 |
| 25 | 92.5 | 99.5 |
| 26 | 92.5 | 99.9 |
| 27 | 92.4 | 100.1 |
| 28 | 92.5 | 100.3 |
| 29 | 92.7 | 100.6 |
| 30 | 92.8 | 101.0 |
| 31 | 92.9 | 101.2 |
| 32 | 93.0 | 101.4 |
| 33 | 93.1 | 101.7 |
| 34 | 93.2 | 101.9 |
| 35 | 93.4 | 102.0 |
| 36 | 93.5 | 102.2 |
| 37 | 93.6 | 102.4 |
| 38 | 93.6 | 102.4 |
| 39 | 93.8 | 102.6 |
| 40 | 94.0 | 102.7 |
| 41 | 94.3 | 102.8 |
| 42 | 94.4 | 102.9 |
| 43 | 94.6 | 103.0 |
| 44 | 94.8 | 103.1 |
| 45 | 94.9 | 103.2 |
| 46 | 95.1 | 103.2 |
| 47 | 95.3 | 103.4 |
| 48 | 95.4 | 103.4 |
| 49 | 95.6 | 103.6 |
| 50 | 95.9 | 103.7 |
| 51 | 96.2 | 103.8 |
| 52 | 96.4 | 103.9 |
| 53 | 96.4 | 104.0 |
| 54 | 96.6 | 104.0 |
| 55 | 96.6 | 104.0 |
| 56 | 96.7 | 104.2 |
| 57 | 96.9 | 104.2 |
| 58 | 97.0 | 104.4 |
| 59 | 97.2 | 104.6 |
| 60 | 97.3 | 104.7 |
| 61 | 97.6 | 104.7 |
| 62 | 97.7 | 104.9 |
| 63 | 98.0 | |
| 64 | 98.1 | |
| 65 | 98.3 | |
| 66 | 98.5 | |
| 67 | 98.6 | |
| 68 | 98.8 | |
| 69 | 99.0 | |
| 70 | 99.1 | |
| 71 | 99.3 | |
| 72 | 99.5 | |
| 73 | 99.6 | |
| 74 | 99.8 | |
| 75 | 99.9 | |
| 76 | 100.1 |
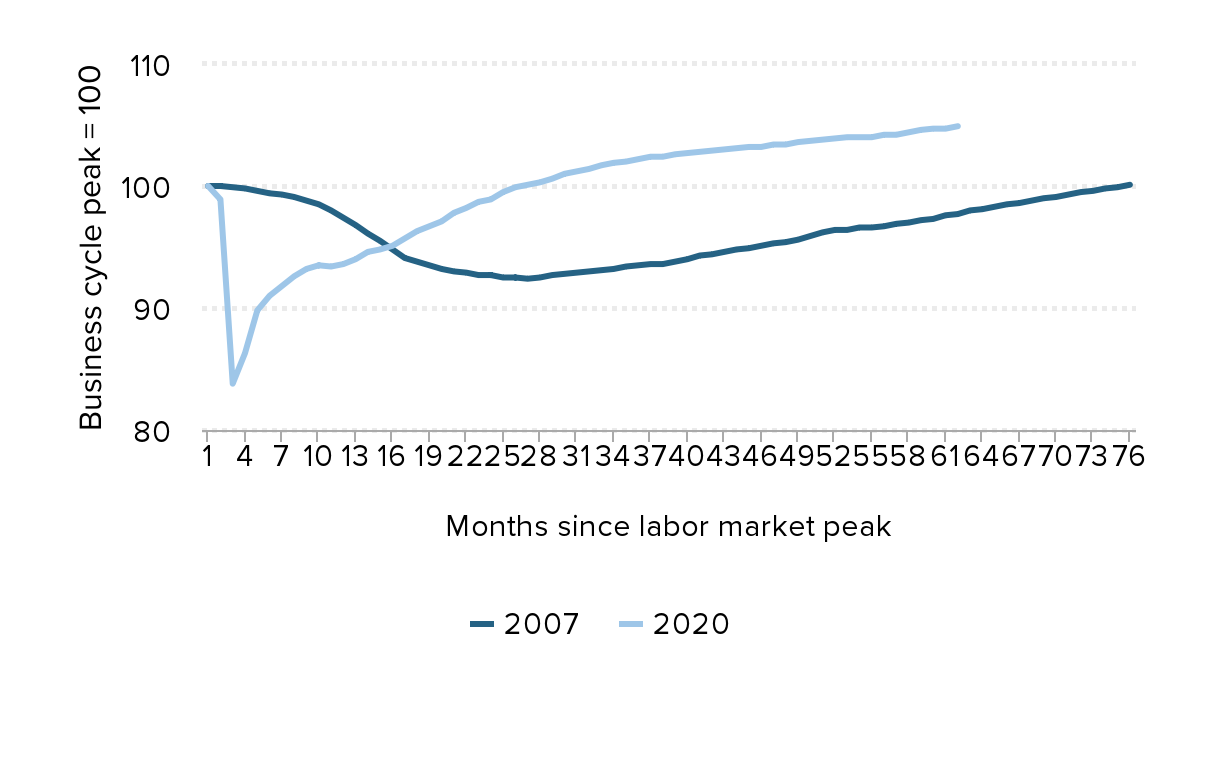
Source: EPI analysis of Bureau of Labor Statistics' Current Employment Statistics public data series.
Employment change by industry since February 2020: All employees (thousands), seasonally adjusted, March 2025
| Industry | Employment change since February 2020 |
|---|---|
| Health care | 1610 |
| Professional and business services | 1106 |
| Transportation and warehousing | 1006 |
| Social assistance | 750 |
| Construction | 703 |
| State/Local government | 612 |
| Financial activities | 374 |
| Wholesale trade | 284 |
| Educational services | 198 |
| Federal | 143 |
| Leisure and hospitality | 102 |
| Other services | 102 |
| Retail services | 76 |
| Utilities | 52 |
| Information | 29 |
| Manufacturing | 21 |
| Mining and logging | -61 |
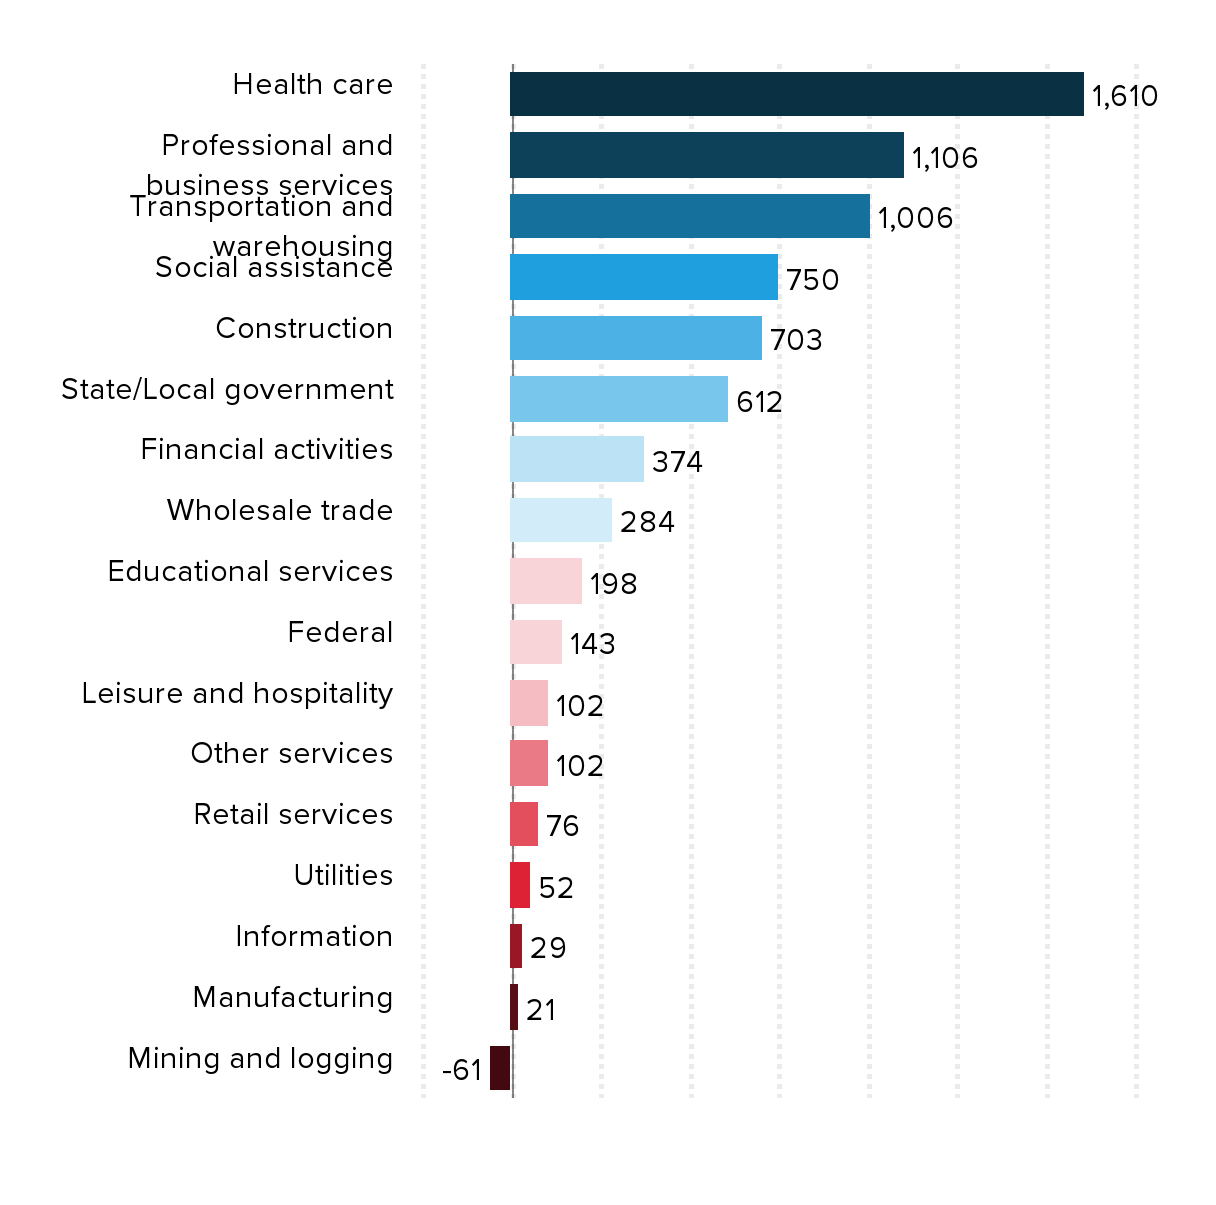
Source: Bureau of Labor Statistics' (BLS) Current Employment Statistics, Establishment Survey (CES) public data series.
Percent change in payrolls since February 2020, for all private and state and local government employment
| date | Total private-sector employment | State and local government employment |
|---|---|---|
| Feb-2020 | 0.0% | 0.0% |
| Mar-2020 | -1.1% | -0.2% |
| Apr-2020 | -16.2% | -4.8% |
| May-2020 | -13.7% | -7.4% |
| Jun-2020 | -10.2% | -7.4% |
| Jul-2020 | -9.0% | -7.0% |
| Aug-2020 | -8.2% | -5.8% |
| Sep-2020 | -7.4% | -6.0% |
| Oct-2020 | -6.8% | -5.9% |
| Nov-2020 | -6.5% | -6.0% |
| Dec-2020 | -6.6% | -6.1% |
| Jan-2021 | -6.4% | -5.5% |
| Feb-2021 | -6.0% | -5.6% |
| Mar-2021 | -5.4% | -5.1% |
| Apr-2021 | -5.2% | -4.9% |
| May-2021 | -4.9% | -4.9% |
| Jun-2021 | -4.3% | -4.4% |
| Jul-2021 | -3.7% | -4.2% |
| Aug-2021 | -3.3% | -3.9% |
| Sep-2021 | -2.9% | -4.0% |
| Oct-2021 | -2.2% | -4.2% |
| Nov-2021 | -1.8% | -4.2% |
| Dec-2021 | -1.3% | -4.0% |
| Jan-2022 | -1.1% | -4.1% |
| Feb-2022 | -0.5% | -4.2% |
| Mar-2022 | -0.1% | -4.1% |
| Apr-2022 | 0.1% | -3.9% |
| May-2022 | 0.3% | -3.8% |
| Jun-2022 | 0.6% | -3.6% |
| Jul-2022 | 1.0% | -2.9% |
| Aug-2022 | 1.2% | -3.0% |
| Sep-2022 | 1.4% | -2.9% |
| Oct-2022 | 1.7% | -2.8% |
| Nov-2022 | 1.9% | -2.5% |
| Dec-2022 | 2.0% | -2.5% |
| Jan-2023 | 2.2% | -2.0% |
| Feb-2023 | 2.4% | -1.7% |
| Mar-2023 | 2.4% | -1.6% |
| Apr-2023 | 2.6% | -1.4% |
| May-2023 | 2.7% | -1.1% |
| Jun-2023 | 2.8% | -0.7% |
| Jul-2023 | 2.9% | -0.5% |
| Aug-2023 | 3.0% | -0.4% |
| Sep-2023 | 3.1% | 0.0% |
| Oct-2023 | 3.2% | 0.3% |
| Nov-2023 | 3.2% | 0.5% |
| Dec-2023 | 3.4% | 0.7% |
| Jan-2024 | 3.4% | 0.9% |
| Feb-2024 | 3.6% | 1.2% |
| Mar-2024 | 3.7% | 1.5% |
| Apr-2024 | 3.8% | 1.5% |
| May-2024 | 3.9% | 1.6% |
| Jun-2024 | 4.0% | 1.7% |
| Jul-2024 | 4.0% | 2.0% |
| Aug-2024 | 4.0% | 2.1% |
| Sep-2024 | 4.2% | 2.3% |
| Oct-2024 | 4.2% | 2.5% |
| Nov-2024 | 4.4% | 2.6% |
| Dec-2024 | 4.6% | 2.7% |
| Jan-2025 | 4.7% | 2.9% |
| Feb-2025 | 4.7% | 2.9% |
| Mar-2025 | 4.9% | 3.1% |
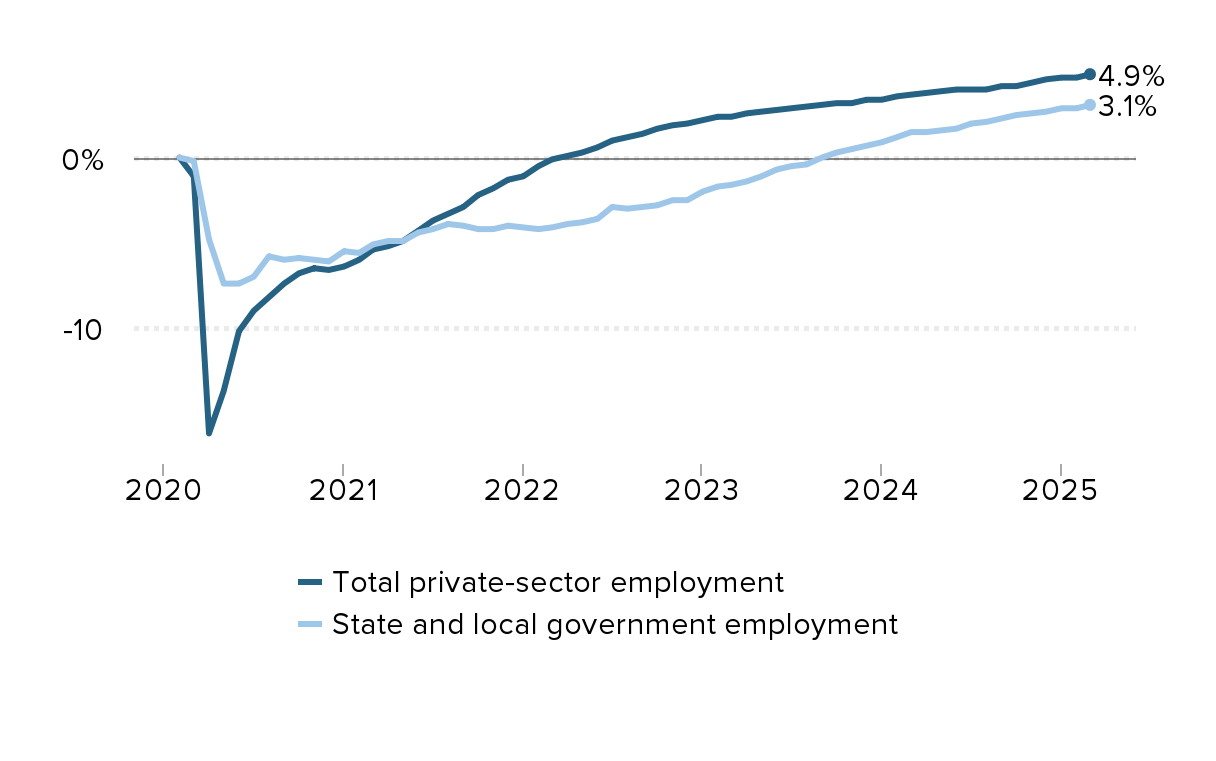
Source: Bureau of Labor Statistics' (BLS) Current Employment Statistics, Establishment Survey (CES) public data series.
Employment-to-population ratio of workers ages 25–54, 1989–2025
| date | Employment to population ratio |
|---|---|
| Jan-1989 | 80.0% |
| Feb-1989 | 79.9% |
| Mar-1989 | 79.9% |
| Apr-1989 | 79.8% |
| May-1989 | 79.8% |
| Jun-1989 | 79.8% |
| Jul-1989 | 79.8% |
| Aug-1989 | 79.9% |
| Sep-1989 | 80.0% |
| Oct-1989 | 79.9% |
| Nov-1989 | 80.2% |
| Dec-1989 | 80.1% |
| Jan-1990 | 80.2% |
| Feb-1990 | 80.2% |
| Mar-1990 | 80.1% |
| Apr-1990 | 79.9% |
| May-1990 | 79.9% |
| Jun-1990 | 79.8% |
| Jul-1990 | 79.6% |
| Aug-1990 | 79.5% |
| Sep-1990 | 79.4% |
| Oct-1990 | 79.4% |
| Nov-1990 | 79.2% |
| Dec-1990 | 79.0% |
| Jan-1991 | 78.9% |
| Feb-1991 | 78.9% |
| Mar-1991 | 78.7% |
| Apr-1991 | 79.0% |
| May-1991 | 78.6% |
| Jun-1991 | 78.7% |
| Jul-1991 | 78.6% |
| Aug-1991 | 78.5% |
| Sep-1991 | 78.6% |
| Oct-1991 | 78.5% |
| Nov-1991 | 78.4% |
| Dec-1991 | 78.3% |
| Jan-1992 | 78.4% |
| Feb-1992 | 78.2% |
| Mar-1992 | 78.2% |
| Apr-1992 | 78.4% |
| May-1992 | 78.4% |
| Jun-1992 | 78.5% |
| Jul-1992 | 78.4% |
| Aug-1992 | 78.4% |
| Sep-1992 | 78.3% |
| Oct-1992 | 78.2% |
| Nov-1992 | 78.2% |
| Dec-1992 | 78.2% |
| Jan-1993 | 78.2% |
| Feb-1993 | 78.1% |
| Mar-1993 | 78.2% |
| Apr-1993 | 78.2% |
| May-1993 | 78.5% |
| Jun-1993 | 78.6% |
| Jul-1993 | 78.6% |
| Aug-1993 | 78.8% |
| Sep-1993 | 78.6% |
| Oct-1993 | 78.7% |
| Nov-1993 | 79.0% |
| Dec-1993 | 79.0% |
| Jan-1994 | 78.9% |
| Feb-1994 | 78.9% |
| Mar-1994 | 78.9% |
| Apr-1994 | 79.0% |
| May-1994 | 79.2% |
| Jun-1994 | 78.8% |
| Jul-1994 | 79.1% |
| Aug-1994 | 79.2% |
| Sep-1994 | 79.6% |
| Oct-1994 | 79.6% |
| Nov-1994 | 79.8% |
| Dec-1994 | 79.8% |
| Jan-1995 | 79.7% |
| Feb-1995 | 80.0% |
| Mar-1995 | 79.9% |
| Apr-1995 | 79.8% |
| May-1995 | 79.7% |
| Jun-1995 | 79.5% |
| Jul-1995 | 79.7% |
| Aug-1995 | 79.6% |
| Sep-1995 | 79.8% |
| Oct-1995 | 79.8% |
| Nov-1995 | 79.7% |
| Dec-1995 | 79.7% |
| Jan-1996 | 79.8% |
| Feb-1996 | 79.9% |
| Mar-1996 | 79.9% |
| Apr-1996 | 79.9% |
| May-1996 | 80.0% |
| Jun-1996 | 80.1% |
| Jul-1996 | 80.4% |
| Aug-1996 | 80.5% |
| Sep-1996 | 80.4% |
| Oct-1996 | 80.6% |
| Nov-1996 | 80.5% |
| Dec-1996 | 80.5% |
| Jan-1997 | 80.5% |
| Feb-1997 | 80.4% |
| Mar-1997 | 80.6% |
| Apr-1997 | 80.7% |
| May-1997 | 80.6% |
| Jun-1997 | 80.9% |
| Jul-1997 | 81.1% |
| Aug-1997 | 81.3% |
| Sep-1997 | 81.1% |
| Oct-1997 | 81.1% |
| Nov-1997 | 81.0% |
| Dec-1997 | 81.0% |
| Jan-1998 | 81.0% |
| Feb-1998 | 81.0% |
| Mar-1998 | 81.0% |
| Apr-1998 | 81.1% |
| May-1998 | 81.0% |
| Jun-1998 | 81.0% |
| Jul-1998 | 81.1% |
| Aug-1998 | 81.2% |
| Sep-1998 | 81.3% |
| Oct-1998 | 81.1% |
| Nov-1998 | 81.2% |
| Dec-1998 | 81.3% |
| Jan-1999 | 81.8% |
| Feb-1999 | 81.5% |
| Mar-1999 | 81.3% |
| Apr-1999 | 81.3% |
| May-1999 | 81.4% |
| Jun-1999 | 81.4% |
| Jul-1999 | 81.2% |
| Aug-1999 | 81.3% |
| Sep-1999 | 81.3% |
| Oct-1999 | 81.5% |
| Nov-1999 | 81.6% |
| Dec-1999 | 81.5% |
| Jan-2000 | 81.8% |
| Feb-2000 | 81.8% |
| Mar-2000 | 81.7% |
| Apr-2000 | 81.9% |
| May-2000 | 81.5% |
| Jun-2000 | 81.5% |
| Jul-2000 | 81.3% |
| Aug-2000 | 81.1% |
| Sep-2000 | 81.1% |
| Oct-2000 | 81.1% |
| Nov-2000 | 81.3% |
| Dec-2000 | 81.4% |
| Jan-2001 | 81.4% |
| Feb-2001 | 81.3% |
| Mar-2001 | 81.3% |
| Apr-2001 | 80.9% |
| May-2001 | 80.8% |
| Jun-2001 | 80.6% |
| Jul-2001 | 80.5% |
| Aug-2001 | 80.2% |
| Sep-2001 | 80.2% |
| Oct-2001 | 79.9% |
| Nov-2001 | 79.7% |
| Dec-2001 | 79.8% |
| Jan-2002 | 79.6% |
| Feb-2002 | 79.8% |
| Mar-2002 | 79.6% |
| Apr-2002 | 79.5% |
| May-2002 | 79.4% |
| Jun-2002 | 79.2% |
| Jul-2002 | 79.1% |
| Aug-2002 | 79.3% |
| Sep-2002 | 79.4% |
| Oct-2002 | 79.2% |
| Nov-2002 | 78.8% |
| Dec-2002 | 79.0% |
| Jan-2003 | 78.9% |
| Feb-2003 | 78.9% |
| Mar-2003 | 79.0% |
| Apr-2003 | 79.1% |
| May-2003 | 78.9% |
| Jun-2003 | 78.9% |
| Jul-2003 | 78.8% |
| Aug-2003 | 78.7% |
| Sep-2003 | 78.6% |
| Oct-2003 | 78.6% |
| Nov-2003 | 78.7% |
| Dec-2003 | 78.8% |
| Jan-2004 | 78.9% |
| Feb-2004 | 78.8% |
| Mar-2004 | 78.7% |
| Apr-2004 | 78.9% |
| May-2004 | 79.0% |
| Jun-2004 | 79.1% |
| Jul-2004 | 79.2% |
| Aug-2004 | 79.0% |
| Sep-2004 | 79.0% |
| Oct-2004 | 79.0% |
| Nov-2004 | 79.1% |
| Dec-2004 | 78.9% |
| Jan-2005 | 79.2% |
| Feb-2005 | 79.2% |
| Mar-2005 | 79.2% |
| Apr-2005 | 79.4% |
| May-2005 | 79.5% |
| Jun-2005 | 79.2% |
| Jul-2005 | 79.4% |
| Aug-2005 | 79.6% |
| Sep-2005 | 79.4% |
| Oct-2005 | 79.3% |
| Nov-2005 | 79.2% |
| Dec-2005 | 79.3% |
| Jan-2006 | 79.6% |
| Feb-2006 | 79.7% |
| Mar-2006 | 79.8% |
| Apr-2006 | 79.6% |
| May-2006 | 79.7% |
| Jun-2006 | 79.8% |
| Jul-2006 | 79.8% |
| Aug-2006 | 79.8% |
| Sep-2006 | 79.9% |
| Oct-2006 | 80.1% |
| Nov-2006 | 80.0% |
| Dec-2006 | 80.1% |
| Jan-2007 | 80.3% |
| Feb-2007 | 80.1% |
| Mar-2007 | 80.2% |
| Apr-2007 | 80.0% |
| May-2007 | 80.0% |
| Jun-2007 | 79.9% |
| Jul-2007 | 79.8% |
| Aug-2007 | 79.8% |
| Sep-2007 | 79.7% |
| Oct-2007 | 79.6% |
| Nov-2007 | 79.7% |
| Dec-2007 | 79.7% |
| Jan-2008 | 80.0% |
| Feb-2008 | 79.9% |
| Mar-2008 | 79.8% |
| Apr-2008 | 79.6% |
| May-2008 | 79.5% |
| Jun-2008 | 79.4% |
| Jul-2008 | 79.2% |
| Aug-2008 | 78.8% |
| Sep-2008 | 78.8% |
| Oct-2008 | 78.4% |
| Nov-2008 | 78.1% |
| Dec-2008 | 77.6% |
| Jan-2009 | 77.0% |
| Feb-2009 | 76.7% |
| Mar-2009 | 76.2% |
| Apr-2009 | 76.2% |
| May-2009 | 75.9% |
| Jun-2009 | 75.9% |
| Jul-2009 | 75.8% |
| Aug-2009 | 75.6% |
| Sep-2009 | 75.1% |
| Oct-2009 | 75.0% |
| Nov-2009 | 75.2% |
| Dec-2009 | 74.8% |
| Jan-2010 | 75.1% |
| Feb-2010 | 75.1% |
| Mar-2010 | 75.1% |
| Apr-2010 | 75.4% |
| May-2010 | 75.1% |
| Jun-2010 | 75.2% |
| Jul-2010 | 75.1% |
| Aug-2010 | 75.0% |
| Sep-2010 | 75.1% |
| Oct-2010 | 75.0% |
| Nov-2010 | 74.8% |
| Dec-2010 | 75.0% |
| Jan-2011 | 75.2% |
| Feb-2011 | 75.1% |
| Mar-2011 | 75.3% |
| Apr-2011 | 75.1% |
| May-2011 | 75.2% |
| Jun-2011 | 75.0% |
| Jul-2011 | 75.0% |
| Aug-2011 | 75.1% |
| Sep-2011 | 74.9% |
| Oct-2011 | 74.9% |
| Nov-2011 | 75.3% |
| Dec-2011 | 75.4% |
| Jan-2012 | 75.5% |
| Feb-2012 | 75.5% |
| Mar-2012 | 75.7% |
| Apr-2012 | 75.7% |
| May-2012 | 75.7% |
| Jun-2012 | 75.6% |
| Jul-2012 | 75.6% |
| Aug-2012 | 75.7% |
| Sep-2012 | 76.0% |
| Oct-2012 | 76.1% |
| Nov-2012 | 75.8% |
| Dec-2012 | 76.0% |
| Jan-2013 | 75.6% |
| Feb-2013 | 75.8% |
| Mar-2013 | 75.8% |
| Apr-2013 | 75.8% |
| May-2013 | 76.0% |
| Jun-2013 | 75.9% |
| Jul-2013 | 76.0% |
| Aug-2013 | 76.0% |
| Sep-2013 | 76.0% |
| Oct-2013 | 75.6% |
| Nov-2013 | 76.1% |
| Dec-2013 | 76.1% |
| Jan-2014 | 76.4% |
| Feb-2014 | 76.4% |
| Mar-2014 | 76.5% |
| Apr-2014 | 76.5% |
| May-2014 | 76.4% |
| Jun-2014 | 76.9% |
| Jul-2014 | 76.7% |
| Aug-2014 | 76.9% |
| Sep-2014 | 76.8% |
| Oct-2014 | 76.9% |
| Nov-2014 | 76.9% |
| Dec-2014 | 77.1% |
| Jan-2015 | 77.1% |
| Feb-2015 | 77.2% |
| Mar-2015 | 77.1% |
| Apr-2015 | 77.2% |
| May-2015 | 77.2% |
| Jun-2015 | 77.4% |
| Jul-2015 | 77.1% |
| Aug-2015 | 77.3% |
| Sep-2015 | 77.2% |
| Oct-2015 | 77.2% |
| Nov-2015 | 77.4% |
| Dec-2015 | 77.4% |
| Jan-2016 | 77.7% |
| Feb-2016 | 77.8% |
| Mar-2016 | 77.9% |
| Apr-2016 | 77.8% |
| May-2016 | 77.9% |
| Jun-2016 | 77.9% |
| Jul-2016 | 78.0% |
| Aug-2016 | 77.9% |
| Sep-2016 | 78.0% |
| Oct-2016 | 78.1% |
| Nov-2016 | 78.1% |
| Dec-2016 | 78.1% |
| Jan-2017 | 78.2% |
| Feb-2017 | 78.3% |
| Mar-2017 | 78.5% |
| Apr-2017 | 78.6% |
| May-2017 | 78.5% |
| Jun-2017 | 78.6% |
| Jul-2017 | 78.8% |
| Aug-2017 | 78.4% |
| Sep-2017 | 79.0% |
| Oct-2017 | 78.7% |
| Nov-2017 | 78.9% |
| Dec-2017 | 79.0% |
| Jan-2018 | 78.9% |
| Feb-2018 | 79.3% |
| Mar-2018 | 79.2% |
| Apr-2018 | 79.2% |
| May-2018 | 79.3% |
| Jun-2018 | 79.4% |
| Jul-2018 | 79.6% |
| Aug-2018 | 79.3% |
| Sep-2018 | 79.4% |
| Oct-2018 | 79.6% |
| Nov-2018 | 79.6% |
| Dec-2018 | 79.5% |
| Jan-2019 | 79.8% |
| Feb-2019 | 79.9% |
| Mar-2019 | 79.8% |
| Apr-2019 | 79.7% |
| May-2019 | 79.7% |
| Jun-2019 | 79.7% |
| Jul-2019 | 79.6% |
| Aug-2019 | 80.0% |
| Sep-2019 | 80.2% |
| Oct-2019 | 80.3% |
| Nov-2019 | 80.3% |
| Dec-2019 | 80.4% |
| Jan-2020 | 80.6% |
| Feb-2020 | 80.5% |
| Mar-2020 | 79.5% |
| Apr-2020 | 69.6% |
| May-2020 | 71.4% |
| Jun-2020 | 73.5% |
| Jul-2020 | 73.8% |
| Aug-2020 | 75.2% |
| Sep-2020 | 75.1% |
| Oct-2020 | 76.1% |
| Nov-2020 | 76.0% |
| Dec-2020 | 76.3% |
| Jan-2021 | 76.4% |
| Feb-2021 | 76.6% |
| Mar-2021 | 76.8% |
| Apr-2021 | 76.9% |
| May-2021 | 77.1% |
| Jun-2021 | 77.2% |
| Jul-2021 | 77.8% |
| Aug-2021 | 77.9% |
| Sep-2021 | 78.0% |
| Oct-2021 | 78.4% |
| Nov-2021 | 78.9% |
| Dec-2021 | 79.2% |
| Jan-2022 | 79.2% |
| Feb-2022 | 79.5% |
| Mar-2022 | 80.0% |
| Apr-2022 | 79.9% |
| May-2022 | 80.0% |
| Jun-2022 | 79.8% |
| Jul-2022 | 79.9% |
| Aug-2022 | 80.2% |
| Sep-2022 | 80.2% |
| Oct-2022 | 79.9% |
| Nov-2022 | 79.8% |
| Dec-2022 | 80.1% |
| Jan-2023 | 80.3% |
| Feb-2023 | 80.5% |
| Mar-2023 | 80.7% |
| Apr-2023 | 80.7% |
| May-2023 | 80.7% |
| Jun-2023 | 80.9% |
| Jul-2023 | 80.9% |
| Aug-2023 | 80.8% |
| Sep-2023 | 80.8% |
| Oct-2023 | 80.6% |
| Nov-2023 | 80.7% |
| Dec-2023 | 80.4% |
| Jan-2024 | 80.6% |
| Feb-2024 | 80.7% |
| Mar-2024 | 80.7% |
| Apr-2024 | 80.8% |
| May-2024 | 80.8% |
| Jun-2024 | 80.7% |
| Jul-2024 | 80.9% |
| Aug-2024 | 80.9% |
| Sep-2024 | 80.9% |
| Oct-2024 | 80.6% |
| Nov-2024 | 80.4% |
| Dec-2024 | 80.5% |
| Jan-2025 | 80.7% |
| Feb-2025 | 80.5% |
| Mar-2025 | 80.4% |
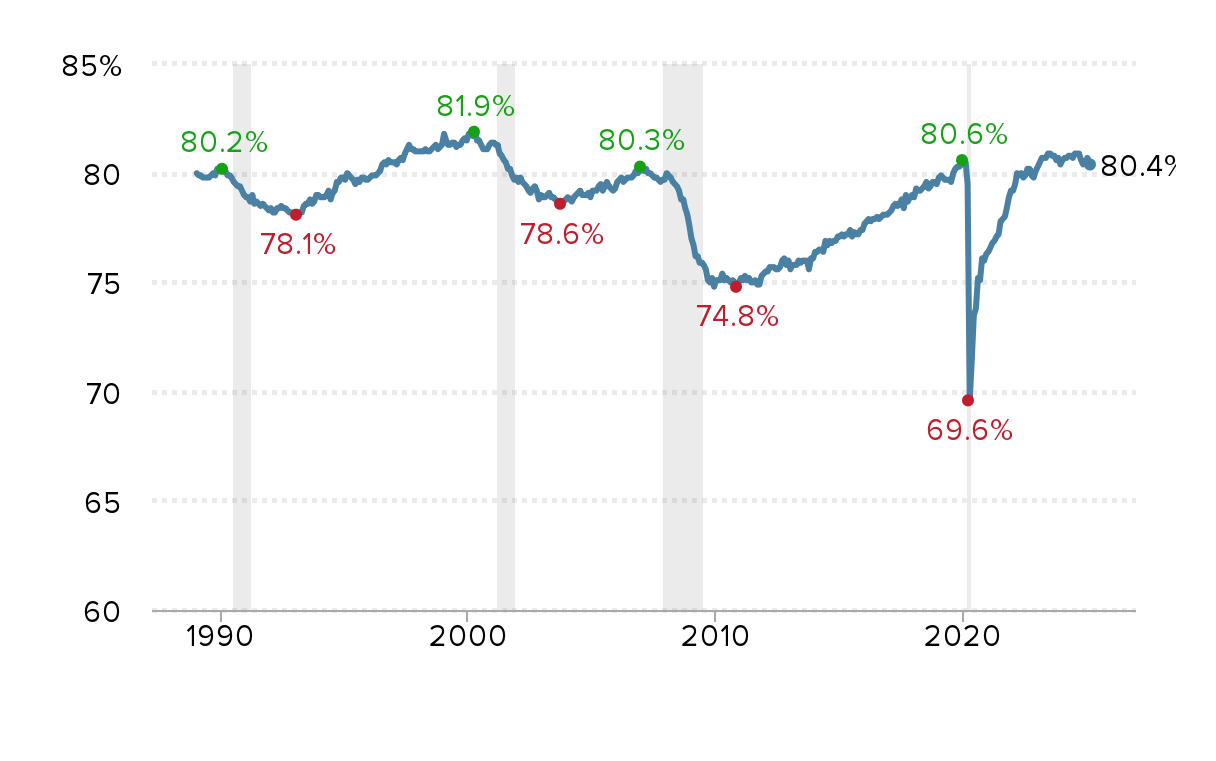
Source: EPI analysis of Bureau of Labor Statistics’ Current Population Survey public data.
Employment-to-population ratio of workers ages 25–54, by gender, 1989–2025
| Date | Men | Women |
|---|---|---|
| Jan-1989 | 89.9% | 70.5% |
| Feb-1989 | 89.8% | 70.4% |
| Mar-1989 | 89.9% | 70.2% |
| Apr-1989 | 89.7% | 70.3% |
| May-1989 | 89.8% | 70.1% |
| Jun-1989 | 90.0% | 70.1% |
| Jul-1989 | 89.9% | 70.0% |
| Aug-1989 | 90.0% | 70.2% |
| Sep-1989 | 89.7% | 70.7% |
| Oct-1989 | 89.8% | 70.5% |
| Nov-1989 | 89.9% | 70.8% |
| Dec-1989 | 90.0% | 70.7% |
| Jan-1990 | 89.9% | 70.9% |
| Feb-1990 | 90.1% | 70.8% |
| Mar-1990 | 89.8% | 70.8% |
| Apr-1990 | 89.4% | 70.7% |
| May-1990 | 89.3% | 70.8% |
| Jun-1990 | 89.3% | 70.6% |
| Jul-1990 | 89.0% | 70.6% |
| Aug-1990 | 88.9% | 70.5% |
| Sep-1990 | 88.7% | 70.5% |
| Oct-1990 | 88.6% | 70.4% |
| Nov-1990 | 88.5% | 70.2% |
| Dec-1990 | 88.1% | 70.1% |
| Jan-1991 | 88.2% | 69.9% |
| Feb-1991 | 88.0% | 70.1% |
| Mar-1991 | 87.7% | 70.0% |
| Apr-1991 | 87.9% | 70.3% |
| May-1991 | 87.4% | 70.1% |
| Jun-1991 | 87.5% | 70.2% |
| Jul-1991 | 87.5% | 70.1% |
| Aug-1991 | 87.4% | 70.0% |
| Sep-1991 | 87.5% | 70.1% |
| Oct-1991 | 87.2% | 70.0% |
| Nov-1991 | 87.1% | 70.0% |
| Dec-1991 | 86.9% | 69.9% |
| Jan-1992 | 86.9% | 70.1% |
| Feb-1992 | 86.6% | 70.0% |
| Mar-1992 | 86.8% | 70.0% |
| Apr-1992 | 86.9% | 70.2% |
| May-1992 | 86.8% | 70.3% |
| Jun-1992 | 86.9% | 70.3% |
| Jul-1992 | 86.9% | 70.2% |
| Aug-1992 | 86.9% | 70.2% |
| Sep-1992 | 86.8% | 70.1% |
| Oct-1992 | 86.7% | 70.0% |
| Nov-1992 | 86.6% | 70.1% |
| Dec-1992 | 86.7% | 69.9% |
| Jan-1993 | 86.8% | 69.9% |
| Feb-1993 | 86.7% | 69.9% |
| Mar-1993 | 86.5% | 70.3% |
| Apr-1993 | 86.8% | 69.9% |
| May-1993 | 87.0% | 70.2% |
| Jun-1993 | 87.1% | 70.4% |
| Jul-1993 | 87.1% | 70.4% |
| Aug-1993 | 87.2% | 70.6% |
| Sep-1993 | 87.1% | 70.5% |
| Oct-1993 | 87.1% | 70.5% |
| Nov-1993 | 87.5% | 70.7% |
| Dec-1993 | 87.4% | 71.0% |
| Jan-1994 | 87.1% | 71.0% |
| Feb-1994 | 86.8% | 71.3% |
| Mar-1994 | 87.0% | 71.1% |
| Apr-1994 | 87.1% | 71.2% |
| May-1994 | 87.3% | 71.3% |
| Jun-1994 | 87.0% | 70.9% |
| Jul-1994 | 87.0% | 71.4% |
| Aug-1994 | 87.0% | 71.7% |
| Sep-1994 | 87.4% | 72.1% |
| Oct-1994 | 87.5% | 71.9% |
| Nov-1994 | 87.9% | 72.0% |
| Dec-1994 | 88.0% | 71.8% |
| Jan-1995 | 87.9% | 71.8% |
| Feb-1995 | 88.1% | 72.2% |
| Mar-1995 | 87.9% | 72.1% |
| Apr-1995 | 87.7% | 72.2% |
| May-1995 | 87.6% | 72.1% |
| Jun-1995 | 87.6% | 71.7% |
| Jul-1995 | 87.5% | 72.2% |
| Aug-1995 | 87.4% | 72.1% |
| Sep-1995 | 87.6% | 72.3% |
| Oct-1995 | 87.6% | 72.3% |
| Nov-1995 | 87.2% | 72.6% |
| Dec-1995 | 87.2% | 72.4% |
| Jan-1996 | 87.5% | 72.4% |
| Feb-1996 | 87.7% | 72.4% |
| Mar-1996 | 87.5% | 72.6% |
| Apr-1996 | 87.5% | 72.6% |
| May-1996 | 87.6% | 72.5% |
| Jun-1996 | 87.8% | 72.7% |
| Jul-1996 | 88.1% | 72.9% |
| Aug-1996 | 88.4% | 73.0% |
| Sep-1996 | 88.1% | 73.0% |
| Oct-1996 | 88.3% | 73.1% |
| Nov-1996 | 88.2% | 73.0% |
| Dec-1996 | 88.3% | 73.0% |
| Jan-1997 | 88.2% | 73.2% |
| Feb-1997 | 88.2% | 72.9% |
| Mar-1997 | 88.2% | 73.3% |
| Apr-1997 | 88.1% | 73.5% |
| May-1997 | 88.1% | 73.3% |
| Jun-1997 | 88.4% | 73.6% |
| Jul-1997 | 88.6% | 73.9% |
| Aug-1997 | 88.7% | 74.1% |
| Sep-1997 | 88.6% | 73.9% |
| Oct-1997 | 88.6% | 73.8% |
| Nov-1997 | 88.7% | 73.6% |
| Dec-1997 | 88.6% | 73.6% |
| Jan-1998 | 88.8% | 73.4% |
| Feb-1998 | 88.9% | 73.4% |
| Mar-1998 | 88.8% | 73.5% |
| Apr-1998 | 88.9% | 73.5% |
| May-1998 | 88.8% | 73.4% |
| Jun-1998 | 88.7% | 73.6% |
| Jul-1998 | 88.7% | 73.8% |
| Aug-1998 | 88.8% | 73.9% |
| Sep-1998 | 88.8% | 74.0% |
| Oct-1998 | 88.8% | 73.7% |
| Nov-1998 | 89.1% | 73.7% |
| Dec-1998 | 88.9% | 74.0% |
| Jan-1999 | 89.7% | 74.3% |
| Feb-1999 | 89.2% | 74.1% |
| Mar-1999 | 89.2% | 73.8% |
| Apr-1999 | 89.1% | 73.8% |
| May-1999 | 88.9% | 74.1% |
| Jun-1999 | 88.8% | 74.2% |
| Jul-1999 | 88.8% | 73.8% |
| Aug-1999 | 88.7% | 74.1% |
| Sep-1999 | 88.6% | 74.3% |
| Oct-1999 | 88.7% | 74.5% |
| Nov-1999 | 89.0% | 74.5% |
| Dec-1999 | 89.0% | 74.3% |
| Jan-2000 | 89.5% | 74.4% |
| Feb-2000 | 89.4% | 74.5% |
| Mar-2000 | 89.3% | 74.5% |
| Apr-2000 | 89.2% | 74.9% |
| May-2000 | 89.0% | 74.4% |
| Jun-2000 | 89.1% | 74.2% |
| Jul-2000 | 88.9% | 73.9% |
| Aug-2000 | 88.9% | 73.6% |
| Sep-2000 | 88.6% | 73.9% |
| Oct-2000 | 88.6% | 73.9% |
| Nov-2000 | 88.8% | 74.1% |
| Dec-2000 | 88.9% | 74.1% |
| Jan-2001 | 88.9% | 74.2% |
| Feb-2001 | 88.8% | 74.2% |
| Mar-2001 | 88.5% | 74.3% |
| Apr-2001 | 88.3% | 73.7% |
| May-2001 | 88.3% | 73.7% |
| Jun-2001 | 88.1% | 73.4% |
| Jul-2001 | 87.9% | 73.4% |
| Aug-2001 | 87.6% | 73.2% |
| Sep-2001 | 87.6% | 73.1% |
| Oct-2001 | 87.4% | 72.7% |
| Nov-2001 | 87.0% | 72.6% |
| Dec-2001 | 87.1% | 72.6% |
| Jan-2002 | 86.8% | 72.5% |
| Feb-2002 | 87.1% | 72.7% |
| Mar-2002 | 87.0% | 72.5% |
| Apr-2002 | 86.8% | 72.5% |
| May-2002 | 86.9% | 72.2% |
| Jun-2002 | 86.5% | 72.1% |
| Jul-2002 | 86.5% | 71.9% |
| Aug-2002 | 86.8% | 72.1% |
| Sep-2002 | 86.8% | 72.2% |
| Oct-2002 | 86.6% | 72.1% |
| Nov-2002 | 85.9% | 71.9% |
| Dec-2002 | 86.0% | 72.2% |
| Jan-2003 | 85.6% | 72.4% |
| Feb-2003 | 85.9% | 72.1% |
| Mar-2003 | 85.8% | 72.4% |
| Apr-2003 | 85.9% | 72.4% |
| May-2003 | 85.7% | 72.2% |
| Jun-2003 | 85.8% | 72.3% |
| Jul-2003 | 85.8% | 71.9% |
| Aug-2003 | 85.7% | 72.0% |
| Sep-2003 | 85.9% | 71.6% |
| Oct-2003 | 85.9% | 71.6% |
| Nov-2003 | 86.0% | 71.7% |
| Dec-2003 | 86.4% | 71.4% |
| Jan-2004 | 86.4% | 71.6% |
| Feb-2004 | 86.2% | 71.7% |
| Mar-2004 | 86.0% | 71.8% |
| Apr-2004 | 86.2% | 71.8% |
| May-2004 | 86.3% | 71.9% |
| Jun-2004 | 86.5% | 71.9% |
| Jul-2004 | 86.7% | 71.9% |
| Aug-2004 | 86.5% | 71.8% |
| Sep-2004 | 86.4% | 71.9% |
| Oct-2004 | 86.3% | 71.9% |
| Nov-2004 | 86.5% | 72.0% |
| Dec-2004 | 86.2% | 71.8% |
| Jan-2005 | 86.5% | 72.0% |
| Feb-2005 | 86.7% | 71.9% |
| Mar-2005 | 86.8% | 71.8% |
| Apr-2005 | 87.0% | 72.0% |
| May-2005 | 87.1% | 72.1% |
| Jun-2005 | 87.0% | 71.7% |
| Jul-2005 | 87.0% | 71.9% |
| Aug-2005 | 87.4% | 72.1% |
| Sep-2005 | 87.0% | 72.1% |
| Oct-2005 | 87.0% | 71.9% |
| Nov-2005 | 86.8% | 71.9% |
| Dec-2005 | 86.7% | 72.1% |
| Jan-2006 | 87.2% | 72.2% |
| Feb-2006 | 87.1% | 72.4% |
| Mar-2006 | 87.4% | 72.3% |
| Apr-2006 | 87.2% | 72.1% |
| May-2006 | 87.2% | 72.3% |
| Jun-2006 | 87.2% | 72.5% |
| Jul-2006 | 87.1% | 72.7% |
| Aug-2006 | 87.1% | 72.6% |
| Sep-2006 | 87.4% | 72.5% |
| Oct-2006 | 87.4% | 72.9% |
| Nov-2006 | 87.5% | 72.7% |
| Dec-2006 | 87.7% | 72.7% |
| Jan-2007 | 88.0% | 72.8% |
| Feb-2007 | 87.9% | 72.6% |
| Mar-2007 | 88% | 72.7% |
| Apr-2007 | 87.9% | 72.2% |
| May-2007 | 87.7% | 72.5% |
| Jun-2007 | 87.5% | 72.5% |
| Jul-2007 | 87.3% | 72.4% |
| Aug-2007 | 87.2% | 72.6% |
| Sep-2007 | 87.1% | 72.5% |
| Oct-2007 | 86.9% | 72.4% |
| Nov-2007 | 87.2% | 72.5% |
| Dec-2007 | 87.2% | 72.4% |
| Jan-2008 | 87.4% | 72.7% |
| Feb-2008 | 87.4% | 72.6% |
| Mar-2008 | 87.1% | 72.6% |
| Apr-2008 | 86.7% | 72.7% |
| May-2008 | 86.5% | 72.6% |
| Jun-2008 | 86.3% | 72.6% |
| Jul-2008 | 86.2% | 72.4% |
| Aug-2008 | 85.8% | 72.1% |
| Sep-2008 | 85.4% | 72.3% |
| Oct-2008 | 85.2% | 71.9% |
| Nov-2008 | 84.7% | 71.7% |
| Dec-2008 | 83.7% | 71.6% |
| Jan-2009 | 83.1% | 71.1% |
| Feb-2009 | 82.5% | 71.0% |
| Mar-2009 | 82.0% | 70.6% |
| Apr-2009 | 81.8% | 70.7% |
| May-2009 | 81.5% | 70.4% |
| Jun-2009 | 81.5% | 70.4% |
| Jul-2009 | 81.3% | 70.4% |
| Aug-2009 | 81.2% | 70.0% |
| Sep-2009 | 80.8% | 69.5% |
| Oct-2009 | 80.8% | 69.4% |
| Nov-2009 | 80.7% | 69.8% |
| Dec-2009 | 80.4% | 69.2% |
| Jan-2010 | 80.7% | 69.8% |
| Feb-2010 | 80.6% | 69.7% |
| Mar-2010 | 80.8% | 69.5% |
| Apr-2010 | 81.3% | 69.6% |
| May-2010 | 81.1% | 69.3% |
| Jun-2010 | 81.1% | 69.5% |
| Jul-2010 | 81.1% | 69.1% |
| Aug-2010 | 81.2% | 69.0% |
| Sep-2010 | 81.2% | 69.1% |
| Oct-2010 | 81.1% | 69.0% |
| Nov-2010 | 80.7% | 69.1% |
| Dec-2010 | 80.8% | 69.4% |
| Jan-2011 | 81.2% | 69.3% |
| Feb-2011 | 81.4% | 69.0% |
| Mar-2011 | 81.4% | 69.3% |
| Apr-2011 | 81.2% | 69.1% |
| May-2011 | 81.6% | 68.9% |
| Jun-2011 | 81.3% | 68.8% |
| Jul-2011 | 81.1% | 69.0% |
| Aug-2011 | 81.4% | 68.9% |
| Sep-2011 | 81.3% | 68.7% |
| Oct-2011 | 81.1% | 68.9% |
| Nov-2011 | 81.9% | 68.8% |
| Dec-2011 | 82.1% | 68.9% |
| Jan-2012 | 82.5% | 68.9% |
| Feb-2012 | 82.4% | 68.9% |
| Mar-2012 | 82.5% | 69.2% |
| Apr-2012 | 82.5% | 69.1% |
| May-2012 | 82.5% | 69.2% |
| Jun-2012 | 82.6% | 69.0% |
| Jul-2012 | 82.4% | 69.1% |
| Aug-2012 | 82.4% | 69.2% |
| Sep-2012 | 82.7% | 69.5% |
| Oct-2012 | 82.9% | 69.6% |
| Nov-2012 | 82.5% | 69.4% |
| Dec-2012 | 82.8% | 69.4% |
| Jan-2013 | 82.6% | 68.9% |
| Feb-2013 | 82.8% | 69.0% |
| Mar-2013 | 82.8% | 69.0% |
| Apr-2013 | 82.8% | 69.1% |
| May-2013 | 83.0% | 69.3% |
| Jun-2013 | 82.9% | 69.2% |
| Jul-2013 | 82.9% | 69.4% |
| Aug-2013 | 82.6% | 69.6% |
| Sep-2013 | 82.6% | 69.6% |
| Oct-2013 | 82.4% | 69.0% |
| Nov-2013 | 83.0% | 69.3% |
| Dec-2013 | 83.0% | 69.5% |
| Jan-2014 | 83.2% | 69.8% |
| Feb-2014 | 83.0% | 70.1% |
| Mar-2014 | 83.5% | 69.8% |
| Apr-2014 | 83.2% | 69.9% |
| May-2014 | 83.3% | 69.8% |
| Jun-2014 | 83.8% | 70.2% |
| Jul-2014 | 83.8% | 69.8% |
| Aug-2014 | 83.9% | 70.1% |
| Sep-2014 | 84.1% | 69.8% |
| Oct-2014 | 84.0% | 70.1% |
| Nov-2014 | 83.9% | 70.3% |
| Dec-2014 | 84.2% | 70.3% |
| Jan-2015 | 84.3% | 70.2% |
| Feb-2015 | 84.3% | 70.3% |
| Mar-2015 | 84.5% | 70.0% |
| Apr-2015 | 84.4% | 70.2% |
| May-2015 | 84.3% | 70.4% |
| Jun-2015 | 84.5% | 70.5% |
| Jul-2015 | 84.4% | 70.1% |
| Aug-2015 | 84.6% | 70.2% |
| Sep-2015 | 84.6% | 70.2% |
| Oct-2015 | 84.4% | 70.3% |
| Nov-2015 | 84.4% | 70.7% |
| Dec-2015 | 84.5% | 70.6% |
| Jan-2016 | 84.9% | 70.7% |
| Feb-2016 | 84.9% | 70.8% |
| Mar-2016 | 85.2% | 70.9% |
| Apr-2016 | 84.8% | 70.9% |
| May-2016 | 84.9% | 71.0% |
| Jun-2016 | 85.1% | 71.0% |
| Jul-2016 | 84.9% | 71.4% |
| Aug-2016 | 84.9% | 71.1% |
| Sep-2016 | 84.9% | 71.4% |
| Oct-2016 | 85.0% | 71.5% |
| Nov-2016 | 85.0% | 71.4% |
| Dec-2016 | 85.0% | 71.4% |
| Jan-2017 | 85.3% | 71.3% |
| Feb-2017 | 85.2% | 71.7% |
| Mar-2017 | 85.2% | 72.0% |
| Apr-2017 | 85.5% | 72.0% |
| May-2017 | 85.3% | 72.0% |
| Jun-2017 | 85.4% | 72.1% |
| Jul-2017 | 85.3% | 72.4% |
| Aug-2017 | 85.0% | 72.1% |
| Sep-2017 | 85.6% | 72.5% |
| Oct-2017 | 85.6% | 72.1% |
| Nov-2017 | 85.5% | 72.5% |
| Dec-2017 | 86.0% | 72.2% |
| Jan-2018 | 86.0% | 72.1% |
| Feb-2018 | 86.4% | 72.4% |
| Mar-2018 | 86.2% | 72.4% |
| Apr-2018 | 86.3% | 72.3% |
| May-2018 | 86.4% | 72.5% |
| Jun-2018 | 86.1% | 72.8% |
| Jul-2018 | 86.2% | 73.1% |
| Aug-2018 | 86.0% | 72.8% |
| Sep-2018 | 85.9% | 73.0% |
| Oct-2018 | 86.1% | 73.4% |
| Nov-2018 | 86.2% | 73.1% |
| Dec-2018 | 86.0% | 73.3% |
| Jan-2019 | 86.5% | 73.3% |
| Feb-2019 | 86.5% | 73.4% |
| Mar-2019 | 86.7% | 73.1% |
| Apr-2019 | 86.4% | 73.2% |
| May-2019 | 86.3% | 73.3% |
| Jun-2019 | 86.2% | 73.5% |
| Jul-2019 | 86.2% | 73.1% |
| Aug-2019 | 86.2% | 73.9% |
| Sep-2019 | 86.4% | 74.2% |
| Oct-2019 | 86.5% | 74.3% |
| Nov-2019 | 86.7% | 74.2% |
| Dec-2019 | 86.5% | 74.5% |
| Jan-2020 | 86.7% | 74.6% |
| Feb-2020 | 86.4% | 74.6% |
| Mar-2020 | 85.7% | 73.4% |
| Apr-2020 | 75.9% | 63.4% |
| May-2020 | 78.0% | 64.9% |
| Jun-2020 | 79.5% | 67.6% |
| Jul-2020 | 79.8% | 68.0% |
| Aug-2020 | 81.5% | 69.1% |
| Sep-2020 | 81.5% | 68.9% |
| Oct-2020 | 82.2% | 70.1% |
| Nov-2020 | 82.0% | 70.3% |
| Dec-2020 | 82.4% | 70.5% |
| Jan-2021 | 82.6% | 70.4% |
| Feb-2021 | 82.6% | 70.7% |
| Mar-2021 | 82.6% | 71.1% |
| Apr-2021 | 82.8% | 71.1% |
| May-2021 | 83.0% | 71.3% |
| Jun-2021 | 83.1% | 71.3% |
| Jul-2021 | 83.8% | 71.9% |
| Aug-2021 | 84.0% | 71.9% |
| Sep-2021 | 84.2% | 72.0% |
| Oct-2021 | 84.7% | 72.3% |
| Nov-2021 | 85.0% | 73.0% |
| Dec-2021 | 85.2% | 73.4% |
| Jan-2022 | 85.1% | 73.4% |
| Feb-2022 | 85.8% | 73.2% |
| Mar-2022 | 85.8% | 74.2% |
| Apr-2022 | 85.9% | 73.9% |
| May-2022 | 86.0% | 74.1% |
| Jun-2022 | 85.8% | 73.9% |
| Jul-2022 | 85.8% | 74.1% |
| Aug-2022 | 85.9% | 74.7% |
| Sep-2022 | 86.1% | 74.4% |
| Oct-2022 | 85.9% | 74.0% |
| Nov-2022 | 85.8% | 73.9% |
| Dec-2022 | 86.3% | 74.2% |
| Jan-2023 | 85.9% | 74.7% |
| Feb-2023 | 86.2% | 74.8% |
| Mar-2023 | 86.3% | 75.0% |
| Apr-2023 | 86.3% | 75.1% |
| May-2023 | 86.4% | 75.1% |
| Jun-2023 | 86.4% | 75.3% |
| Jul-2023 | 86.5% | 75.3% |
| Aug-2023 | 86.4% | 75.3% |
| Sep-2023 | 86.4% | 75.3% |
| Oct-2023 | 86.0% | 75.3% |
| Nov-2023 | 86.3% | 75.2% |
| Dec-2023 | 86.2% | 74.8% |
| Jan-2024 | 86.2% | 75.0% |
| Feb-2024 | 86.3% | 75.2% |
| Mar-2024 | 86.3% | 75.1% |
| Apr-2024 | 86.1% | 75.5% |
| May-2024 | 86.0% | 75.7% |
| Jun-2024 | 86.5% | 75.1% |
| Jul-2024 | 86.6% | 75.3% |
| Aug-2024 | 86.3% | 75.6% |
| Sep-2024 | 86.4% | 75.5% |
| Oct-2024 | 86.3% | 74.9% |
| Nov-2024 | 86.1% | 74.8% |
| Dec-2024 | 86.1% | 75.0% |
| Jan-2025 | 86.4% | 75.1% |
| Feb-2025 | 86.1% | 75.1% |
| Mar-2025 | 86.0% | 74.9% |
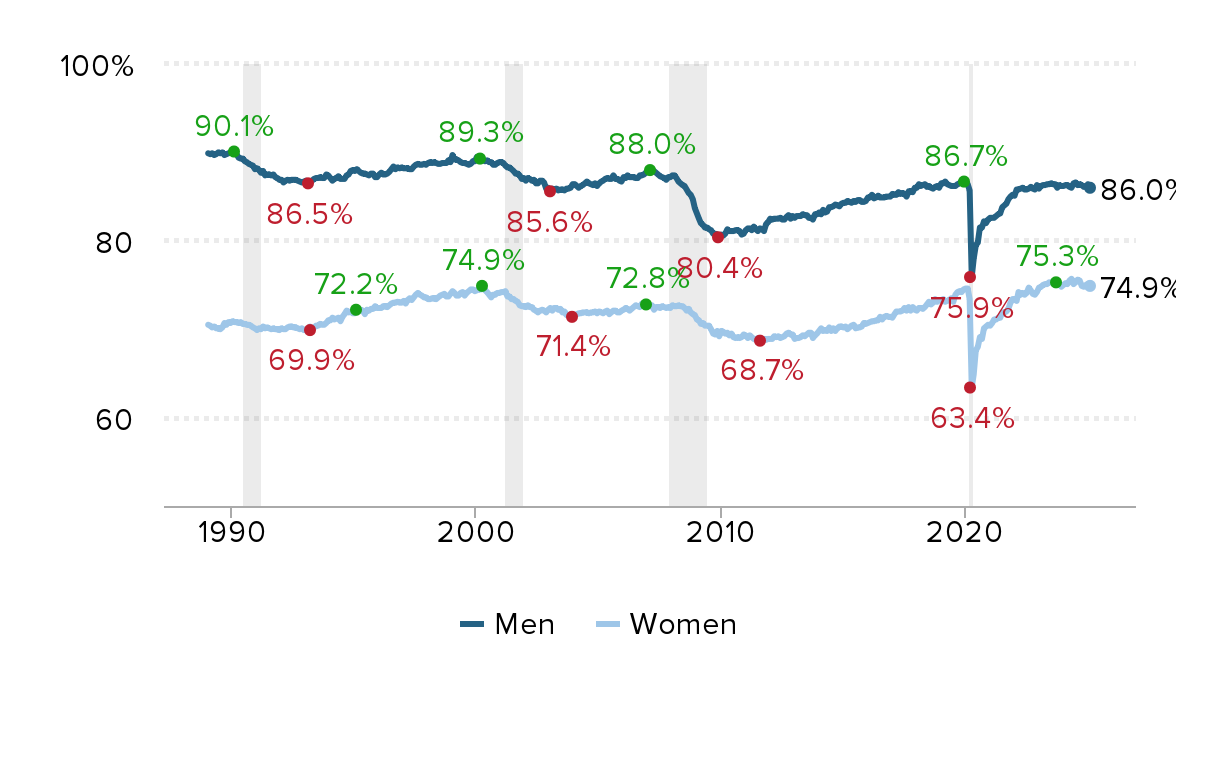
Source: EPI analysis of Bureau of Labor Statistics’ Current Population Survey public data.
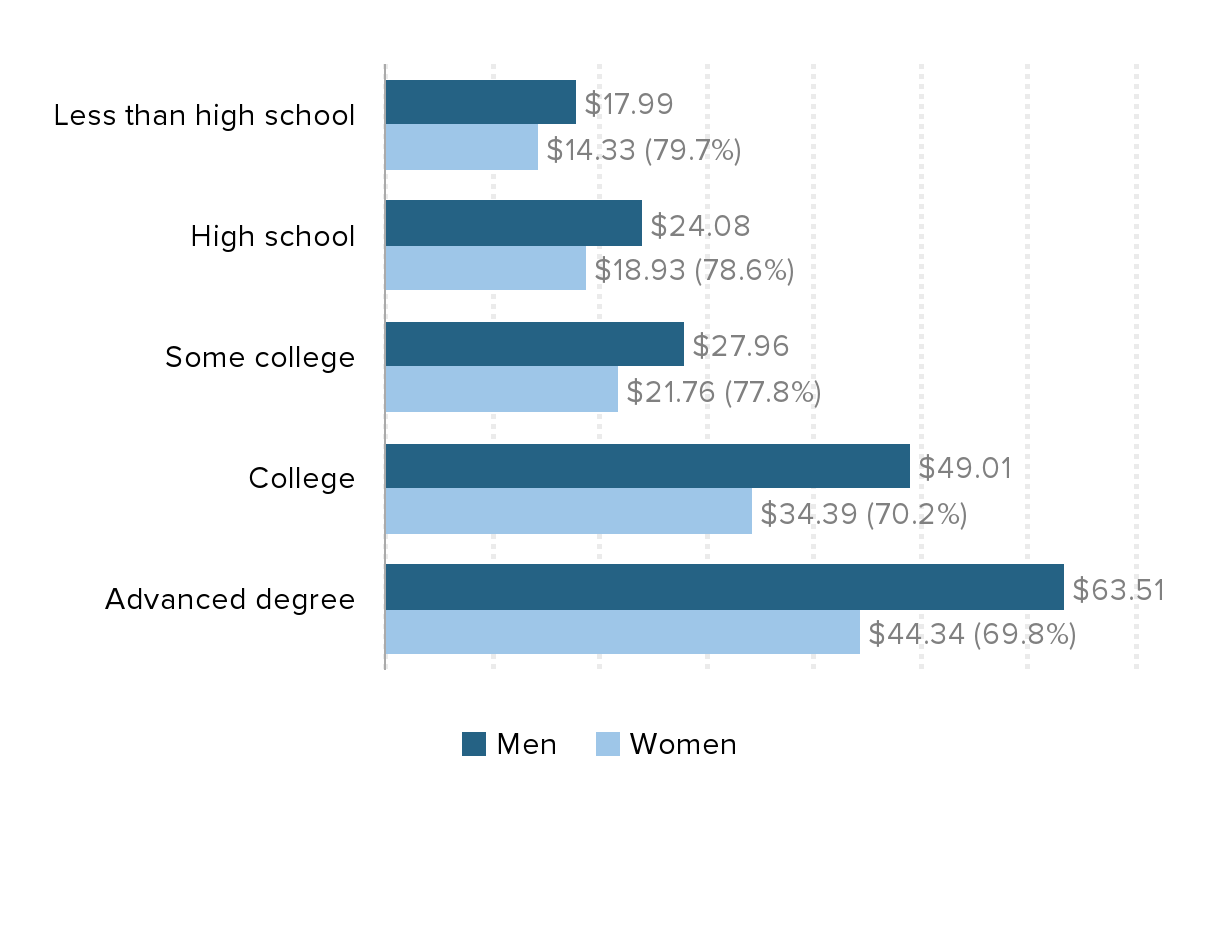
Women are paid less than men at every education level: Average hourly wages, by gender and education, 2022
| Education level | Men | Women |
|---|---|---|
| Less than high school | $17.99 | $14.33 |
| High school | $24.08 | $18.93 |
| Some college | $27.96 | $21.76 |
| College | $49.01 | $34.39 |
| Advanced degree | $63.51 | $44.34 |
Source: EPI analysis of Current Population Survey Outgoing Rotation Group microdata. For more information on the data sample see EPI's State of Working America Data Library.
Unemployment rate of workers age 16 and older by race and ethnicity, January 2020–March 2025
| Date | White | Black | Hispanic | AAPI |
|---|---|---|---|---|
| Jan-2020 | 3.1% | 6.3% | 4.3% | 3% |
| Feb-2020 | 3% | 6% | 4.4% | 2.5% |
| Mar-2020 | 3.9% | 6.8% | 5.9% | 4.1% |
| Apr-2020 | 14.1% | 16.6% | 18.8% | 14.4% |
| May-2020 | 12.3% | 16.8% | 17.6% | 14.8% |
| Jun-2020 | 10.0% | 15.2% | 14.5% | 13.8% |
| Jul-2020 | 9.2% | 14.4% | 12.8% | 11.9% |
| Aug-2020 | 7.4% | 12.8% | 10.6% | 10.6% |
| Sep-2020 | 7.0% | 12.1% | 10.4% | 8.9% |
| Oct-2020 | 6.0% | 10.9% | 8.9% | 7.6% |
| Nov-2020 | 6.0% | 10.4% | 8.6% | 6.8% |
| Dec-2020 | 6.1% | 10.0% | 9.4% | 6.1% |
| Jan-2021 | 5.7% | 9.2% | 8.6% | 6.6% |
| Feb-2021 | 5.5% | 9.8% | 8.4% | 5.1% |
| Mar-2021 | 5.3% | 9.5% | 7.7% | 5.9% |
| Apr-2021 | 5.3% | 9.7% | 7.7% | 5.7% |
| May-2021 | 5.1% | 9.1% | 7.1% | 5.5% |
| Jun-2021 | 5.3% | 9.2% | 7.2% | 5.7% |
| Jul-2021 | 4.8% | 8.2% | 6.4% | 5.2% |
| Aug-2021 | 4.5% | 8.7% | 6.2% | 4.5% |
| Sep-2021 | 4.2% | 7.8% | 6.1% | 4.2% |
| Oct-2021 | 3.9% | 7.8% | 5.7% | 4.2% |
| Nov-2021 | 3.7% | 6.5% | 5.2% | 3.9% |
| Dec-2021 | 3.2% | 7.1% | 4.9% | 3.8% |
| Jan-2022 | 3.4% | 6.9% | 4.9% | 3.6% |
| Feb-2022 | 3.3% | 6.6% | 4.4% | 3.1% |
| Mar-2022 | 3.2% | 6.2% | 4.2% | 2.8% |
| Apr-2022 | 3.2% | 5.9% | 4.1% | 3.1% |
| May-2022 | 3.2% | 6.2% | 4.3% | 2.4% |
| Jun-2022 | 3.3% | 5.8% | 4.3% | 3% |
| Jul-2022 | 3.1% | 5.8% | 3.9% | 2.6% |
| Aug-2022 | 3.2% | 6.4% | 4.5% | 2.8% |
| Sep-2022 | 3.1% | 5.9% | 3.9% | 2.5% |
| Oct-2022 | 3.3% | 5.9% | 4.2% | 2.9% |
| Nov-2022 | 3.3% | 5.7% | 4% | 2.6% |
| Dec-2022 | 3% | 5.7% | 4.1% | 2.4% |
| Jan-2023 | 3.1% | 5.4% | 4.5% | 2.8% |
| Feb-2023 | 3.2% | 5.7% | 5.3% | 3.4% |
| Mar-2023 | 3.2% | 5.0% | 4.6% | 2.8% |
| Apr-2023 | 3.1% | 4.7% | 4.4% | 2.8% |
| May-2023 | 3.3 | 5.6 | 4 | 2.9 |
| Jun-2023 | 3.1 | 6.0 | 4.3 | 3.2 |
| Jul-2023 | 3.1 | 5.8 | 4.4 | 2.3 |
| Aug-2023 | 3.4 | 5.3 | 4.9 | 3.1 |
| Sept-2023 | 3.4% | 5.7% | 4.6% | 2.8% |
| Oct-2023 | 3.5% | 5.8% | 4.8% | 3.1% |
| Nov-2023 | 3.3% | 5.8% | 4.6% | 3.5% |
| Dec-2023 | 3.5% | 5.2% | 5.0% | 3.1% |
| Jan-2024 | 3.4% | 5.3% | 5.0% | 2.9% |
| Feb-2024 | 3.4% | 5.6% | 5.0% | 3.4% |
| Mar-2024 | 3.4% | 6.4% | 4.5% | 2.5% |
| Apr-2024 | 3.5% | 5.6% | 4.8% | 2.8% |
| May-2024 | 3.5% | 6.1% | 5.0% | 3.1% |
| Jun-2024 | 3.5% | 6.3% | 4.9% | 4.1% |
| Jul-2024 | 3.8% | 6.3% | 5.3% | 3.7% |
| Aug-2024 | 3.8% | 6.1% | 5.5% | 4.1% |
| Sept-2024 | 3.7% | 5.7% | 5.1% | 4.1% |
| Oct-2024 | 3.8% | 5.7% | 5.1% | 3.9% |
| Nov-2024 | 3.8% | 6.4% | 5.3% | 3.8% |
| Dec-2024 | 3.6% | 6.1% | 5.1% | 3.5% |
| Jan-2025 | 3.5% | 6.2% | 4.8% | 3.7% |
| Feb-2025 | 3.8% | 6.0% | 5.2% | 3.2% |
| Mar-2025 | 3.7% | 6.2% | 5.1% | 3.5% |
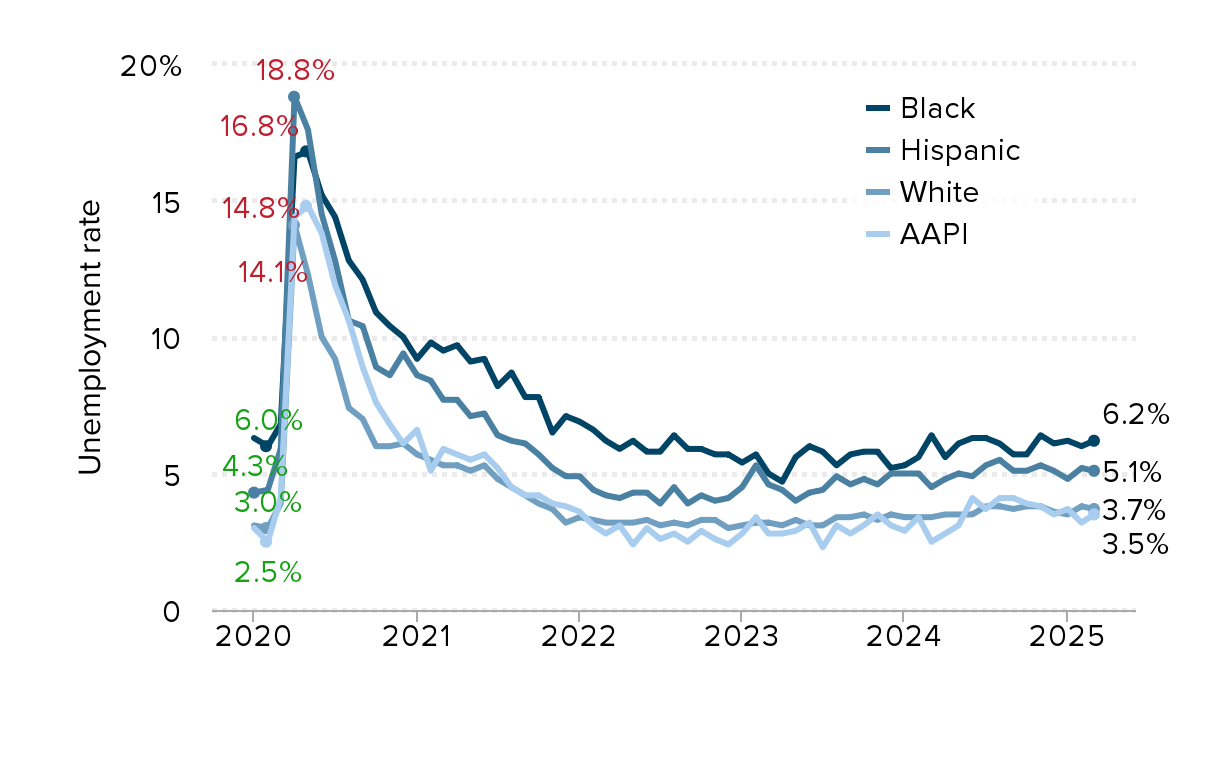
Note: AAPI refers to Asian American and Pacific Islander. Racial and ethnic categories are not mutually exclusive; white and Black data do not exclude Latinx workers of each race.
Source: EPI analysis of Bureau of Labor Statistics’ Current Population Survey public data.
Employment-to-population ratios for workers age 16 and older by race and ethnicity, January 2020–February 2025
| date | White | Black | Hispanic |
|---|---|---|---|
| Jan-2020 | 61.3% | 58.8% | 65% |
| Feb-2020 | 61.3% | 59.2% | 64.8% |
| Mar-2020 | 60.1% | 57.4% | 63.0% |
| Apr-2020 | 51.7% | 48.6% | 51.1% |
| May-2020 | 53.5% | 49.5% | 52.9% |
| Jun-2020 | 55.5% | 50.9% | 55.7% |
| Jul-2020 | 55.8% | 51.6% | 56.6% |
| Aug-2020 | 57.2% | 52.6% | 58.3% |
| Sep-2020 | 57.3% | 52.7% | 58.4% |
| Oct-2020 | 58.1% | 53.8% | 59.9% |
| Nov-2020 | 57.9% | 54.2% | 60.0% |
| Dec-2020 | 57.8% | 54.0% | 59.4% |
| Jan-2021 | 57.8% | 54.6% | 59.4% |
| Feb-2021 | 58.0% | 54.0% | 59.9% |
| Mar-2021 | 58.1% | 54.7% | 60.2% |
| Apr-2021 | 58.2% | 55.0% | 60.1% |
| May-2021 | 58.3% | 55.3% | 60.3% |
| Jun-2021 | 58.2% | 56.0% | 60.5% |
| Jul-2021 | 58.6% | 55.9% | 61.5% |
| Aug-2021 | 58.7% | 56.3% | 61.5% |
| Sep-2021 | 58.9% | 56.7% | 61.6% |
| Oct-2021 | 59.1% | 56.5% | 62.1% |
| Nov-2021 | 59.4% | 56.9% | 63.1% |
| Dec-2021 | 59.7% | 56.6% | 62.9% |
| Jan-2022 | 59.9% | 57.6% | 63.2% |
| Feb-2022 | 60.1% | 57.9% | 63.7% |
| Mar-2022 | 60.2% | 58.0% | 63.6% |
| Apr-2022 | 59.9% | 58.4% | 63.3% |
| May-2022 | 59.9% | 59.0% | 63.4% |
| Jun-2022 | 59.9% | 58.6% | 63.5% |
| Jul-2022 | 59.9% | 58.4% | 63.1% |
| Aug-2022 | 60.1% | 58.0% | 63.8% |
| Sep-2022 | 60.1% | 58.6% | 63.6% |
| Oct-2022 | 60.0% | 58.5% | 63.5% |
| Nov-2022 | 59.8% | 58.9% | 63.2% |
| Dec-2022 | 60.2% | 58.9% | 63.6% |
| Jan-2023 | 60.2% | 59.5% | 63.3% |
| Feb-2023 | 60.2% | 59.7% | 63.3% |
| Mar-2023 | 60.1% | 60.8% | 63.7% |
| Apr-2023 | 60.3% | 59.9% | 63.8% |
| May-2023 | 60.3% | 59.6% | 64.1% |
| Jun-2023 | 60.4% | 58.9% | 64.4% |
| Jul-2023 | 60.3% | 59.2% | 64.4% |
| Aug-2023 | 60.4% | 59.4% | 63.9% |
| Sep-2023 | 60.2% | 59.4% | 64.2% |
| Oct-2023 | 60.1% | 59.3% | 63.8% |
| Nov-2023 | 60.3% | 60.0% | 64.0% |
| Dec-2023 | 59.9% | 60.1% | 63.4% |
| Jan-2024 | 60.0% | 60.0% | 63.5% |
| Feb-2024 | 60.0% | 60.1% | 63.7% |
| Mar-2024 | 60.2% | 59.4% | 63.8% |
| Apr-2024 | 60.2% | 59.6% | 64.1% |
| May-2024 | 60.0% | 59.1% | 63.9% |
| Jun-2024 | 60.0% | 58.8% | 64.2% |
| Jul-2024 | 60.0% | 59.2% | 63.7% |
| Aug-2024 | 60.0% | 58.9% | 64.1% |
| Sep-2024 | 60.1% | 59.2% | 63.9% |
| Oct-2024 | 59.8% | 59.3% | 63.5% |
| Nov-2024 | 59.8% | 58.5% | 63.4% |
| Dec-2024 | 59.9% | 58.6% | 64.1% |
| Jan-2025 | 60.1% | 58.6% | 63.6% |
| Feb-2025 | 59.7% | 58.9% | 63.4% |
| Mar-2025 | 59.8% | 58.4% | 63.8% |
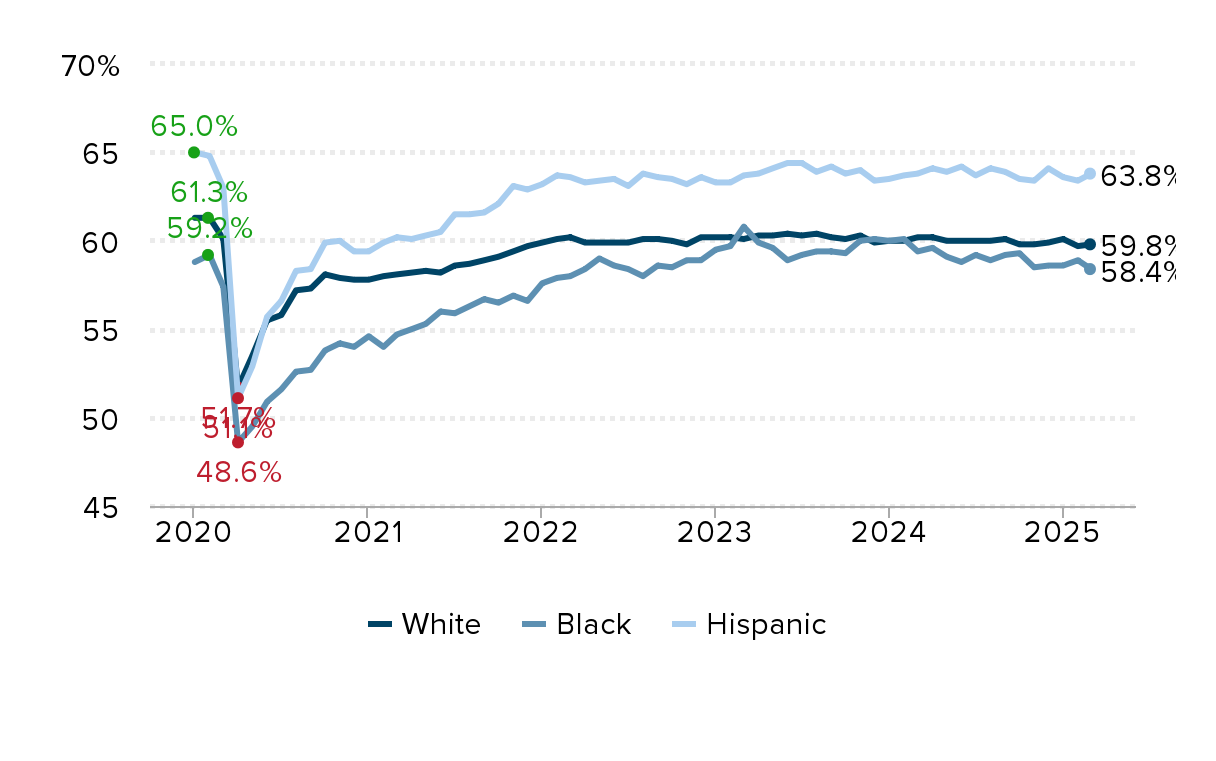
Note: Racial and ethnic categories are not mutually exclusive; white and Black data do not exclude Latinx workers of each race.
Source: EPI analysis of Bureau of Labor Statistics’ Current Population Survey public data.
Black employment-to-population ratio rose in the recovery, but remains lower than white when adjusting for age distribution: Employment-to-population ratio (EPOP) by age group and race, under alternative scenarios
| Black | White | |
|---|---|---|
| 2019 | 58.1% | 59.9% |
| 2023 (actual) | 59.5% | 59.0% |
| 2023 (age adjusted only) | 57.2% | 58.8% |
| 2023 (EPOP adjusted only) | 60.4% | 60.1% |
| 2023 (apply white age distribution) | 54.7% | 59.0% |
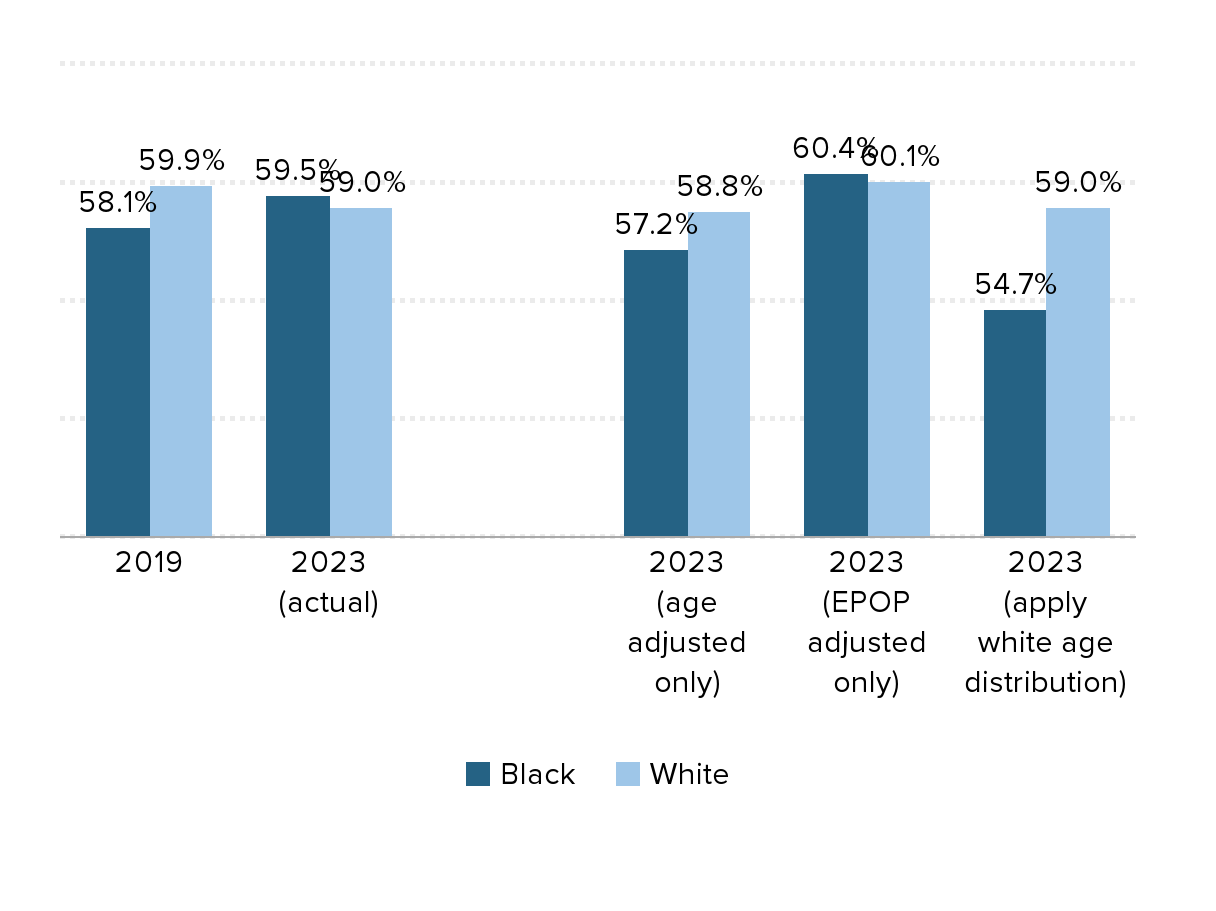
Notes: Data for January to March 2023. Black and white race categories are also non-Hispanic. The first two sets of bars represent the actual EPOPs in 2019 and 2023, respectively. The third set of bars shows what the 2023 EPOPs would be if the population aged to 2023, but the EPOPs didn't change. The fourth set of bars shows what the 2023 EPOPs would be if the population didn't age between 2019 and 2023. The fifth set shows the Black and white EPOPs if they both used the white age distribution.
Source: Authors' analysis of Current Population Survey basic monthly microdata, EPI Current Population Survey Extracts, Version 1.0.40 (2023), https://microdata.epi.org.
Unemployment rate for young workers, 16–24 years old, and workers 25+, 1979–2025
| Ages 16–24 | Ages 25+ | |
|---|---|---|
| 1979-01-01 | 11.6% | 4.0% |
| 1979-02-01 | 11.7% | 4.0% |
| 1979-03-01 | 11.6% | 4.0% |
| 1979-04-01 | 11.6% | 4.0% |
| 1979-05-01 | 11.6% | 3.7% |
| 1979-06-01 | 11.5% | 3.8% |
| 1979-07-01 | 11.6% | 3.8% |
| 1979-08-01 | 12.2% | 4.1% |
| 1979-09-01 | 12.1% | 3.9% |
| 1979-10-01 | 12.1% | 4.0% |
| 1979-11-01 | 11.6% | 4.1% |
| 1979-12-01 | 12.4% | 3.9% |
| 1980-01-01 | 12.6% | 4.3% |
| 1980-02-01 | 12.5% | 4.3% |
| 1980-03-01 | 12.3% | 4.5% |
| 1980-04-01 | 13.1% | 5.0% |
| 1980-05-01 | 14.7% | 5.2% |
| 1980-06-01 | 14.7% | 5.4% |
| 1980-07-01 | 14.9% | 5.6% |
| 1980-08-01 | 14.7% | 5.6% |
| 1980-09-01 | 14.3% | 5.4% |
| 1980-10-01 | 14.5% | 5.4% |
| 1980-11-01 | 14.4% | 5.3% |
| 1980-12-01 | 13.7% | 5.2% |
| 1981-01-01 | 14.5% | 5.3% |
| 1981-02-01 | 14.6% | 5.3% |
| 1981-03-01 | 14.5% | 5.2% |
| 1981-04-01 | 14.5% | 5.0% |
| 1981-05-01 | 15.1% | 5.2% |
| 1981-06-01 | 14.9% | 5.3% |
| 1981-07-01 | 14.1% | 5.2% |
| 1981-08-01 | 14.5% | 5.2% |
| 1981-09-01 | 14.9% | 5.4% |
| 1981-10-01 | 15.3% | 5.7% |
| 1981-11-01 | 15.9% | 6.0% |
| 1981-12-01 | 16.1% | 6.3% |
| 1982-01-01 | 16.5% | 6.3% |
| 1982-02-01 | 17.0% | 6.5% |
| 1982-03-01 | 16.9% | 6.8% |
| 1982-04-01 | 17.4% | 7.0% |
| 1982-05-01 | 17.3% | 7.1% |
| 1982-06-01 | 17.5% | 7.3% |
| 1982-07-01 | 18.0% | 7.5% |
| 1982-08-01 | 18.1% | 7.4% |
| 1982-09-01 | 18.2% | 7.9% |
| 1982-10-01 | 18.5% | 8.1% |
| 1982-11-01 | 19.0% | 8.4% |
| 1982-12-01 | 18.9% | 8.6% |
| 1983-01-01 | 18.5% | 8.1% |
| 1983-02-01 | 18.4% | 8.2% |
| 1983-03-01 | 18.2% | 8.1% |
| 1983-04-01 | 18.0% | 8.0% |
| 1983-05-01 | 17.7% | 8.0% |
| 1983-06-01 | 17.8% | 7.9% |
| 1983-07-01 | 16.8% | 7.3% |
| 1983-08-01 | 17.3% | 7.3% |
| 1983-09-01 | 16.4% | 7.2% |
| 1983-10-01 | 16.2% | 6.8% |
| 1983-11-01 | 15.4% | 6.6% |
| 1983-12-01 | 14.9% | 6.6% |
| 1984-01-01 | 14.8% | 6.2% |
| 1984-02-01 | 14.3% | 6.1% |
| 1984-03-01 | 14.4% | 5.9% |
| 1984-04-01 | 14.5% | 6.0% |
| 1984-05-01 | 13.6% | 5.7% |
| 1984-06-01 | 13.2% | 5.6% |
| 1984-07-01 | 13.7% | 5.8% |
| 1984-08-01 | 14.1% | 5.7% |
| 1984-09-01 | 14.0% | 5.6% |
| 1984-10-01 | 13.6% | 5.7% |
| 1984-11-01 | 13.2% | 5.6% |
| 1984-12-01 | 13.7% | 5.6% |
| 1985-01-01 | 13.6% | 5.7% |
| 1985-02-01 | 13.6% | 5.6% |
| 1985-03-01 | 13.6% | 5.6% |
| 1985-04-01 | 13.2% | 5.8% |
| 1985-05-01 | 13.6% | 5.5% |
| 1985-06-01 | 13.5% | 5.8% |
| 1985-07-01 | 14.2% | 5.6% |
| 1985-08-01 | 13.3% | 5.6% |
| 1985-09-01 | 13.3% | 5.6% |
| 1985-10-01 | 14.1% | 5.4% |
| 1985-11-01 | 13.5% | 5.3% |
| 1985-12-01 | 13.5% | 5.4% |
| 1986-01-01 | 13.0% | 5.1% |
| 1986-02-01 | 13.6% | 5.6% |
| 1986-03-01 | 13.2% | 5.6% |
| 1986-04-01 | 13.7% | 5.5% |
| 1986-05-01 | 13.7% | 5.5% |
| 1986-06-01 | 13.5% | 5.6% |
| 1986-07-01 | 13.3% | 5.5% |
| 1986-08-01 | 13.1% | 5.4% |
| 1986-09-01 | 13.6% | 5.4% |
| 1986-10-01 | 13.0% | 5.5% |
| 1986-11-01 | 12.8% | 5.4% |
| 1986-12-01 | 13.0% | 5.1% |
| 1987-01-01 | 13.0% | 5.1% |
| 1987-02-01 | 13.1% | 5.0% |
| 1987-03-01 | 12.8% | 5.1% |
| 1987-04-01 | 12.6% | 4.9% |
| 1987-05-01 | 12.5% | 4.8% |
| 1987-06-01 | 12.3% | 4.7% |
| 1987-07-01 | 11.8% | 4.7% |
| 1987-08-01 | 11.7% | 4.7% |
| 1987-09-01 | 11.8% | 4.6% |
| 1987-10-01 | 11.8% | 4.6% |
| 1987-11-01 | 11.5% | 4.5% |
| 1987-12-01 | 11.2% | 4.5% |
| 1988-01-01 | 11.5% | 4.4% |
| 1988-02-01 | 11.3% | 4.4% |
| 1988-03-01 | 11.8% | 4.3% |
| 1988-04-01 | 11.2% | 4.2% |
| 1988-05-01 | 11.3% | 4.3% |
| 1988-06-01 | 10.5% | 4.2% |
| 1988-07-01 | 10.8% | 4.2% |
| 1988-08-01 | 11.0% | 4.4% |
| 1988-09-01 | 10.8% | 4.2% |
| 1988-10-01 | 10.8% | 4.1% |
| 1988-11-01 | 10.5% | 4.2% |
| 1988-12-01 | 10.8% | 4.1% |
| 1989-01-01 | 11.8% | 4.1% |
| 1989-02-01 | 10.6% | 4.0% |
| 1989-03-01 | 10.1% | 3.9% |
| 1989-04-01 | 10.6% | 4.1% |
| 1989-05-01 | 10.4% | 4.0% |
| 1989-06-01 | 11.2% | 4.0% |
| 1989-07-01 | 10.6% | 4.0% |
| 1989-08-01 | 10.9% | 4.0% |
| 1989-09-01 | 11.1% | 4.1% |
| 1989-10-01 | 11.0% | 4.1% |
| 1989-11-01 | 11.3% | 4.1% |
| 1989-12-01 | 11.2% | 4.1% |
| 1990-01-01 | 10.8% | 4.1% |
| 1990-02-01 | 10.7% | 4.1% |
| 1990-03-01 | 10.6% | 4.1% |
| 1990-04-01 | 11.1% | 4.2% |
| 1990-05-01 | 10.8% | 4.2% |
| 1990-06-01 | 10.4% | 4.1% |
| 1990-07-01 | 10.7% | 4.4% |
| 1990-08-01 | 11.5% | 4.5% |
| 1990-09-01 | 11.7% | 4.6% |
| 1990-10-01 | 11.8% | 4.7% |
| 1990-11-01 | 12.0% | 4.9% |
| 1990-12-01 | 12.0% | 5.0% |
| 1991-01-01 | 12.6% | 5.0% |
| 1991-02-01 | 12.8% | 5.3% |
| 1991-03-01 | 13.1% | 5.5% |
| 1991-04-01 | 12.7% | 5.4% |
| 1991-05-01 | 13.6% | 5.5% |
| 1991-06-01 | 13.6% | 5.5% |
| 1991-07-01 | 13.8% | 5.4% |
| 1991-08-01 | 13.5% | 5.5% |
| 1991-09-01 | 13.4% | 5.5% |
| 1991-10-01 | 13.9% | 5.6% |
| 1991-11-01 | 13.8% | 5.7% |
| 1991-12-01 | 14.6% | 5.8% |
| 1992-01-01 | 13.9% | 5.9% |
| 1992-02-01 | 14.2% | 6.0% |
| 1992-03-01 | 14.1% | 6.1% |
| 1992-04-01 | 13.6% | 6.1% |
| 1992-05-01 | 14.4% | 6.3% |
| 1992-06-01 | 15.2% | 6.3% |
| 1992-07-01 | 14.5% | 6.3% |
| 1992-08-01 | 14.2% | 6.3% |
| 1992-09-01 | 14.5% | 6.2% |
| 1992-10-01 | 13.5% | 6.1% |
| 1992-11-01 | 14.3% | 6.1% |
| 1992-12-01 | 14.2% | 6.1% |
| 1993-01-01 | 14.0% | 5.8% |
| 1993-02-01 | 14.1% | 5.7% |
| 1993-03-01 | 13.6% | 5.7% |
| 1993-04-01 | 13.8% | 5.7% |
| 1993-05-01 | 14.2% | 5.6% |
| 1993-06-01 | 13.7% | 5.7% |
| 1993-07-01 | 13.1% | 5.7% |
| 1993-08-01 | 13.0% | 5.5% |
| 1993-09-01 | 12.6% | 5.6% |
| 1993-10-01 | 13.0% | 5.6% |
| 1993-11-01 | 12.9% | 5.4% |
| 1993-12-01 | 12.5% | 5.4% |
| 1994-01-01 | 13.4% | 5.2% |
| 1994-02-01 | 12.9% | 5.3% |
| 1994-03-01 | 13.1% | 5.2% |
| 1994-04-01 | 13.3% | 5.0% |
| 1994-05-01 | 12.5% | 4.8% |
| 1994-06-01 | 12.4% | 4.8% |
| 1994-07-01 | 12.4% | 4.8% |
| 1994-08-01 | 12.5% | 4.8% |
| 1994-09-01 | 12.1% | 4.7% |
| 1994-10-01 | 12.0% | 4.6% |
| 1994-11-01 | 11.4% | 4.5% |
| 1994-12-01 | 11.5% | 4.3% |
| 1995-01-01 | 11.4% | 4.4% |
| 1995-02-01 | 11.7% | 4.2% |
| 1995-03-01 | 11.6% | 4.2% |
| 1995-04-01 | 12.0% | 4.5% |
| 1995-05-01 | 11.9% | 4.5% |
| 1995-06-01 | 12.0% | 4.4% |
| 1995-07-01 | 12.5% | 4.4% |
| 1995-08-01 | 12.5% | 4.4% |
| 1995-09-01 | 12.7% | 4.3% |
| 1995-10-01 | 12.4% | 4.2% |
| 1995-11-01 | 12.0% | 4.4% |
| 1995-12-01 | 12.4% | 4.3% |
| 1996-01-01 | 12.8% | 4.3% |
| 1996-02-01 | 12.2% | 4.2% |
| 1996-03-01 | 12.2% | 4.2% |
| 1996-04-01 | 12.0% | 4.3% |
| 1996-05-01 | 12.2% | 4.3% |
| 1996-06-01 | 11.8% | 4.1% |
| 1996-07-01 | 12.4% | 4.2% |
| 1996-08-01 | 11.6% | 4.0% |
| 1996-09-01 | 11.4% | 4.0% |
| 1996-10-01 | 11.6% | 4.0% |
| 1996-11-01 | 11.9% | 4.1% |
| 1996-12-01 | 11.8% | 4.1% |
| 1997-01-01 | 12.2% | 4.0% |
| 1997-02-01 | 11.8% | 4.0% |
| 1997-03-01 | 11.7% | 3.9% |
| 1997-04-01 | 11.6% | 3.8% |
| 1997-05-01 | 11.1% | 3.8% |
| 1997-06-01 | 11.4% | 3.8% |
| 1997-07-01 | 11.2% | 3.7% |
| 1997-08-01 | 11.1% | 3.7% |
| 1997-09-01 | 11.2% | 3.7% |
| 1997-10-01 | 11.0% | 3.5% |
| 1997-11-01 | 10.8% | 3.4% |
| 1997-12-01 | 10.5% | 3.6% |
| 1998-01-01 | 10.9% | 3.5% |
| 1998-02-01 | 10.6% | 3.5% |
| 1998-03-01 | 10.5% | 3.6% |
| 1998-04-01 | 9.7% | 3.4% |
| 1998-05-01 | 10.3% | 3.3% |
| 1998-06-01 | 10.6% | 3.4% |
| 1998-07-01 | 10.6% | 3.4% |
| 1998-08-01 | 10.8% | 3.3% |
| 1998-09-01 | 11.0% | 3.4% |
| 1998-10-01 | 10.5% | 3.4% |
| 1998-11-01 | 9.8% | 3.3% |
| 1998-12-01 | 9.6% | 3.3% |
| 1999-01-01 | 10.2% | 3.2% |
| 1999-02-01 | 10.1% | 3.3% |
| 1999-03-01 | 9.9% | 3.1% |
| 1999-04-01 | 10.0% | 3.3% |
| 1999-05-01 | 9.6% | 3.1% |
| 1999-06-01 | 10.0% | 3.2% |
| 1999-07-01 | 9.9% | 3.2% |
| 1999-08-01 | 9.6% | 3.2% |
| 1999-09-01 | 10.2% | 3.1% |
| 1999-10-01 | 10.0% | 3.0% |
| 1999-11-01 | 9.9% | 3.0% |
| 1999-12-01 | 9.6% | 2.9% |
| 2000-01-01 | 9.4% | 3.0% |
| 2000-02-01 | 9.9% | 3.0% |
| 2000-03-01 | 9.6% | 3.0% |
| 2000-04-01 | 9.2% | 2.9% |
| 2000-05-01 | 9.8% | 3.0% |
| 2000-06-01 | 9.3% | 3.0% |
| 2000-07-01 | 9.3% | 3.0% |
| 2000-08-01 | 9.3% | 3.1% |
| 2000-09-01 | 8.9% | 3.0% |
| 2000-10-01 | 8.9% | 2.9% |
| 2000-11-01 | 9.1% | 3.0% |
| 2000-12-01 | 9.2% | 2.9% |
| 2001-01-01 | 9.6% | 3.2% |
| 2001-02-01 | 9.6% | 3.2% |
| 2001-03-01 | 9.8% | 3.2% |
| 2001-04-01 | 10.2% | 3.3% |
| 2001-05-01 | 9.9% | 3.3% |
| 2001-06-01 | 10.4% | 3.5% |
| 2001-07-01 | 10.2% | 3.5% |
| 2001-08-01 | 11.2% | 3.8% |
| 2001-09-01 | 10.8% | 3.9% |
| 2001-10-01 | 11.5% | 4.2% |
| 2001-11-01 | 11.6% | 4.4% |
| 2001-12-01 | 12.2% | 4.5% |
| 2002-01-01 | 12.1% | 4.5% |
| 2002-02-01 | 11.8% | 4.5% |
| 2002-03-01 | 12.5% | 4.5% |
| 2002-04-01 | 12.3% | 4.8% |
| 2002-05-01 | 11.6% | 4.8% |
| 2002-06-01 | 11.8% | 4.7% |
| 2002-07-01 | 12.1% | 4.6% |
| 2002-08-01 | 12.0% | 4.6% |
| 2002-09-01 | 11.7% | 4.5% |
| 2002-10-01 | 11.8% | 4.6% |
| 2002-11-01 | 12.1% | 4.7% |
| 2002-12-01 | 12.1% | 4.8% |
| 2003-01-01 | 12.0% | 4.7% |
| 2003-02-01 | 12.1% | 4.8% |
| 2003-03-01 | 12.0% | 4.8% |
| 2003-04-01 | 12.6% | 4.9% |
| 2003-05-01 | 12.9% | 4.9% |
| 2003-06-01 | 13.2% | 5.1% |
| 2003-07-01 | 13.0% | 4.9% |
| 2003-08-01 | 12.3% | 5.0% |
| 2003-09-01 | 12.8% | 4.9% |
| 2003-10-01 | 12.2% | 4.9% |
| 2003-11-01 | 12.1% | 4.8% |
| 2003-12-01 | 11.7% | 4.6% |
| 2004-01-01 | 12.0% | 4.6% |
| 2004-02-01 | 11.7% | 4.5% |
| 2004-03-01 | 12.0% | 4.7% |
| 2004-04-01 | 11.6% | 4.5% |
| 2004-05-01 | 12.1% | 4.4% |
| 2004-06-01 | 12.0% | 4.5% |
| 2004-07-01 | 12.1% | 4.4% |
| 2004-08-01 | 11.5% | 4.3% |
| 2004-09-01 | 11.7% | 4.3% |
| 2004-10-01 | 12.1% | 4.2% |
| 2004-11-01 | 11.5% | 4.3% |
| 2004-12-01 | 11.7% | 4.2% |
| 2005-01-01 | 11.6% | 4.1% |
| 2005-02-01 | 12.4% | 4.2% |
| 2005-03-01 | 11.8% | 4.0% |
| 2005-04-01 | 11.8% | 4.0% |
| 2005-05-01 | 11.7% | 3.9% |
| 2005-06-01 | 11.1% | 4.0% |
| 2005-07-01 | 10.7% | 4.0% |
| 2005-08-01 | 11.1% | 3.8% |
| 2005-09-01 | 10.8% | 4.1% |
| 2005-10-01 | 10.8% | 3.9% |
| 2005-11-01 | 11.1% | 4.0% |
| 2005-12-01 | 10.5% | 3.9% |
| 2006-01-01 | 10.4% | 3.7% |
| 2006-02-01 | 10.8% | 3.7% |
| 2006-03-01 | 10.5% | 3.6% |
| 2006-04-01 | 10.3% | 3.7% |
| 2006-05-01 | 10.0% | 3.7% |
| 2006-06-01 | 10.4% | 3.6% |
| 2006-07-01 | 10.9% | 3.7% |
| 2006-08-01 | 10.7% | 3.6% |
| 2006-09-01 | 10.6% | 3.5% |
| 2006-10-01 | 10.6% | 3.3% |
| 2006-11-01 | 10.6% | 3.5% |
| 2006-12-01 | 10.0% | 3.5% |
| 2007-01-01 | 10.3% | 3.7% |
| 2007-02-01 | 9.9% | 3.6% |
| 2007-03-01 | 10.0% | 3.4% |
| 2007-04-01 | 10.3% | 3.5% |
| 2007-05-01 | 9.9% | 3.5% |
| 2007-06-01 | 10.6% | 3.5% |
| 2007-07-01 | 10.5% | 3.7% |
| 2007-08-01 | 10.7% | 3.6% |
| 2007-09-01 | 11.2% | 3.6% |
| 2007-10-01 | 10.7% | 3.7% |
| 2007-11-01 | 10.8% | 3.7% |
| 2007-12-01 | 11.7% | 3.8% |
| 2008-01-01 | 11.7% | 3.8% |
| 2008-02-01 | 11.4% | 3.8% |
| 2008-03-01 | 11.4% | 4.0% |
| 2008-04-01 | 11.0% | 4.0% |
| 2008-05-01 | 13.0% | 4.1% |
| 2008-06-01 | 12.9% | 4.3% |
| 2008-07-01 | 13.5% | 4.5% |
| 2008-08-01 | 13.1% | 4.9% |
| 2008-09-01 | 13.5% | 4.9% |
| 2008-10-01 | 13.6% | 5.3% |
| 2008-11-01 | 14.0% | 5.6% |
| 2008-12-01 | 14.8% | 6.1% |
| 2009-01-01 | 15.0% | 6.6% |
| 2009-02-01 | 16.0% | 7.1% |
| 2009-03-01 | 16.5% | 7.4% |
| 2009-04-01 | 16.7% | 7.7% |
| 2009-05-01 | 17.6% | 8.0% |
| 2009-06-01 | 18.0% | 8.1% |
| 2009-07-01 | 17.9% | 8.1% |
| 2009-08-01 | 18.1% | 8.3% |
| 2009-09-01 | 18.4% | 8.4% |
| 2009-10-01 | 19.1% | 8.6% |
| 2009-11-01 | 19.2% | 8.4% |
| 2009-12-01 | 18.8% | 8.4% |
| 2010-01-01 | 18.8% | 8.3% |
| 2010-02-01 | 18.7% | 8.4% |
| 2010-03-01 | 18.8% | 8.5% |
| 2010-04-01 | 19.5% | 8.4% |
| 2010-05-01 | 18.1% | 8.3% |
| 2010-06-01 | 18.2% | 8.1% |
| 2010-07-01 | 18.4% | 8.0% |
| 2010-08-01 | 17.7% | 8.2% |
| 2010-09-01 | 17.9% | 8.2% |
| 2010-10-01 | 18.7% | 8.1% |
| 2010-11-01 | 18.5% | 8.4% |
| 2010-12-01 | 17.9% | 8.0% |
| 2011-01-01 | 18.1% | 7.7% |
| 2011-02-01 | 17.7% | 7.6% |
| 2011-03-01 | 17.6% | 7.6% |
| 2011-04-01 | 17.6% | 7.7% |
| 2011-05-01 | 17.3% | 7.7% |
| 2011-06-01 | 17.1% | 7.9% |
| 2011-07-01 | 17.3% | 7.7% |
| 2011-08-01 | 17.4% | 7.7% |
| 2011-09-01 | 17.3% | 7.7% |
| 2011-10-01 | 16.7% | 7.6% |
| 2011-11-01 | 17.0% | 7.3% |
| 2011-12-01 | 16.7% | 7.2% |
| 2012-01-01 | 16.1% | 7.0% |
| 2012-02-01 | 16.5% | 7.0% |
| 2012-03-01 | 16.2% | 6.9% |
| 2012-04-01 | 16.6% | 6.8% |
| 2012-05-01 | 16.1% | 6.9% |
| 2012-06-01 | 16.2% | 7.0% |
| 2012-07-01 | 16.3% | 6.9% |
| 2012-08-01 | 16.7% | 6.7% |
| 2012-09-01 | 15.5% | 6.6% |
| 2012-10-01 | 16.0% | 6.5% |
| 2012-11-01 | 15.9% | 6.4% |
| 2012-12-01 | 16.5% | 6.5% |
| 2013-01-01 | 16.8% | 6.5% |
| 2013-02-01 | 16.3% | 6.3% |
| 2013-03-01 | 16.1% | 6.2% |
| 2013-04-01 | 16.3% | 6.2% |
| 2013-05-01 | 16.3% | 6.1% |
| 2013-06-01 | 16.0% | 6.2% |
| 2013-07-01 | 15.4% | 6.0% |
| 2013-08-01 | 15.7% | 5.9% |
| 2013-09-01 | 15.1% | 6.0% |
| 2013-10-01 | 14.8% | 6.0% |
| 2013-11-01 | 14.1% | 5.9% |
| 2013-12-01 | 13.4% | 5.6% |
| 2014-01-01 | 14.1% | 5.3% |
| 2014-02-01 | 14.5% | 5.4% |
| 2014-03-01 | 14.6% | 5.4% |
| 2014-04-01 | 13.0% | 5.2% |
| 2014-05-01 | 13.3% | 5.2% |
| 2014-06-01 | 13.1% | 5.0% |
| 2014-07-01 | 13.5% | 5.0% |
| 2014-08-01 | 13.2% | 5.0% |
| 2014-09-01 | 13.8% | 4.7% |
| 2014-10-01 | 12.6% | 4.7% |
| 2014-11-01 | 12.5% | 4.8% |
| 2014-12-01 | 12.2% | 4.5% |
| 2015-01-01 | 12.0% | 4.6% |
| 2015-02-01 | 11.8% | 4.5% |
| 2015-03-01 | 12.5% | 4.4% |
| 2015-04-01 | 11.8% | 4.5% |
| 2015-05-01 | 12.3% | 4.5% |
| 2015-06-01 | 11.9% | 4.2% |
| 2015-07-01 | 11.5% | 4.2% |
| 2015-08-01 | 11.1% | 4.1% |
| 2015-09-01 | 11.2% | 4.1% |
| 2015-10-01 | 11.0% | 4.1% |
| 2015-11-01 | 11.2% | 4.2% |
| 2015-12-01 | 11.1% | 4.0% |
| 2016-01-01 | 10.0% | 4.0% |
| 2016-02-01 | 10.5% | 4.0% |
| 2016-03-01 | 10.7% | 4.1% |
| 2016-04-01 | 11.0% | 4.1% |
| 2016-05-01 | 10.4% | 3.9% |
| 2016-06-01 | 10.5% | 4.0% |
| 2016-07-01 | 10.6% | 3.9% |
| 2016-08-01 | 10.2% | 4.1% |
| 2016-09-01 | 10.4% | 4.2% |
| 2016-10-01 | 10.6% | 4.0% |
| 2016-11-01 | 10.3% | 3.9% |
| 2016-12-01 | 10.0% | 3.9% |
| 2017-01-01 | 10.0% | 3.9% |
| 2017-02-01 | 9.8% | 3.9% |
| 2017-03-01 | 9.0% | 3.7% |
| 2017-04-01 | 9.3% | 3.6% |
| 2017-05-01 | 8.7% | 3.7% |
| 2017-06-01 | 9.1% | 3.6% |
| 2017-07-01 | 8.9% | 3.6% |
| 2017-08-01 | 8.9% | 3.7% |
| 2017-09-01 | 9.1% | 3.5% |
| 2017-10-01 | 9.2% | 3.4% |
| 2017-11-01 | 9.8% | 3.4% |
| 2017-12-01 | 9.1% | 3.4% |
| 2018-01-01 | 9.2% | 3.3% |
| 2018-02-01 | 9.0% | 3.4% |
| 2018-03-01 | 8.3% | 3.3% |
| 2018-04-01 | 8.4% | 3.3% |
| 2018-05-01 | 8.6% | 3.1% |
| 2018-06-01 | 8.8% | 3.2% |
| 2018-07-01 | 8.6% | 3.1% |
| 2018-08-01 | 8.2% | 3.1% |
| 2018-09-01 | 8.4% | 3.0% |
| 2018-10-01 | 8.5% | 3.1% |
| 2018-11-01 | 8.3% | 3.1% |
| 2018-12-01 | 8.9% | 3.2% |
| 2019-01-01 | 9.3% | 3.2% |
| 2019-02-01 | 9.1% | 3.1% |
| 2019-03-01 | 8.6% | 3.1% |
| 2019-04-01 | 8.3% | 2.9% |
| 2019-05-01 | 8.5% | 2.9% |
| 2019-06-01 | 7.9% | 3.0% |
| 2019-07-01 | 8.4% | 3.0% |
| 2019-08-01 | 8.3% | 2.9% |
| 2019-09-01 | 7.9% | 2.8% |
| 2019-10-01 | 7.9% | 2.9% |
| 2019-11-01 | 8.1% | 2.9% |
| 2019-12-01 | 8.4% | 2.9% |
| 2020-01-01 | 8.6% | 2.9% |
| 2020-02-01 | 7.8% | 2.9% |
| 2020-03-01 | 10.1% | 3.6% |
| 2020-04-01 | 27.5% | 13.0% |
| 2020-05-01 | 25.1% | 11.5% |
| 2020-06-01 | 20.4% | 9.7% |
| 2020-07-01 | 18.3% | 9.0% |
| 2020-08-01 | 14.7% | 7.5% |
| 2020-09-01 | 13.5% | 7.0% |
| 2020-10-01 | 11.8% | 6.1% |
| 2020-11-01 | 11.6% | 6.0% |
| 2020-12-01 | 12.6% | 5.9% |
| 2021-01-01 | 11.4% | 5.6% |
| 2021-02-01 | 10.9% | 5.6% |
| 2021-03-01 | 11.0% | 5.3% |
| 2021-04-01 | 11.2% | 5.3% |
| 2021-05-01 | 10.0% | 5.1% |
| 2021-06-01 | 9.7% | 5.3% |
| 2021-07-01 | 9.5% | 4.8% |
| 2021-08-01 | 9.6% | 4.5% |
| 2021-09-01 | 8.7% | 4.1% |
| 2021-10-01 | 8.3% | 3.9% |
| 2021-11-01 | 8.3% | 3.6% |
| 2021-12-01 | 8.2% | 3.3% |
| 2022-01-01 | 8.4% | 3.4% |
| 2022-02-01 | 8.2% | 3.2% |
| 2022-03-01 | 8.4% | 2.9% |
| 2022-04-01 | 8.2% | 3.0% |
| 2022-05-01 | 7.8% | 3.0% |
| 2022-06-01 | 8.1% | 3.0% |
| 2022-07-01 | 7.8% | 2.8% |
| 2022-08-01 | 7.8% | 3.0% |
| 2022-09-01 | 8.2% | 2.8% |
| 2022-10-01 | 7.9% | 3.0% |
| 2022-11-01 | 8.2% | 3.0% |
| 2022-12-01 | 8.3% | 2.8% |
| 2023-01-01 | 8.1% | 2.8% |
| 2023-02-01 | 8.1% | 2.9% |
| 2023-03-01 | 7.5% | 2.9% |
| 2023-04-01 | 6.6% | 2.9% |
| 2023-05-01 | 7.4% | 3.1% |
| 2023-06-01 | 7.6% | 3.0% |
| 2023-07-01 | 8.1% | 2.8% |
| 2023-08-01 | 8.6% | 3.0% |
| 2023-09-01 | 8.4% | 3.1% |
| 2023-10-01 | 8.8% | 3.1% |
| 2023-11-01 | 8.0% | 3.1% |
| 2023-12-01 | 8.0% | 3.2% |
| 2024-01-01 | 7.3% | 3.2% |
| 2024-02-01 | 8.8% | 3.2% |
| 2024-03-01 | 8.8% | 3.1% |
| 2024-04-01 | 8.3% | 3.2% |
| 2024-05-01 | 9.3% | 3.2% |
| 2024-06-01 | 8.9% | 3.3% |
| 2024-07-01 | 9.1% | 3.5% |
| 2024-08-01 | 9.7% | 3.4% |
| 2024-09-01 | 9.2% | 3.3% |
| 2024-10-01 | 9.5% | 3.4% |
| 2024-11-01 | 9.4% | 3.5% |
| 2024-12-01 | 9.0% | 3.4% |
| 2025-01-01 | 9.0% | 3.3% |
| 2025-02-01 | 9.7% | 3.4% |
| 2025-03-01 | 9.4% | 3.3% |
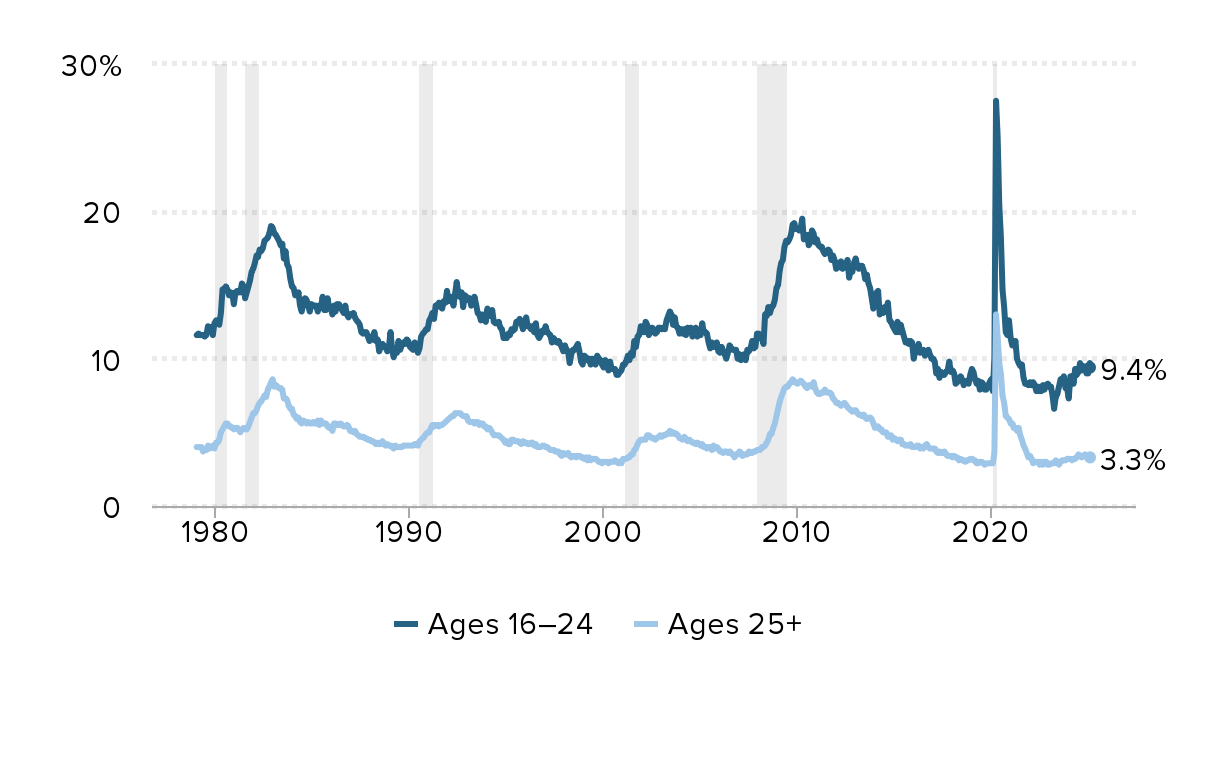
Notes: Shaded areas represent recessions.
Source: Authors' analysis of Bureau of Labor Statistics' Current Population Survey public data.
Workers are less likely to have more than one job in 2023: Share of workers who have more than one job, by age, 2019 and 2023
| 2019 | 2023 | |
|---|---|---|
| Young workers | 5.1% | 4.2% |
| Workers 25+ | 5.3% | 5.1% |
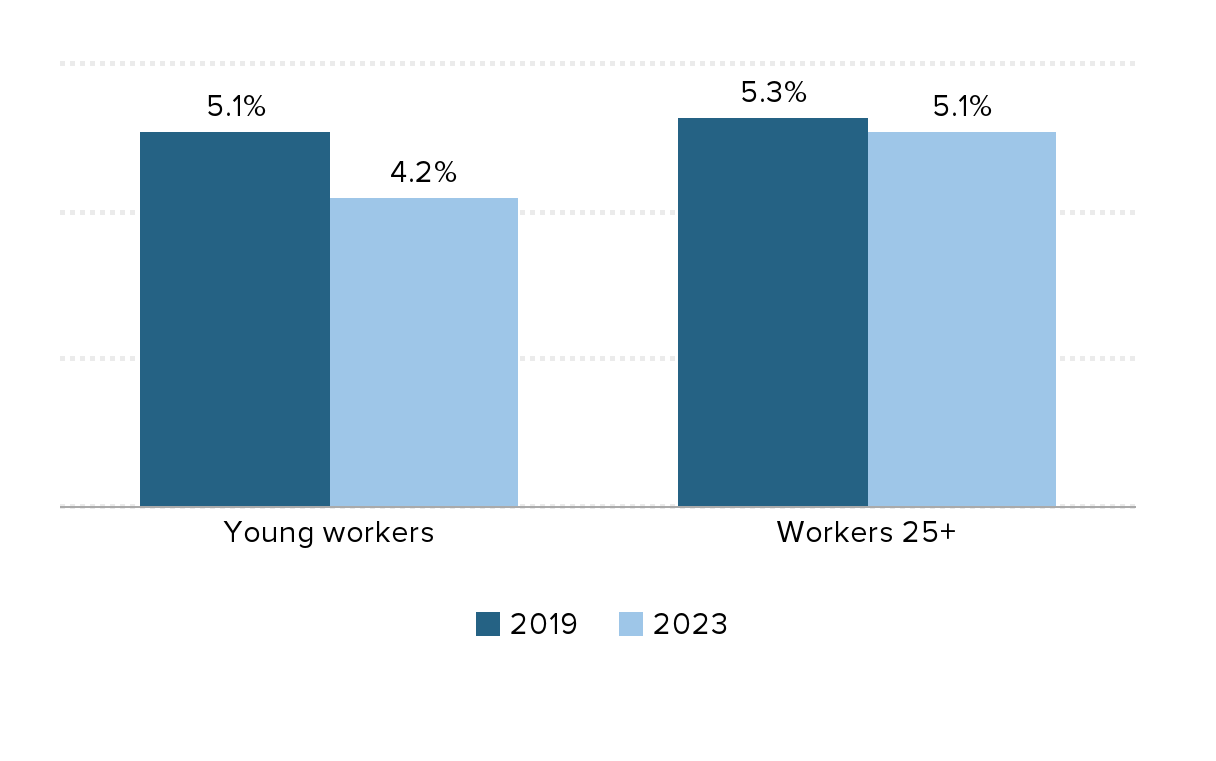
Note: Data for 2023 represent the 12 month average ending in March 2023; data for 2019 represent the calendar year 2019.
Source: Authors' analysis of Current Population Survey basic monthly microdata, EPI Current Population Survey extracts, Version 1.0.40 (2023), https://microdata.epi.org/.
The lowest-wage workers had the strongest wage growth during the pandemic: Real wage growth across the wage distribution, 2019–2022
| Wage group | Wage change |
|---|---|
| Low-wage<br>(10th percentile) | 9.00% |
| Lower-middle-wage<br>(avg 20th–40th) | 3.90% |
| Middle-wage<br>(avg 40th–60th) | 2.40% |
| Upper-middle-wage<br>(avg 60th–80th) | 1.80% |
| High-wage<br>(90th percentile) | 4.90% |
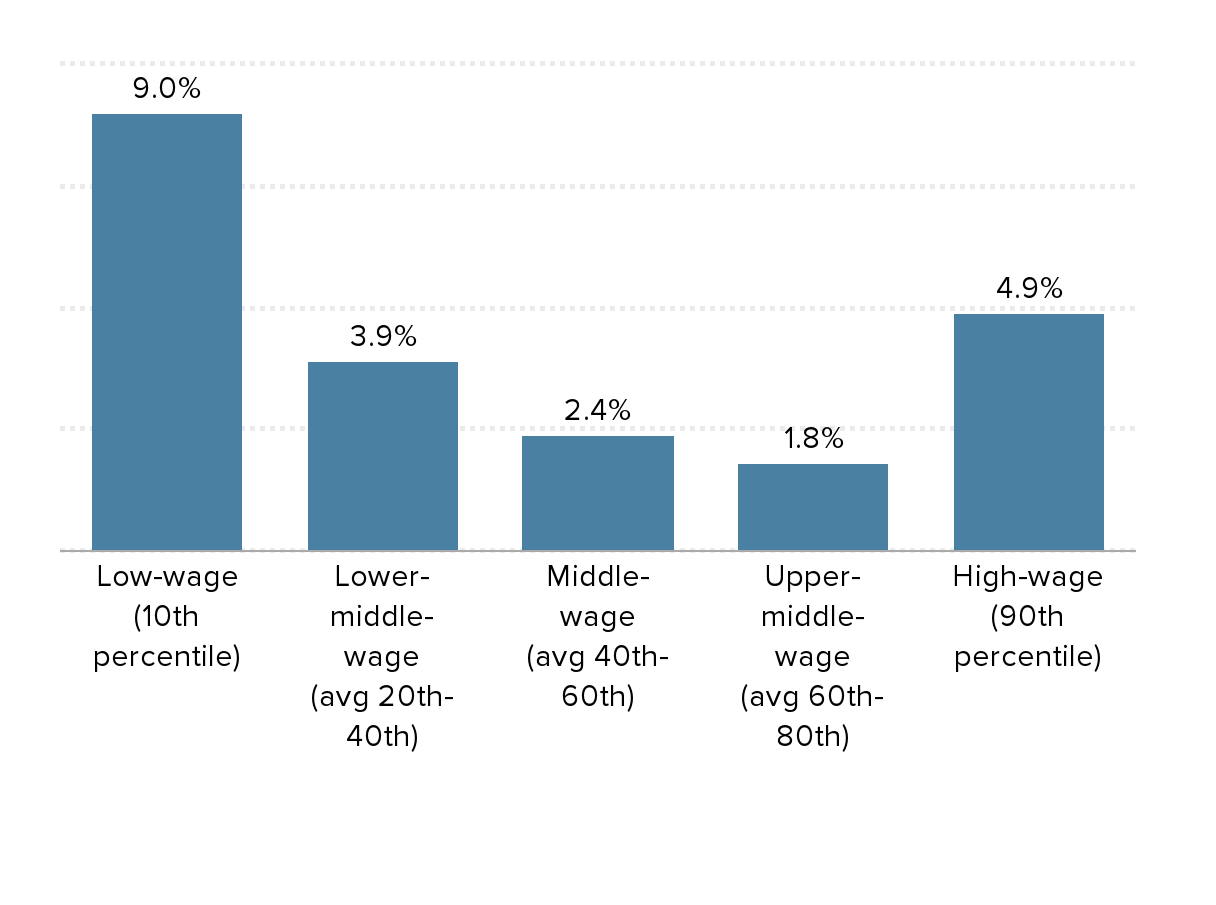
Notes: Low-wage is represented by the 10th percentile and high-wage is represented by the 90th percentile. The lower-middle, middle, and upper-middle-wages are the averages of the 20th–40th percentiles, the 40th–60th percentiles, and the 60th–80th percentiles, respectively.
Source: EPI analysis of the Current Population Survey Outgoing Rotation Group microdata, EPI Current Population Survey Extracts, Version 1.0.37 (2023), https://microdata.epi.org.
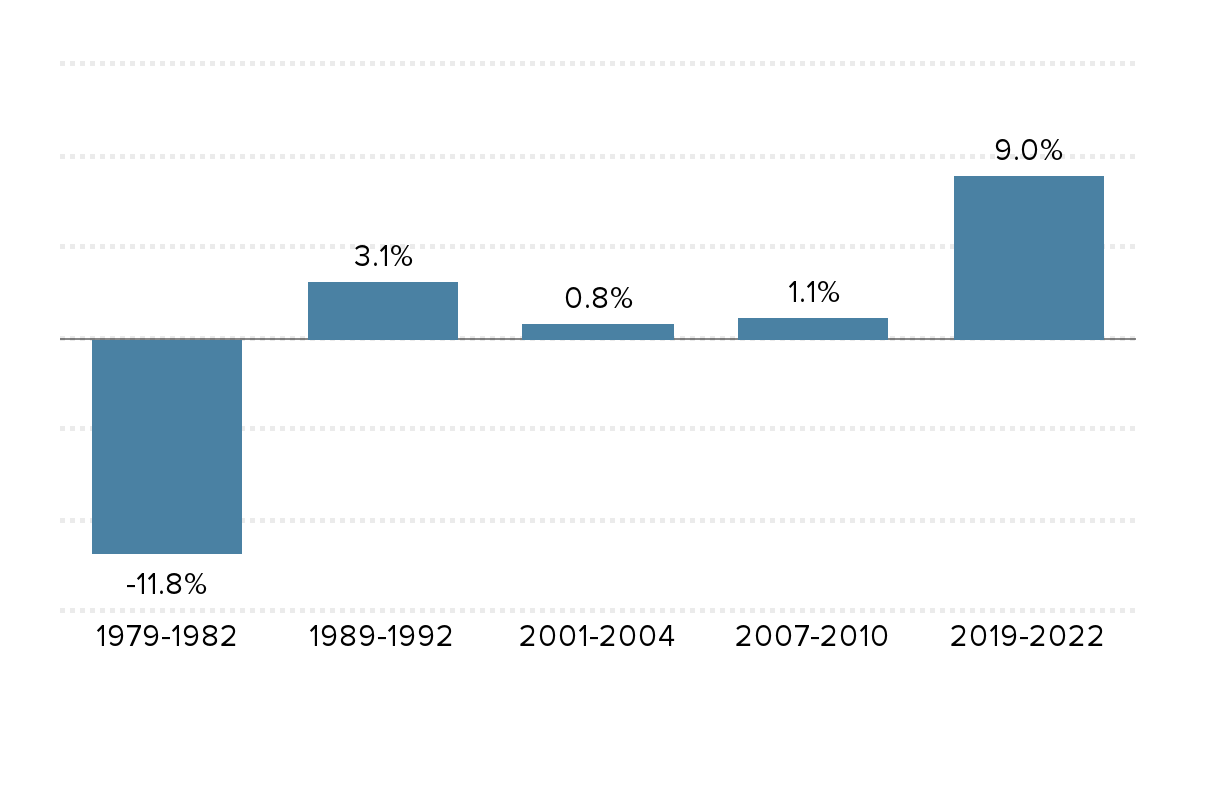
Low-wage workers have experienced stronger-than-usual wage growth in the pandemic business cycle: Real wage changes at the 10th percentile, three years from prior peak, in current and last four business cycles, 1979–2022
| Business cycle | 10th percentile |
|---|---|
| 1979–1982 | -11.8% |
| 1989–1992 | 3.1% |
| 2001–2004 | 0.8% |
| 2007–2010 | 1.1% |
| 2019–2022 | 9.0% |
Source: EPI analysis of the Current Population Survey Outgoing Rotation Group microdata, EPI Current Population Survey Extracts, Version 1.0.37 (2023), https://microdata.epi.org.
Wage growth was strong at the bottom regardless of minimum wage changes: Real wage growth at the 10th percentile among states grouped by presence or size of minimum wage increase, 2019–2022
| Size of change | 10th percentile |
|---|---|
| No minimum wage change | 6.2% |
| ≤10% minimum wage change | 7.0% |
| >10% minimum wage change | 8.5% |
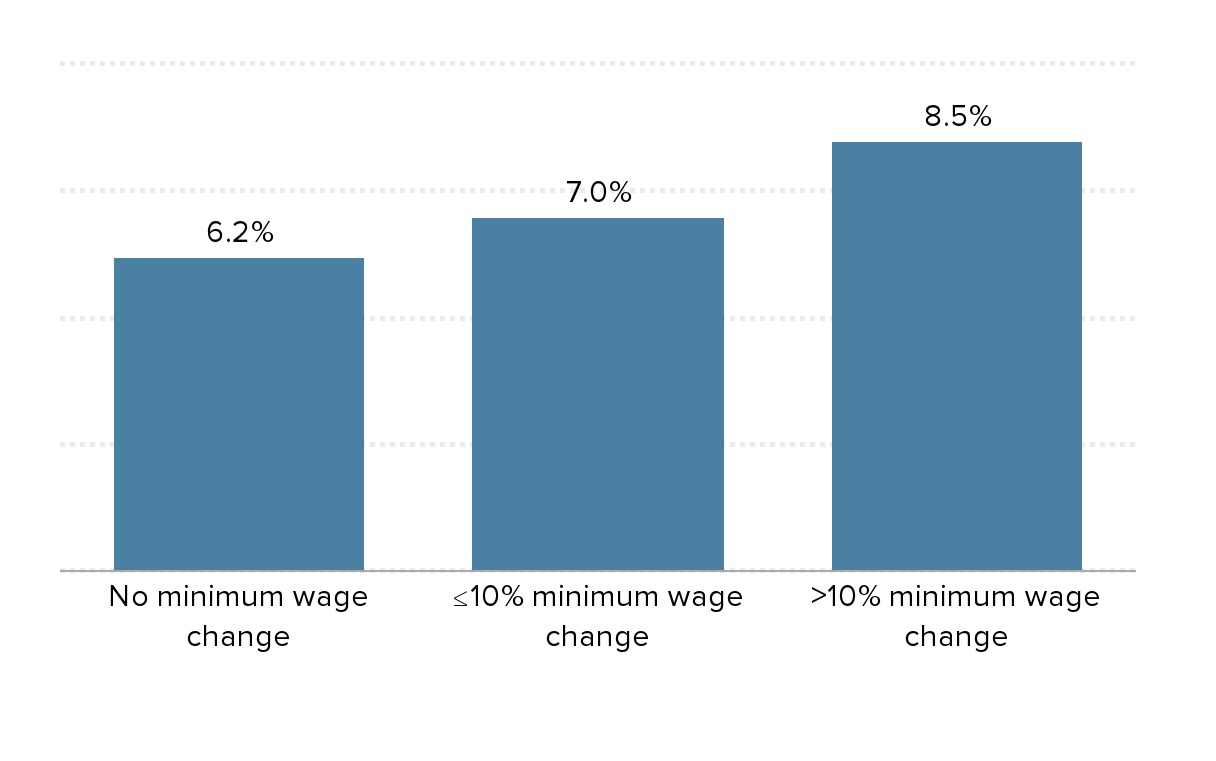
Notes: Figure C details the list of states in each category. See EPI’s minimum wage tracker for the most current state-level minimum wage information.
Source: EPI analysis of the Current Population Survey Outgoing Rotation Group microdata, EPI Current Population Survey Extracts, Version 1.0.37 (2023), https://microdata.epi.org, and EPI analysis of state minimum wage laws.
Real wages rise as prices decelerate faster than nominal wage growth: Year-over-year changes in nominal wages, inflation, and real (inflation-adjusted) wages, 2019 to 2025
| date | Nominal wage growth | Real wage growth | Inflation |
|---|---|---|---|
| 2019-01-01 | 3.3% | 1.7% | 1.6% |
| 2019-02-01 | 3.6% | 2.0% | 1.5% |
| 2019-03-01 | 3.4% | 1.5% | 1.9% |
| 2019-04-01 | 3.3% | 1.2% | 2.0% |
| 2019-05-01 | 3.3% | 1.5% | 1.8% |
| 2019-06-01 | 3.4% | 1.8% | 1.6% |
| 2019-07-01 | 3.4% | 1.6% | 1.8% |
| 2019-08-01 | 3.4% | 1.6% | 1.7% |
| 2019-09-01 | 3.1% | 1.3% | 1.7% |
| 2019-10-01 | 3.1% | 1.4% | 1.8% |
| 2019-11-01 | 3.3% | 1.2% | 2.1% |
| 2019-12-01 | 3.0% | 0.7% | 2.3% |
| 2020-01-01 | 3.0% | 0.5% | 2.5% |
| 2020-02-01 | 3.1% | 0.7% | 2.3% |
| 2020-03-01 | 3.5% | 1.9% | 1.5% |
| 2020-04-01 | 8.1% | 7.7% | 0.3% |
| 2020-05-01 | 6.6% | 6.5% | 0.1% |
| 2020-06-01 | 5.1% | 4.4% | 0.6% |
| 2020-07-01 | 4.9% | 3.8% | 1.0% |
| 2020-08-01 | 4.8% | 3.5% | 1.3% |
| 2020-09-01 | 4.8% | 3.4% | 1.4% |
| 2020-10-01 | 4.7% | 3.5% | 1.2% |
| 2020-11-01 | 4.6% | 3.4% | 1.2% |
| 2020-12-01 | 5.4% | 4.0% | 1.4% |
| 2021-01-01 | 5.2% | 3.8% | 1.4% |
| 2021-02-01 | 5.4% | 3.6% | 1.7% |
| 2021-03-01 | 4.5% | 1.9% | 2.6% |
| 2021-04-01 | 0.6% | -3.4% | 4.2% |
| 2021-05-01 | 2.3% | -2.5% | 5.0% |
| 2021-06-01 | 4.0% | -1.3% | 5.4% |
| 2021-07-01 | 4.3% | -1.0% | 5.4% |
| 2021-08-01 | 4.4% | -0.8% | 5.3% |
| 2021-09-01 | 4.9% | -0.5% | 5.4% |
| 2021-10-01 | 5.4% | -0.8% | 6.2% |
| 2021-11-01 | 5.4% | -1.3% | 6.8% |
| 2021-12-01 | 5.0% | -1.9% | 7.0% |
| 2022-01-01 | 5.7% | -1.7% | 7.5% |
| 2022-02-01 | 5.3% | -2.4% | 7.9% |
| 2022-03-01 | 5.9% | -2.4% | 8.5% |
| 2022-04-01 | 5.7% | -2.3% | 8.3% |
| 2022-05-01 | 5.6% | -2.8% | 8.6% |
| 2022-06-01 | 5.4% | -3.4% | 9.1% |
| 2022-07-01 | 5.5% | -2.8% | 8.5% |
| 2022-08-01 | 5.4% | -2.7% | 8.3% |
| 2022-09-01 | 5.1% | -2.8% | 8.2% |
| 2022-10-01 | 5.0% | -2.6% | 7.7% |
| 2022-11-01 | 5.1% | -1.9% | 7.1% |
| 2022-12-01 | 4.9% | -1.4% | 6.5% |
| 2023-01-01 | 4.5% | -1.8% | 6.4% |
| 2023-02-01 | 4.7% | -1.2% | 6.0% |
| 2023-03-01 | 4.6% | -0.4% | 5.0% |
| 2023-04-01 | 4.6% | -0.3% | 4.9% |
| 2023-05-01 | 4.4% | 0.4% | 4.0% |
| 2023-06-01 | 4.6% | 1.6% | 3.0% |
| 2023-07-01 | 4.6% | 1.4% | 3.2% |
| 2023-08-01 | 4.5% | 0.8% | 3.7% |
| 2023-09-01 | 4.4% | 0.7% | 3.7% |
| 2023-10-01 | 4.2% | 0.9% | 3.2% |
| 2023-11-01 | 4.1% | 0.9% | 3.1% |
| 2023-12-01 | 4.1% | 0.7% | 3.4% |
| 2024-01-01 | 4.3% | 1.2% | 3.1% |
| 2024-02-01 | 4.2% | 1.0% | 3.2% |
| 2024-03-01 | 4.2% | 0.7% | 3.5% |
| 2024-04-01 | 4.0% | 0.6% | 3.4% |
| 2024-05-01 | 4.1% | 0.8% | 3.3% |
| 2024-06-01 | 3.9% | 0.9% | 3.0% |
| 2024-07-01 | 3.6% | 0.7% | 2.9% |
| 2024-08-01 | 4.0% | 1.4% | 2.5% |
| 2024-09-01 | 3.9% | 1.5% | 2.4% |
| 2024-10-01 | 4.1% | 1.5% | 2.6% |
| 2024-11-01 | 4.2% | 1.4% | 2.7% |
| 2024-12-01 | 4.0% | 1.1% | 2.9% |
| 2025-01-01 | 3.9% | 1.0% | 3.0% |
| 2025-02-01 | 4.0% | 2.8% | |
| 2025-03-01 | 3.8% |
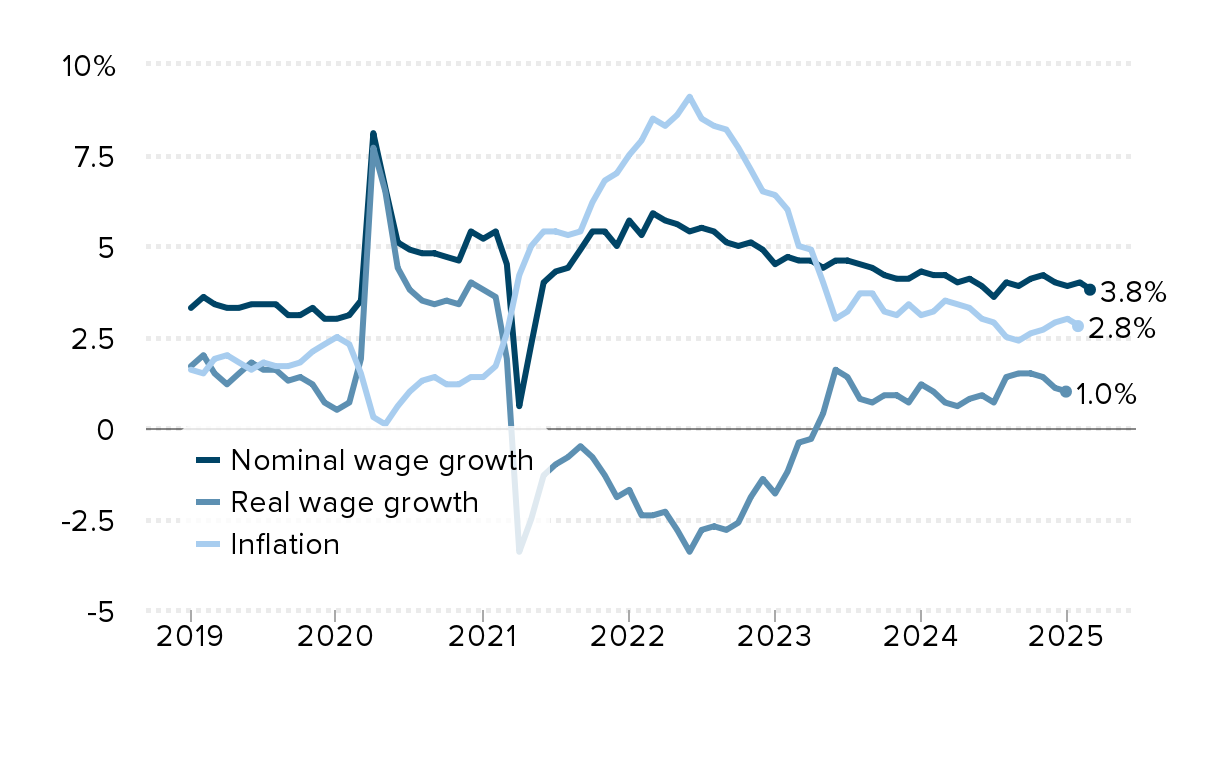
Source: EPI analysis of Bureau of Labor Statistics Current Employment Statistics and Consumer Price Index public data series.
Federal funds
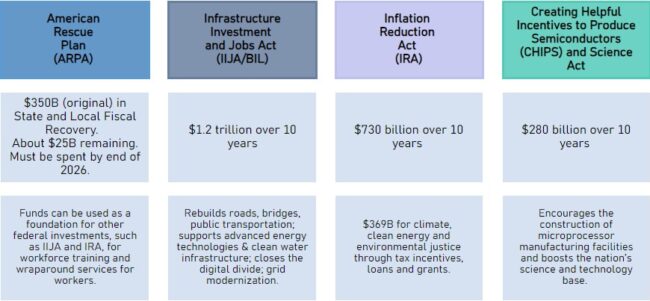
Implementing federal industrial policy: Important potential EARN roles
- Centering worker power, job quality, equity
- Technical assistance with/for partners
- Measuring impact, telling economic story
- Accountability and local-state-federal “feedback loops”
- Organizing + policy-making to shape outcomes
Maximizing opportunities presented by federal BIL, IRA, CHIPS Act investments
- Key state/local labor policy tools to shape job quality & equity outcomes of federal investments
- Prevailing wage
- Apprentice utilization
- Project labor agreements or community benefits agreements
- Local/targeted hire, equity programs, pre-apprenticeship, workforce wrap-around services
- Responsible bidder laws, contractor compliance with fed and state labor laws, “labor peace” agreements, etc.
- Essential public sector and care economy investments
Tapping EARN expertise, scaling up successful policy models

As union membership declines, income inequality increases: Union membership and share of income going to the top 10%, 1917–2021
| Union membership rate | Share of income going to the top 10% | |
|---|---|---|
| 1917 | 11.00% | 45.0% |
| 1918 | 12.10% | 44.0% |
| 1919 | 14.30% | 45.9% |
| 1920 | 17.50% | 44.1% |
| 1921 | 17.60% | 47.4% |
| 1922 | 14.00% | 46.1% |
| 1923 | 11.70% | 43.7% |
| 1924 | 11.30% | 45.7% |
| 1925 | 11.00% | 47.2% |
| 1926 | 10.70% | 47.6% |
| 1927 | 10.60% | 47.1% |
| 1928 | 10.40% | 48.2% |
| 1929 | 10.10% | 47.0% |
| 1930 | 10.70% | 46.3% |
| 1931 | 11.20% | 46.3% |
| 1932 | 11.30% | 48.3% |
| 1933 | 9.50% | 48.0% |
| 1934 | 9.80% | 49.1% |
| 1935 | 10.80% | 48.1% |
| 1936 | 11.10% | 48.4% |
| 1937 | 18.60% | 47.5% |
| 1938 | 23.90% | 47.1% |
| 1939 | 24.80% | 48.6% |
| 1940 | 23.50% | 48.9% |
| 1941 | 25.40% | 47.0% |
| 1942 | 24.20% | 42.3% |
| 1943 | 30.10% | 38.9% |
| 1944 | 32.50% | 36.1% |
| 1945 | 33.40% | 35.3% |
| 1946 | 31.90% | 37.0% |
| 1947 | 31.10% | 36.9% |
| 1948 | 30.50% | 38.9% |
| 1949 | 29.60% | 38.3% |
| 1950 | 30.00% | 39.1% |
| 1951 | 32.40% | 37.9% |
| 1952 | 31.50% | 36.6% |
| 1953 | 33.20% | 35.7% |
| 1954 | 32.70% | 36.0% |
| 1955 | 32.90% | 36.7% |
| 1956 | 33.20% | 35.7% |
| 1957 | 32.00% | 35.7% |
| 1958 | 31.10% | 35.5% |
| 1959 | 31.60% | 36.0% |
| 1960 | 30.70% | 35.5% |
| 1961 | 28.70% | 35.6% |
| 1962 | 29.10% | 36.2% |
| 1963 | 28.50% | 36.6% |
| 1964 | 28.50% | 37.0% |
| 1965 | 28.60% | 36.7% |
| 1966 | 28.70% | 36.3% |
| 1967 | 28.60% | 35.3% |
| 1968 | 28.70% | 35.5% |
| 1969 | 28.30% | 34.1% |
| 1970 | 27.90% | 33.5% |
| 1971 | 27.40% | 34.1% |
| 1972 | 27.50% | 34.4% |
| 1973 | 27.10% | 34.6% |
| 1974 | 26.50% | 33.6% |
| 1975 | 25.70% | 34.0% |
| 1976 | 25.70% | 33.9% |
| 1977 | 25.20% | 34.3% |
| 1978 | 24.70% | 34.0% |
| 1979 | 25.40% | 34.3% |
| 1980 | 23.60% | 33.9% |
| 1981 | 22.30% | 34.3% |
| 1982 | 21.60% | 34.6% |
| 1983 | 20.1% | 35.3% |
| 1984 | 18.8% | 36.5% |
| 1985 | 18.0% | 36.6% |
| 1986 | 17.5% | 36.3% |
| 1987 | 17.0% | 37.5% |
| 1988 | 16.8% | 39.3% |
| 1989 | 16.4% | 38.8% |
| 1990 | 16.0% | 38.8% |
| 1991 | 16.0% | 38.3% |
| 1992 | 15.7% | 39.4% |
| 1993 | 15.7% | 39.1% |
| 1994 | 15.5% | 39.2% |
| 1995 | 14.9% | 39.9% |
| 1996 | 14.5% | 40.8% |
| 1997 | 14.1% | 41.5% |
| 1998 | 13.9% | 41.9% |
| 1999 | 13.9% | 42.3% |
| 2000 | 13.4% | 42.8% |
| 2001 | 13.3% | 42.0% |
| 2002 | 13.3% | 41.5% |
| 2003 | 12.9% | 41.6% |
| 2004 | 12.5% | 42.4% |
| 2005 | 12.5% | 43.6% |
| 2006 | 12.0% | 44.3% |
| 2007 | 12.1% | 44.0% |
| 2008 | 12.4% | 43.6% |
| 2009 | 12.3% | 42.5% |
| 2010 | 11.9% | 43.9% |
| 2011 | 11.8% | 44.3% |
| 2012 | 11.3% | 45.6% |
| 2013 | 11.3% | 44.9% |
| 2014 | 11.1% | 45.6% |
| 2015 | 11.1% | 45.5% |
| 2016 | 10.7% | 45.3% |
| 2017 | 10.7% | 45.5% |
| 2018 | 10.5% | 45.8% |
| 2019 | 10.3% | 45.7% |
| 2020 | 10.8% | 44.4% |
| 2021 | 10.3% | 45.6% |
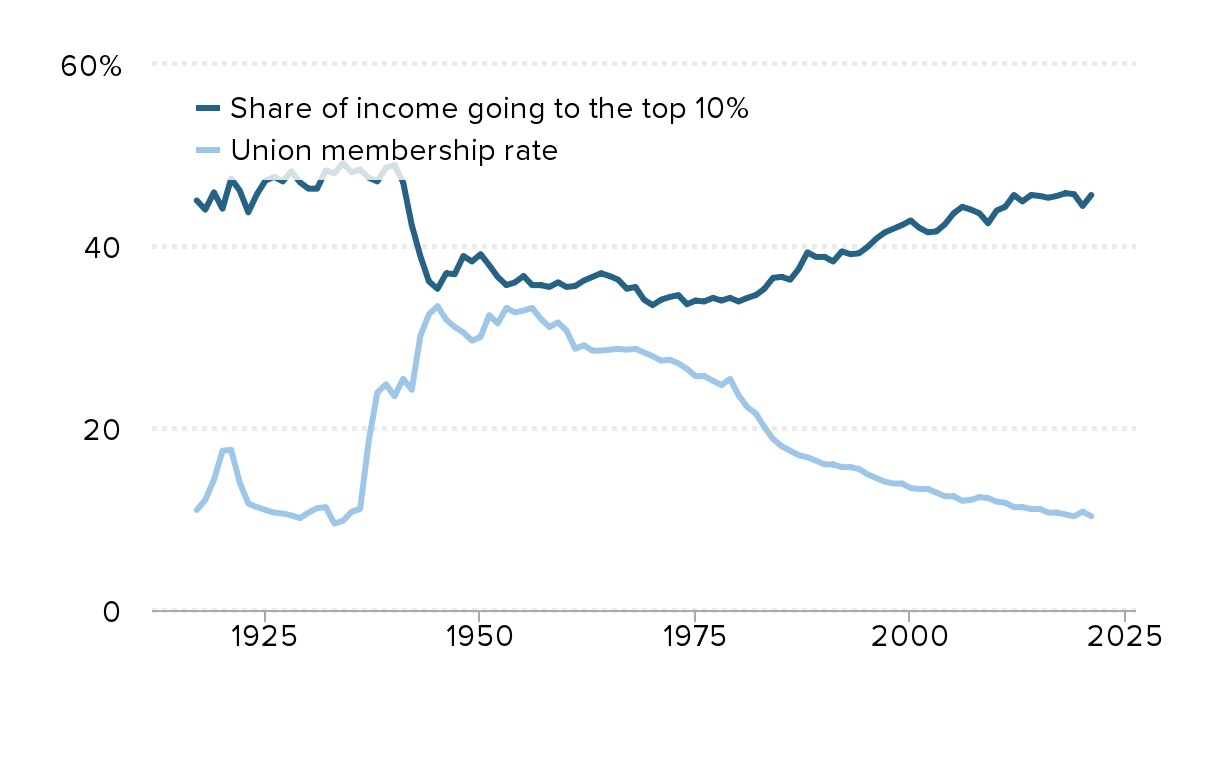
Source: Data on union membership follow the composite series found in Historical Statistics of the United States through 1982, updated through 2021 using Bureau of Labor Statistics, series ID: LUU0204899600. Income inequality (share of income to top 10%) data are from the World Income Database.
Immigration Policy Updates
- More DHS and DOL regulations are expected soon on low-wage temporary migrant workers in the H-2 programs, including farmworkers.
- EPI is meeting with the agencies on these anticipated regulations and will continue to monitor. A regulation with positive impacts for H-2A workers’ wages was finalized earlier this year.
- New EPI report on status and decline of federal labor standards enforcement in agriculture
- Push to ask the administration to expand Temporary Protected Status
Immigration Policy Updates (part 2)
- National politics on immigration:
- Ugly anti-immigrant attacks, particularly on the workforce, in Texas and Florida – should be warning signs for all.
- State of national discourse from conservatives – both in Congress and from presidential candidates is focused on military and enforcement action around the border and further criminalizing immigrants and migration.
- To the extent bipartisan momentum on immigration exists in Congress, it’s focused on guest workers rather than broader paths to citizenship or reforms.
Child Labor
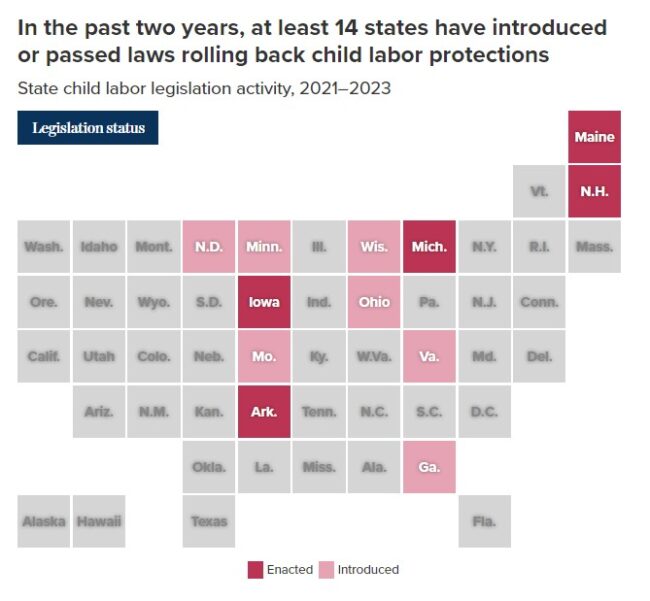
Congress & The Admin: What’s happening this fall
- Return from August recess – Appropriations and other topics
- Avoiding massive cuts, averting government shutdown by end of September
- Child care funding “cliff” also at end of September
- Federal regulations and ongoing implementation of big public investment bills
- Overtime – DOL
- Nursing home staffing – HHS
- IRA wage and apprenticeship guidelines – Treasury
- Final rules at DOL, NLRB, and others
- “Pre-pre 2024” election season
- Other updates
Chasing the Dream
- On August 28, 1963—almost 60 years ago to the day—over 200,000 demonstrators participated in the March on Washington for Jobs and Freedom in Washington, D.C. Though the event is remembered for Dr. Martin Luther King Jr.’s “I Have a Dream” speech, the goals of the protest were largely economic.
- Some of these goals included:
- A national minimum wage act that would “give all Americans a decent standard of living.”
- “Comprehensive and effective” civil rights legislation to guarantee the right to vote, decent housing, adequate and integrated education, and equal access to all public accommodations.
- A broadened, more inclusive Fair Labor Standards Act that would include all areas of employment that were presently excluded.
- A massive federal program to train and place unemployed workers.
- However, these issues continue to plague Black Americans and other marginalized people today. Lack of access to good jobs, fair wages, homeownership, and affordable housing contributes to worsening racial disparities.
Racial economic disparities have persisted over time
- Racial wage gaps have persisted from the 1960s to the present, highlighting enduring inequalities in the labor market. Regarding wages, a typical Black worker is paid 23.4% less per hour than a typical white worker.
- Racial wage gaps persist due to a combination of factors, including stagnant minimum wage, falling union coverage, and systemic factors such as occupational segregation, discrimination in hiring and pay, and inequitable pathways to promotion.
- Minimum wage policy has impacted the Black-white wage gap in at least two distinct ways—lack of coverage for occupations disproportionately held by Black workers and failure to increase the minimum wage over time.
The Black-white median wage gap has widened since 1979: Annual Black-white median wage gap, 1973–2021
| Date | Gap (Median) |
|---|---|
| 1973 | 22.30% |
| 1974 | 19.80% |
| 1975 | 19.10% |
| 1976 | 19.00% |
| 1977 | 18.80% |
| 1978 | 20.10% |
| 1979 | 16.40% |
| 1980 | 17.30% |
| 1981 | 17.50% |
| 1982 | 19.40% |
| 1983 | 18.30% |
| 1984 | 19.50% |
| 1985 | 19.30% |
| 1986 | 20.00% |
| 1987 | 19.60% |
| 1988 | 18.40% |
| 1989 | 20.40% |
| 1990 | 20.10% |
| 1991 | 22.10% |
| 1992 | 20.50% |
| 1993 | 19.90% |
| 1994 | 20.10% |
| 1995 | 20.80% |
| 1996 | 21.80% |
| 1997 | 21.50% |
| 1998 | 20.40% |
| 1999 | 19.60% |
| 2000 | 20.80% |
| 2001 | 22.60% |
| 2002 | 21.30% |
| 2003 | 20.20% |
| 2004 | 19.90% |
| 2005 | 21.10% |
| 2006 | 20.60% |
| 2007 | 22.30% |
| 2008 | 23.10% |
| 2009 | 21.30% |
| 2010 | 21.20% |
| 2011 | 22.20% |
| 2012 | 24.60% |
| 2013 | 22.50% |
| 2014 | 24.10% |
| 2015 | 25.60% |
| 2016 | 23.00% |
| 2017 | 25.30% |
| 2018 | 26.70% |
| 2019 | 24.40% |
| 2020 | 23.60% |
| 2021 | 23.40% |
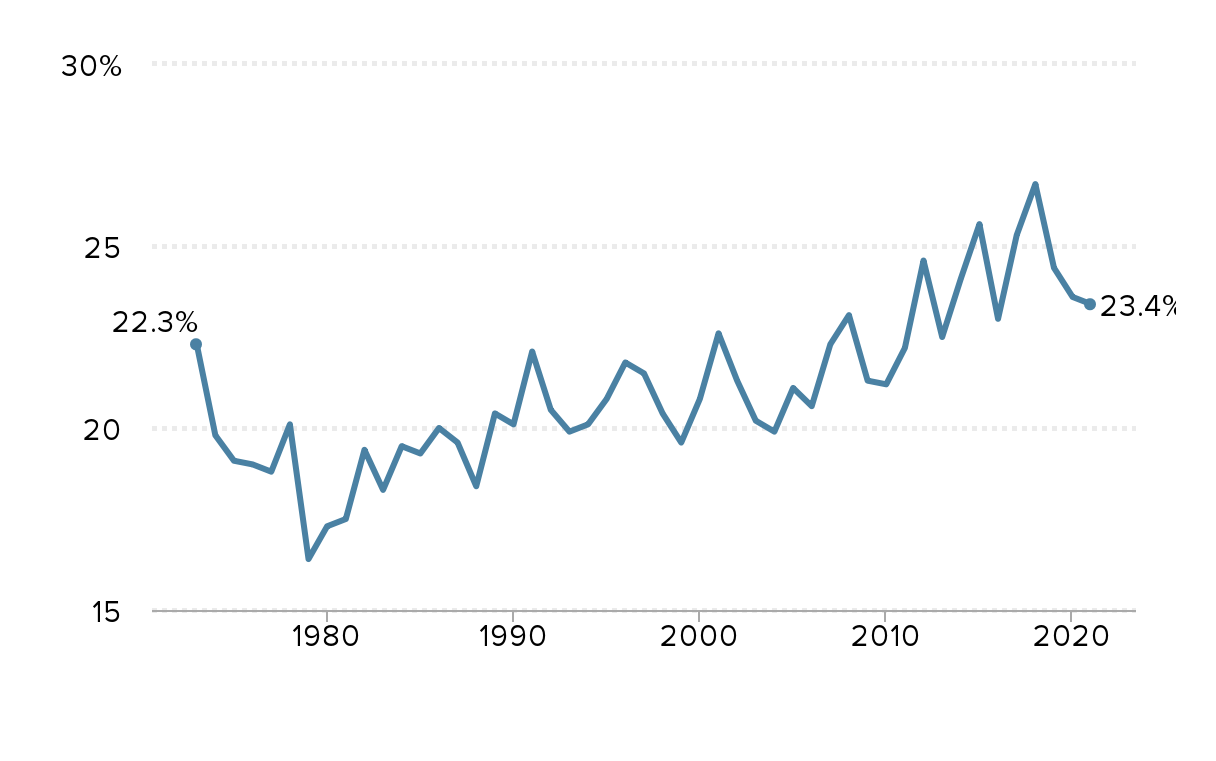
Note: Wages are adjusted into 2021 dollars by the CPI-U-RS. The regression-based gap is based on average wages and controls for gender, race and ethnicity, education, age, and geographic division. The log of the hourly wage is the dependent variable.
Source: EPI analysis of Current Population Survey Outgoing Rotation Group microdata, https://microdata.epi.org.
What’s Next?
- Policymakers need both targeted and race-conscious policies to address the root issue of racism within U.S. institutions, make scalable investments in eliminating racial inequality, and achieve genuine racial equity.
- This includes legislation like raising the minimum wage to at least $17 an hour and protecting workers’ right to unionize.
- For wealth accumulation, a direct federal reparations program for descendants of enslaved people to close the gap.
- Additionally, the correction of inequities in home appraisals through policy solutions is of utmost importance, particularly for Black homeowners.
- Essential rights and freedoms include access to voting and freedom from overpolicing.
Minimum Wage
- The Raise the Wage Act of 2023, introduced in the U.S. House of Representatives and U.S. Senate on July 25, 2023, would gradually raise the federal minimum wage to $17 an hour by 2028.
- The bill would also gradually raise and then eliminate subminimum wages for tipped workers, workers with disabilities, and youth workers, so that all workers covered by the Fair Labor Standards Act (FLSA) would be at the same wage level.
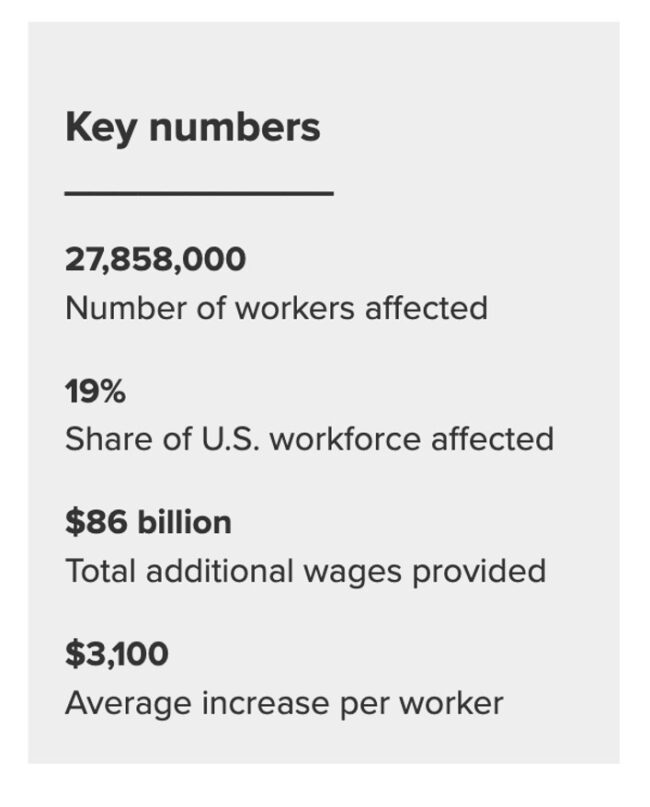
Impact of a $17 an hour minimum wage + the history of the MW
- According to EPI analysis:
- Approximately 30 percent of Black and Brown workers, and nearly a third of workers earning low wages would be affected by this increase in the federal minimum wage.
- EPI has conducted further analysis based on gender, age, family income and state impacts of the increase.
- EPI has also released a blog showcasing the history of workers who have been left behind by some of the progress on MW.
The real value of minimum wages has fluctuated over time: The inflation-adjusted value of the federal minimum wage each time it has been increased
| Year Effective | Minimum Wage (nominal) | Inflation-Adjusted Value of Minimum Wage (2023$) |
|---|---|---|
| 1938 | $0.25 | $4.74 |
| 1939 | $0.30 | $5.69 |
| 1945 | $0.40 | $5.84 |
| 1950 | $0.75 | $8.47 |
| 1956 | $1.00 | $9.88 |
| 1961 | $1.15 | $10.19 |
| 1963 | $1.25 | $10.81 |
| 1967 | $1.40 | $11.27 |
| 1968 | $1.60 | $12.50 |
| 1974 | $2.00 | $11.30 |
| 1975 | $2.10 | $11.13 |
| 1976 | $2.30 | $11.45 |
| 1978 | $2.65 | $11.79 |
| 1979 | $2.90 | $11.94 |
| 1980 | $3.10 | $11.49 |
| 1981 | $3.35 | $11.23 |
| 1990 | $3.80 | $8.74 |
| 1991 | $4.25 | $9.38 |
| 1996 | $4.75 | $9.15 |
| 1997 | $5.15 | $9.75 |
| 2007 | $5.85 | $8.62 |
| 2008 | $6.55 | $9.15 |
| 2009 | $7.25 | $10.33 |
Source: All values in July 2023 dollars, adjusted using the CPI-U in 2023 chained to the CPI-U-RS (1978–2022) and CPI-U-X1 (1967–1977) and CPI-U (1966 and before). Calculations by Ben Zipperer, Economic Policy Institute.