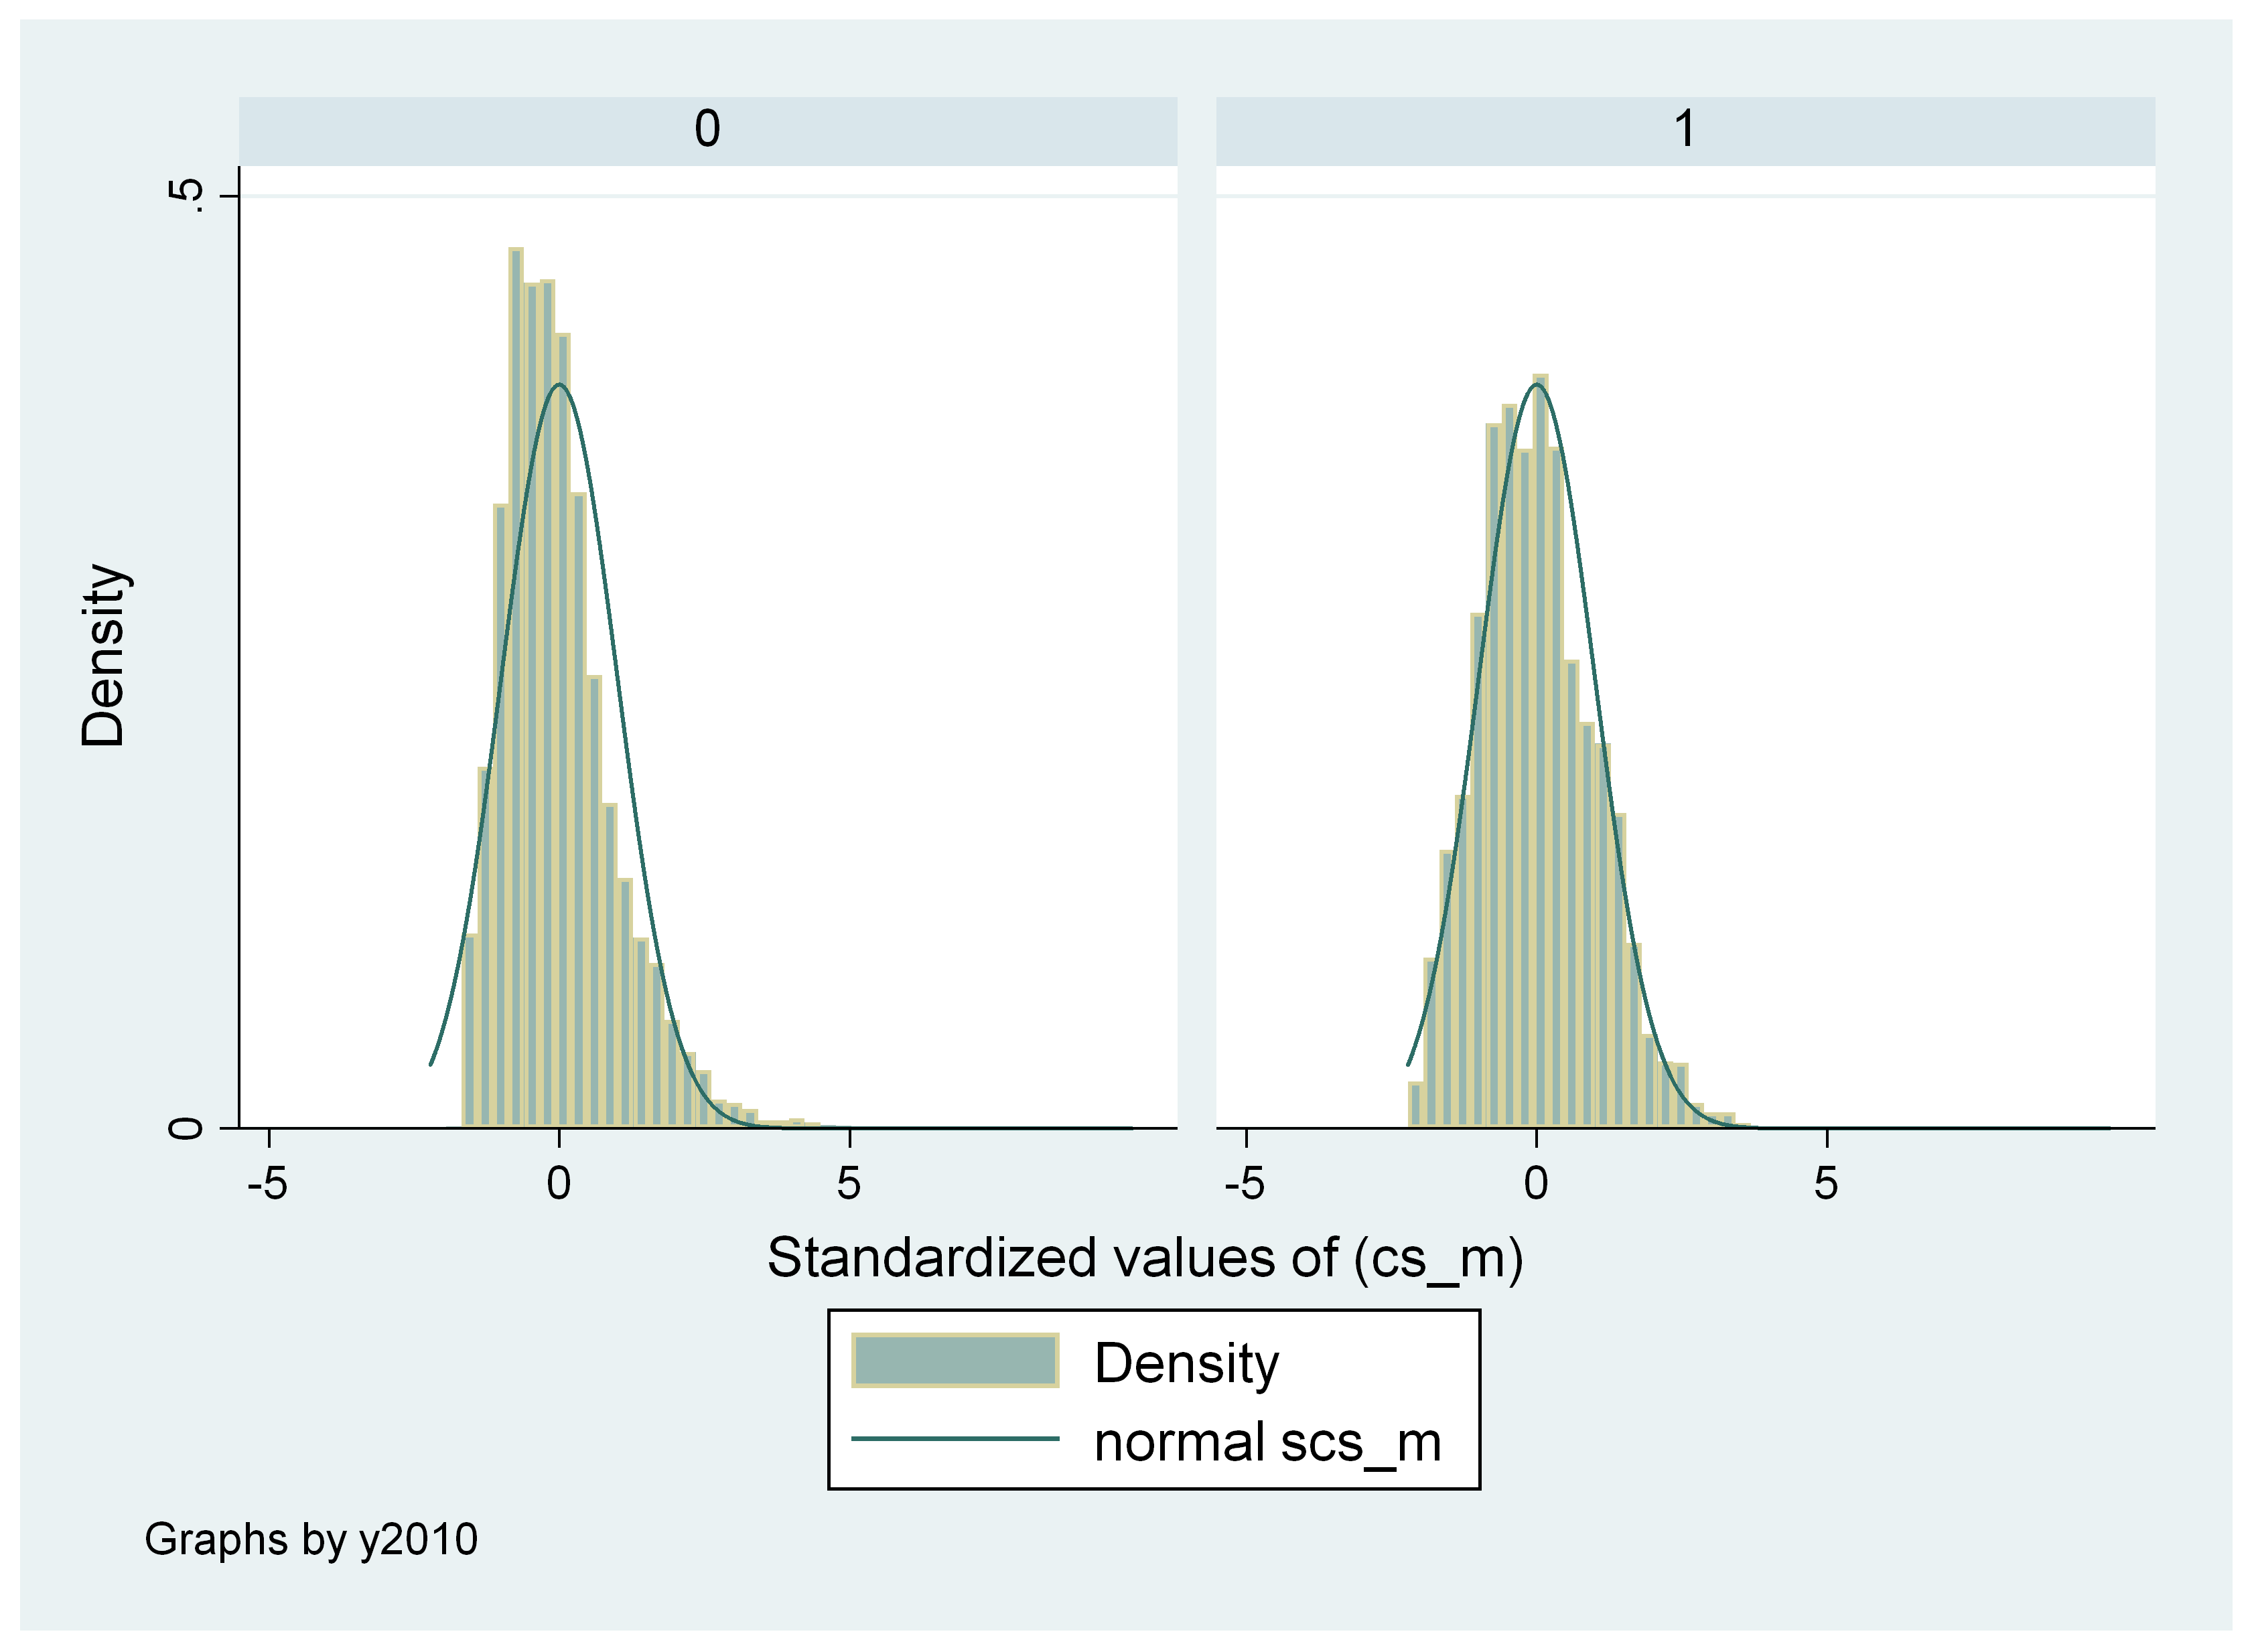
Scale scores, 1998 (left) and 2010 (right) Share on Facebook Tweet this chart EmbedCopy the code below to embed this chart on your website.<iframe width="100%" height="460" src="https://www.epi.org?p=133201&view=embed&embed_template=charts_v2013_08_21&embed_date=20240425&onp=133201&utm_source=epi_press&utm_medium=chart_embed&utm_campaign=charts_v2" frameborder="0"></iframe> Download image Previous chart: « Reading and math achievement gaps, and principal noncognitive skills gaps between high-SES and low-SES children at the beginning of kindergarten in 2010–2011, under unadjusted and clustered models Next chart: Distribution of standardized scale and theta scores in reading, by year »