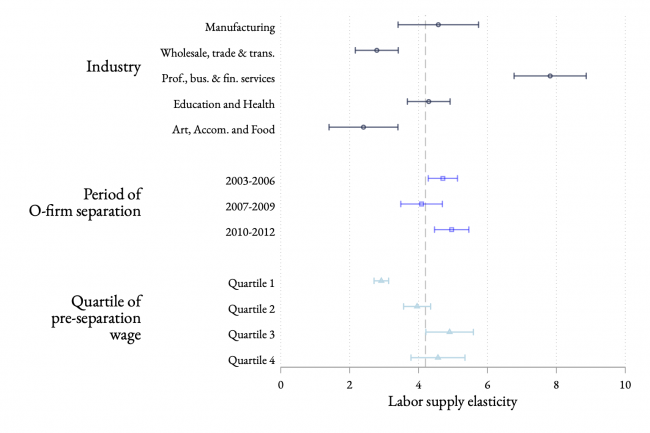
Figure BLabor supply elasticities by sector, time period, and quartile Source: Authors’ analysis of Bassier, Dube, and Naidu (2022). Share on Facebook Tweet this chart EmbedCopy the code below to embed this chart on your website.<iframe width="100%" height="460" src="https://www.epi.org?p=247509&view=embed&embed_template=charts_v2013_08_21&embed_date=20261028&onp=247509&utm_source=epi_press&utm_medium=chart_embed&utm_campaign=charts_v2" frameborder="0"></iframe> Download image This chart appears in: Naidu-Carr Previous chart: « Job seeker ratio, 2000–2021 Next chart: State Home Health Wages| Appendix Table 2| Difference between current hourly wages and proposed hourly wages and proposed hourly wage by state »