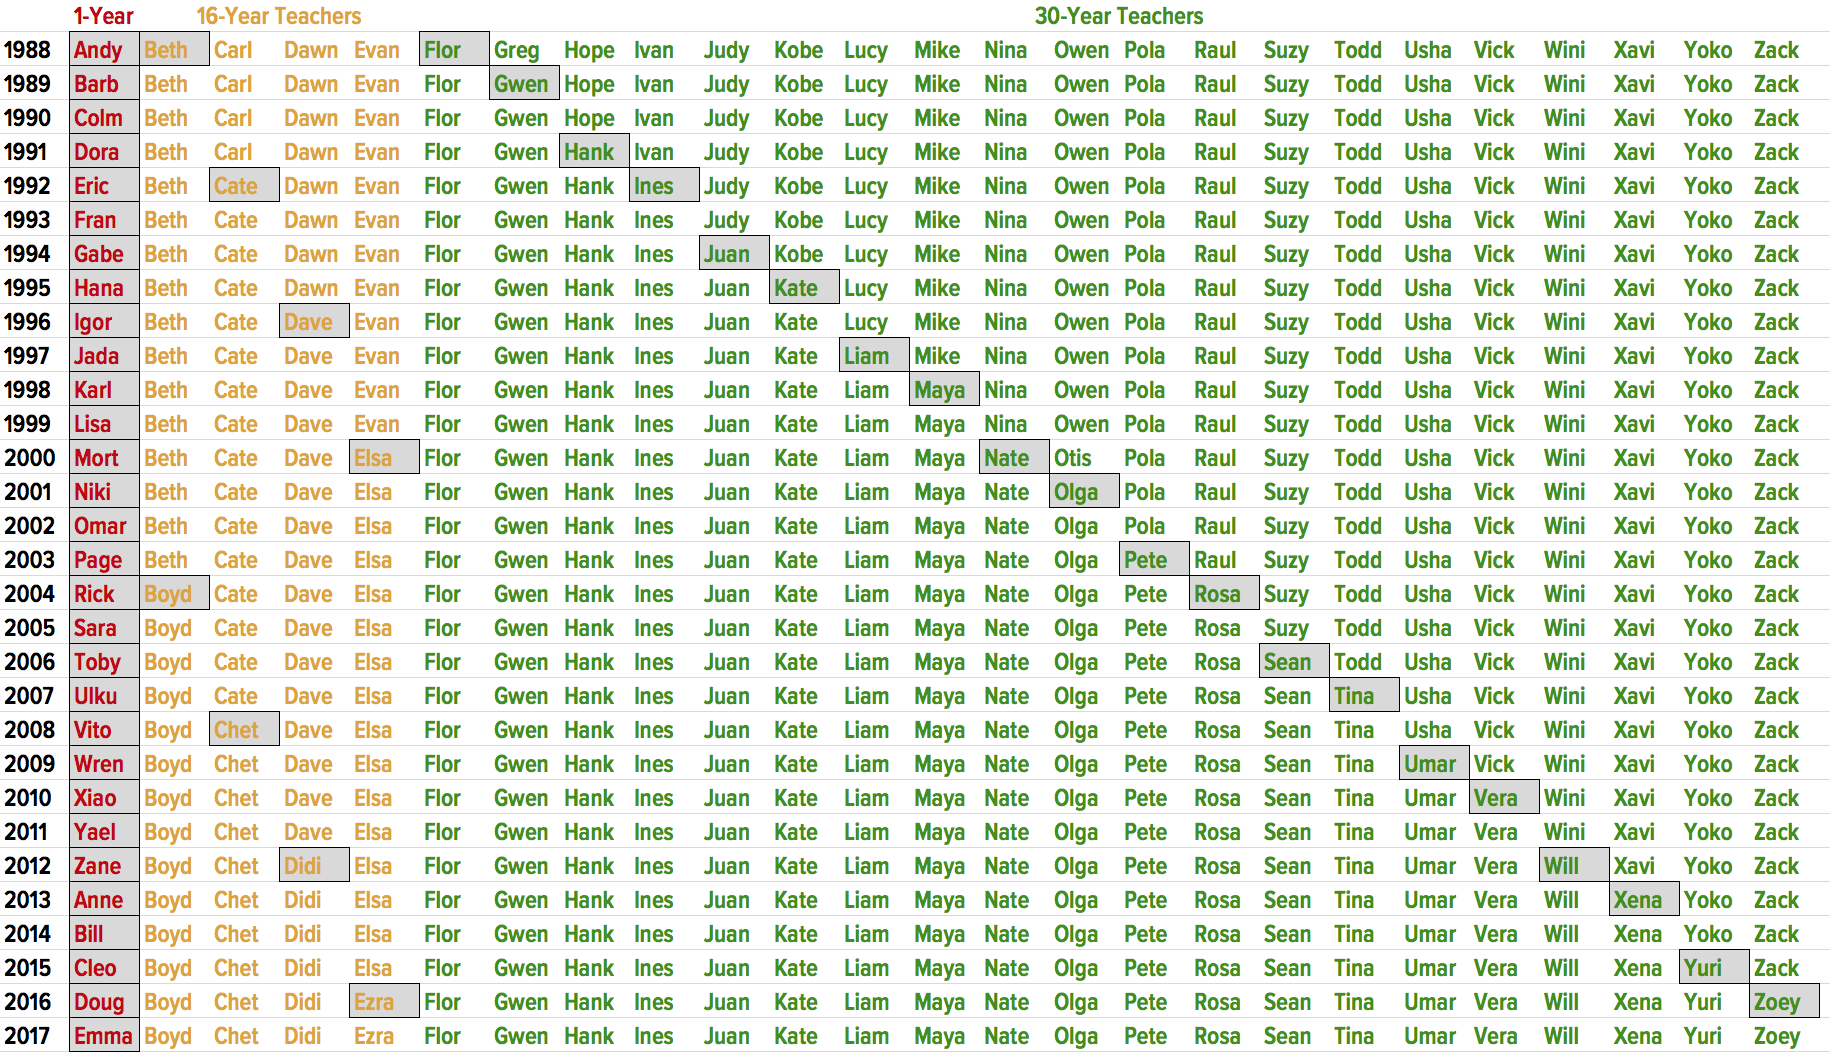
Appendix TableThe ABC School's 30-year staffing history: an illustrationSource: Shares of nonvesting, mobile, and career teachers are adapted from EPI analysis of CalSTRS experience studies. Share on Facebook Tweet this chart EmbedCopy the code below to embed this chart on your website.<iframe width="100%" height="460" src="https://www.epi.org?p=136811&view=embed&embed_template=charts_v2013_08_21&embed_date=20260726&onp=136811&utm_source=epi_press&utm_medium=chart_embed&utm_campaign=charts_v2" frameborder="0"></iframe> Download image This chart appears in: Teachers and schools are well served by teacher pensions Previous chart: « Household savings rates by income percentile, 1989–2013 Next chart: Productivity and hourly pay grew faster when corporate tax rates were higher: Statutory corporate tax rate and 5-year average of productivity and real hourly pay growth, 1953–2016 »