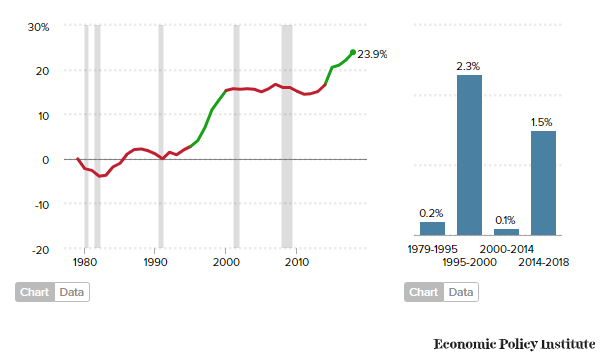
FigureReal annual earnings of the bottom 90% only saw gains when the labor market was the tightest Share on Facebook Tweet this chart EmbedCopy the code below to embed this chart on your website.<iframe width="100%" height="460" src="https://www.epi.org?p=178879&view=embed&embed_template=charts_v2013_08_21&embed_date=20261024&onp=178879&utm_source=epi_press&utm_medium=chart_embed&utm_campaign=charts_v2" frameborder="0"></iframe> Download image Previous chart: « Consistent positive growth in only 9 of the last 39 years: Cumulative and annualized change in real median hourly wages for various periods, 1979-2018 Next chart: The 10 occupations with the largest projected job growth »