Figure A
Percentage of workforce represented by a union, 1880–2012
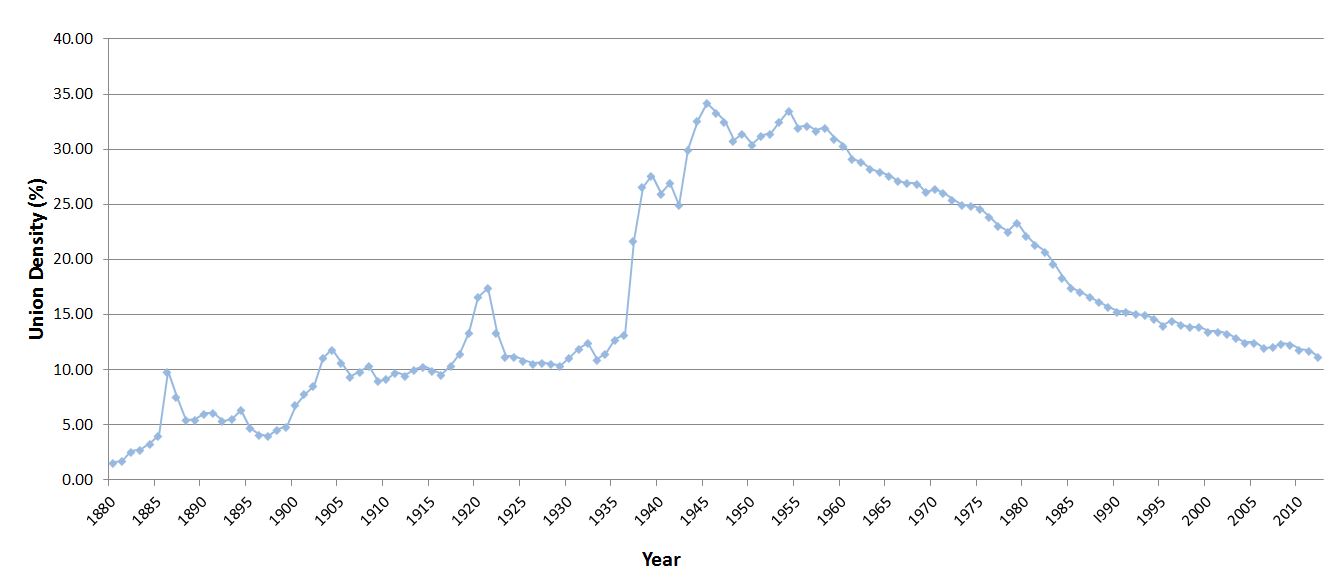

Source: Freeman (1998), Hirsch and MacPherson, and Union Stats
This chart appears in:
Previous chart: « Impact of labor market concentration on wages, 1977–2009
Next chart: Change in employment share by region between 1979 and 2017 »