What to Watch on Jobs Day? Hopeful signs of stronger wage growth
More and more analysts, including many at the Fed, seem to have decided that the U.S. economy has reached full employment. They might be right, but the data on this is far from a slam dunk—and the costs of prematurely declaring full employment and working to slow the recovery far exceed the costs of waiting too long to restrain growth and allowing some wage and price inflation.
While the unemployment rate has ticked down considerably over the last few years, there still seems to be considerable slack in labor force participation, as evidenced most strongly in quite depressed employment-to-population ratios of even prime-aged (25-54 year old) workers. If this weren’t the case—if the apparent slack in these employment and participation numbers wasn’t real—we would be seeing faster wage growth as employers bid up wages to attract and retain the workers they want. So, what am I looking for in Friday’s jobs report, and what do we need to see to validate judgements that we have attained genuine full employment? Signs of stronger wage growth.
Year-over-year nominal wage growth has picked up over the last several years (as shown in the figure below). It’s now at about 2.7 percent growth, up from 2.4 percent the previous year, and up from an average of about 2.0 percent in 2010 through 2014. While this is certainly a welcome sign, it is still below levels consistent with the Federal Reserve’s 2 percent inflation target combined with trend productivity growth of 1.5 percent.
Earlier this week, the New York Times’s Neil Irwin wrote a provocative story on why he thinks this is too-ambitious a nominal wage target. His argument relies on current inflation rates and productivity growth. As he puts it: “Consider a simple model for how much the average worker’s pay ought to be rising: You could simply add together the productivity growth rate—how rapidly the output generated by each hour of labor is increasing—and the inflation rate, which tells us how quickly prices are rising.” According to this reasoning, recent nominal wage growth has come in right on target if one uses current estimates of inflation and productivity.
But we’d argue strongly that you shouldn’t use current estimates of inflation and productivity. Instead, you should use the Fed’s stated long-run inflation target and the best available estimates on the long-run trend in productivity. This difference matters.
Nominal wage growth has been far below target in the recovery: Year-over-year change in private-sector nominal average hourly earnings, 2007–2017
| Date | All nonfarm employees | Production/nonsupervisory workers |
|---|---|---|
| Mar-2007 | 3.44% | 4.17% |
| Apr-2007 | 3.13% | 3.85% |
| May-2007 | 3.53% | 4.14% |
| Jun-2007 | 3.61% | 4.13% |
| Jul-2007 | 3.25% | 4.05% |
| Aug-2007 | 3.35% | 4.04% |
| Sep-2007 | 3.09% | 4.09% |
| Oct-2007 | 3.03% | 3.72% |
| Nov-2007 | 3.07% | 3.89% |
| Dec-2007 | 2.92% | 3.75% |
| Jan-2008 | 2.91% | 3.80% |
| Feb-2008 | 2.85% | 3.79% |
| Mar-2008 | 3.04% | 3.71% |
| Apr-2008 | 2.89% | 3.70% |
| May-2008 | 3.07% | 3.69% |
| Jun-2008 | 2.67% | 3.62% |
| Jul-2008 | 3.05% | 3.67% |
| Aug-2008 | 3.33% | 3.89% |
| Sep-2008 | 3.28% | 3.70% |
| Oct-2008 | 3.32% | 3.93% |
| Nov-2008 | 3.50% | 3.80% |
| Dec-2008 | 3.59% | 3.90% |
| Jan-2009 | 3.58% | 3.72% |
| Feb-2009 | 3.43% | 3.65% |
| Mar-2009 | 3.28% | 3.53% |
| Apr-2009 | 3.37% | 3.35% |
| May-2009 | 2.93% | 3.11% |
| Jun-2009 | 2.88% | 2.88% |
| Jul-2009 | 2.69% | 2.76% |
| Aug-2009 | 2.44% | 2.64% |
| Sep-2009 | 2.44% | 2.75% |
| Oct-2009 | 2.53% | 2.68% |
| Nov-2009 | 2.15% | 2.73% |
| Dec-2009 | 1.96% | 2.50% |
| Jan-2010 | 2.09% | 2.66% |
| Feb-2010 | 2.09% | 2.55% |
| Mar-2010 | 1.81% | 2.27% |
| Apr-2010 | 1.81% | 2.38% |
| May-2010 | 1.90% | 2.54% |
| Jun-2010 | 1.76% | 2.53% |
| Jul-2010 | 1.85% | 2.42% |
| Aug-2010 | 1.75% | 2.36% |
| Sep-2010 | 1.84% | 2.19% |
| Oct-2010 | 1.93% | 2.51% |
| Nov-2010 | 1.79% | 2.18% |
| Dec-2010 | 1.74% | 2.02% |
| Jan-2011 | 1.92% | 2.17% |
| Feb-2011 | 1.83% | 2.06% |
| Mar-2011 | 1.83% | 2.06% |
| Apr-2011 | 1.87% | 2.11% |
| May-2011 | 2.04% | 2.05% |
| Jun-2011 | 2.13% | 2.05% |
| Jul-2011 | 2.30% | 2.26% |
| Aug-2011 | 1.95% | 1.99% |
| Sep-2011 | 1.94% | 1.99% |
| Oct-2011 | 2.07% | 1.72% |
| Nov-2011 | 1.98% | 1.82% |
| Dec-2011 | 2.07% | 1.87% |
| Jan-2012 | 1.79% | 1.40% |
| Feb-2012 | 1.79% | 1.45% |
| Mar-2012 | 2.14% | 1.71% |
| Apr-2012 | 2.09% | 1.65% |
| May-2012 | 1.74% | 1.44% |
| Jun-2012 | 1.96% | 1.54% |
| Jul-2012 | 1.69% | 1.33% |
| Aug-2012 | 1.86% | 1.33% |
| Sep-2012 | 1.99% | 1.38% |
| Oct-2012 | 1.51% | 1.28% |
| Nov-2012 | 1.94% | 1.43% |
| Dec-2012 | 2.11% | 1.58% |
| Jan-2013 | 2.06% | 1.89% |
| Feb-2013 | 2.19% | 2.04% |
| Mar-2013 | 1.88% | 1.88% |
| Apr-2013 | 1.97% | 1.78% |
| May-2013 | 2.14% | 1.93% |
| Jun-2013 | 2.17% | 2.03% |
| Jul-2013 | 2.04% | 2.03% |
| Aug-2013 | 2.26% | 2.23% |
| Sep-2013 | 2.08% | 2.28% |
| Oct-2013 | 2.25% | 2.27% |
| Nov-2013 | 2.20% | 2.37% |
| Dec-2013 | 1.98% | 2.26% |
| Jan-2014 | 2.02% | 2.31% |
| Feb-2014 | 2.23% | 2.50% |
| Mar-2014 | 2.14% | 2.35% |
| Apr-2014 | 2.01% | 2.40% |
| May-2014 | 2.13% | 2.44% |
| Jun-2014 | 2.00% | 2.34% |
| Jul-2014 | 2.09% | 2.38% |
| Aug-2014 | 2.21% | 2.43% |
| Sep-2014 | 2.04% | 2.27% |
| Oct-2014 | 2.03% | 2.27% |
| Nov-2014 | 2.03% | 2.21% |
| Dec-2014 | 1.86% | 1.92% |
| Jan-2015 | 2.19% | 2.01% |
| Feb-2015 | 1.93% | 1.61% |
| Mar-2015 | 2.22% | 2.00% |
| Apr-2015 | 2.26% | 2.00% |
| May-2015 | 2.30% | 2.14% |
| Jun-2015 | 2.09% | 1.99% |
| Jul-2015 | 2.21% | 2.04% |
| Aug-2015 | 2.24% | 2.08% |
| Sep-2015 | 2.32% | 2.13% |
| Oct-2015 | 2.56% | 2.32% |
| Nov-2015 | 2.39% | 2.12% |
| Dec-2015 | 2.52% | 2.56% |
| Jan-2016 | 2.51% | 2.45% |
| Feb-2016 | 2.38% | 2.45% |
| Mar-2016 | 2.45% | 2.44% |
| Apr-2016 | 2.61% | 2.58% |
| May-2016 | 2.52% | 2.33% |
| Jun-2016 | 2.64% | 2.52% |
| Jul-2016 | 2.76% | 2.61% |
| Aug-2016 | 2.55% | 2.46% |
| Sep-2016 | 2.75% | 2.65% |
| Oct-2016 | 2.74% | 2.50% |
| Nov-2016 | 2.65% | 2.50% |
| Dec-2016 | 2.85% | 2.54% |
| Jan-2017 | 2.56% | 2.39% |
| Feb-2017 | 2.84% | 2.48% |
| Mar-2017 | 2.63% | 2.34% |
| Apr-2017 | 2.51% | 2.38% |
| May-2017 | 2.46% | 2.42% |
*Nominal wage growth consistent with the Federal Reserve Board's 2 percent inflation target, 1.5 percent productivity growth, and a stable labor share of income.
Source: EPI analysis of Bureau of Labor Statistics Current Employment Statistics public data series
I’ll start with inflation. The Fed’s inflation target is 2.0 percent. The Fed’s key inflation target is based on core personal consumption expenditures (PCE). Over the last year, it rose only 1.7 percent. It’s important that we recognize this as an average not a ceiling, meaning that the recent long period of sub-2.0 percent price inflation should be followed by an extended period when price growth exceeds 2 percent annually for a spell. But because price inflation is strongly influenced by wage inflation, if the Fed is serious about wanting 2 percent price inflation in the long run, it cannot have nominal wages rise as slowly as they have in recent years. Irwin’s implicit recommendation that we declare nominal wages growing fast enough would lock in price inflation below the Fed’s long-run target.
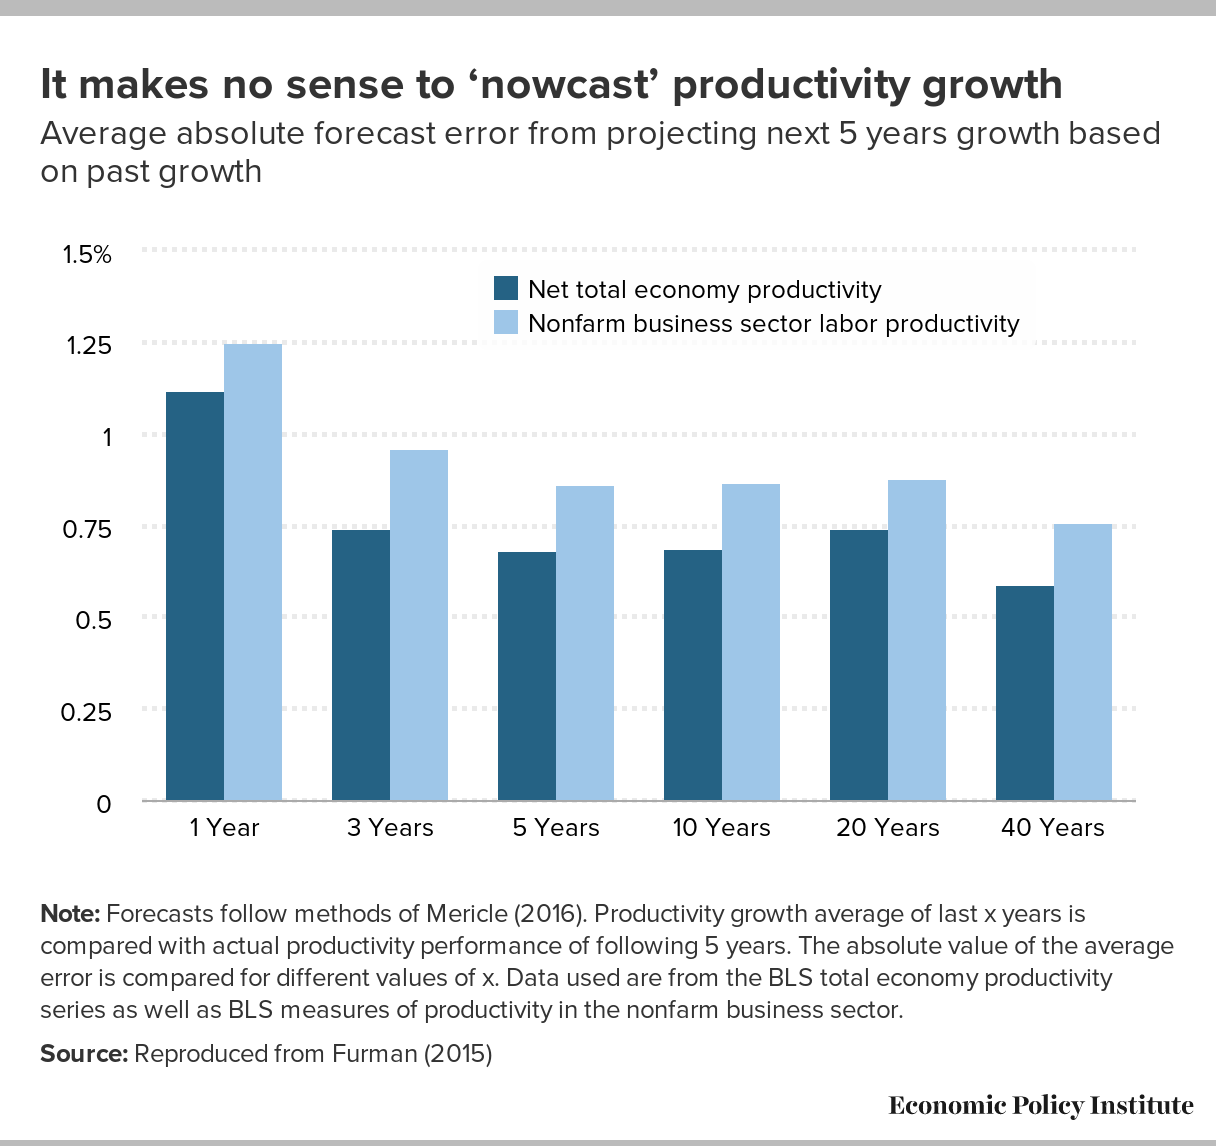
Second, why is it important to target the long-run trend in productivity growth rather than current estimates? Because “nowcasting” productivity growth consistently fails. This long-run trend in productivity is universally thought to be higher than the growth we’ve seen in very recent years, which has seen a pronounced slowdown in productivity growth. But taking this slower productivity as an unchangeable feature of the U.S. economy would be a mistake. In fact, it could well be that slow wage growth is a culprit for slow productivity growth. In that case, pushing wages up further by continuing to let the labor market tighten could increase productivity as employers gain incentives to make the additional capital investments to make those workers more productive. If we take today’s slower productivity as given for the future, we are shortchanging the economy and its workers, who won’t reap the rewards of full employment.
On both counts—inflation and productivity—policymakers should see very recent data as coming in too slow and should target faster growth. Let’s say, though, that we finally hit nominal wage growth in the range consistent with the Fed’s target and trend productivity. What then? Do we stop there? No! If the pace of nominal wage growth is exceeding the Fed’s target and productivity trends, that means workers are finally reclaiming some of the income that capital had been receiving in prior years, as workers’ bargaining power had been hamstrung by the slow recovery. The labor share of income is still quite low in historical terms. We have yet to reach the labor share at the lowest point in the business cycles of the 1980s or 1990s. We need to do a better job of digging out of the hole dug in the Great Recession and its aftermath. To do that, we need to see sustained stronger wage growth. And we shouldn’t declare wage growth strong simply by defining down our inflation and productivity expectations.
Workers' share of corporate income hasn't recovered: Share of corporate-sector income received by workers over recent business cycles, 1979–2017
| Labor Share | |
|---|---|
| Jan-1979 | 79.0% |
| Apr-1979 | 79.5% |
| Jul-1979 | 80.2% |
| Oct-1979 | 80.8% |
| Jan-1980 | 81.2% |
| Apr-1980 | 82.7% |
| Jul-1980 | 81.9% |
| Oct-1980 | 80.6% |
| Jan-1981 | 80.3% |
| Apr-1981 | 80.4% |
| Jul-1981 | 79.6% |
| Oct-1981 | 80.5% |
| Jan-1982 | 81.6% |
| Apr-1982 | 81.0% |
| Jul-1982 | 81.0% |
| Oct-1982 | 81.4% |
| Jan-1983 | 81.0% |
| Apr-1983 | 79.9% |
| Jul-1983 | 79.4% |
| Oct-1983 | 79.1% |
| Jan-1984 | 77.8% |
| Apr-1984 | 78.0% |
| Jul-1984 | 78.5% |
| Oct-1984 | 78.3% |
| Jan-1985 | 78.4% |
| Apr-1985 | 78.6% |
| Jul-1985 | 78.2% |
| Oct-1985 | 79.6% |
| Jan-1986 | 79.9% |
| Apr-1986 | 80.8% |
| Jul-1986 | 81.5% |
| Oct-1986 | 81.8% |
| Jan-1987 | 81.7% |
| Apr-1987 | 80.9% |
| Jul-1987 | 80.4% |
| Oct-1987 | 80.9% |
| Jan-1988 | 80.9% |
| Apr-1988 | 80.9% |
| Jul-1988 | 80.8% |
| Oct-1988 | 80.2% |
| Jan-1989 | 80.6% |
| Apr-1989 | 80.9% |
| Jul-1989 | 80.9% |
| Oct-1989 | 81.9% |
| Jan-1990 | 81.8% |
| Apr-1990 | 81.6% |
| Jul-1990 | 82.7% |
| Oct-1990 | 83.1% |
| Jan-1991 | 82.2% |
| Apr-1991 | 82.5% |
| Jul-1991 | 82.8% |
| Oct-1991 | 83.3% |
| Jan-1992 | 83.0% |
| Apr-1992 | 83.1% |
| Jul-1992 | 83.6% |
| Oct-1992 | 83.0% |
| Jan-1993 | 83.5% |
| Apr-1993 | 82.7% |
| Jul-1993 | 82.7% |
| Oct-1993 | 81.4% |
| Jan-1994 | 81.4% |
| Apr-1994 | 81.3% |
| Jul-1994 | 80.6% |
| Oct-1994 | 80.3% |
| Jan-1995 | 80.6% |
| Apr-1995 | 80.4% |
| Jul-1995 | 79.5% |
| Oct-1995 | 79.7% |
| Jan-1996 | 79.1% |
| Apr-1996 | 79.1% |
| Jul-1996 | 79.2% |
| Oct-1996 | 79.3% |
| Jan-1997 | 79.0% |
| Apr-1997 | 78.9% |
| Jul-1997 | 78.3% |
| Oct-1997 | 78.5% |
| Jan-1998 | 79.9% |
| Apr-1998 | 79.9% |
| Jul-1998 | 79.8% |
| Oct-1998 | 80.4% |
| Jan-1999 | 80.3% |
| Apr-1999 | 80.6% |
| Jul-1999 | 81.0% |
| Oct-1999 | 81.4% |
| Jan-2000 | 81.8% |
| Apr-2000 | 81.9% |
| Jul-2000 | 82.4% |
| Oct-2000 | 83.1% |
| Jan-2001 | 83.1% |
| Apr-2001 | 82.8% |
| Jul-2001 | 83.0% |
| Oct-2001 | 84.0% |
| Jan-2002 | 82.0% |
| Apr-2002 | 81.8% |
| Jul-2002 | 81.8% |
| Oct-2002 | 80.9% |
| Jan-2003 | 80.3% |
| Apr-2003 | 80.1% |
| Jul-2003 | 79.8% |
| Oct-2003 | 79.9% |
| Jan-2004 | 78.8% |
| Apr-2004 | 78.7% |
| Jul-2004 | 78.6% |
| Oct-2004 | 78.5% |
| Jan-2005 | 77.0% |
| Apr-2005 | 76.9% |
| Jul-2005 | 77.2% |
| Oct-2005 | 76.0% |
| Jan-2006 | 75.5% |
| Apr-2006 | 75.4% |
| Jul-2006 | 74.7% |
| Oct-2006 | 76.1% |
| Jan-2007 | 77.3% |
| Apr-2007 | 76.9% |
| Jul-2007 | 78.3% |
| Oct-2007 | 79.4% |
| Jan-2008 | 79.8% |
| Apr-2008 | 79.7% |
| Jul-2008 | 80.1% |
| Oct-2008 | 83.7% |
| Jan-2009 | 79.8% |
| Apr-2009 | 79.4% |
| Jul-2009 | 78.4% |
| Oct-2009 | 77.4% |
| Jan-2010 | 76.4% |
| Apr-2010 | 76.7% |
| Jul-2010 | 74.9% |
| Oct-2010 | 74.9% |
| Jan-2011 | 77.1% |
| Apr-2011 | 76.0% |
| Jul-2011 | 76.0% |
| Oct-2011 | 74.2% |
| Jan-2012 | 74.6% |
| Apr-2012 | 74.2% |
| Jul-2012 | 73.9% |
| Oct-2012 | 74.6% |
| Jan-2013 | 74.0% |
| Apr-2013 | 73.6% |
| Jul-2013 | 73.5% |
| Oct-2013 | 73.8% |
| Jan-2014 | 75.9% |
| Apr-2014 | 74.5% |
| Jul-2014 | 73.6% |
| Oct-2014 | 74.2% |
| Jan-2015 | 74.4% |
| Apr-2015 | 75.2% |
| Jul-2015 | 75.6% |
| Oct-2015 | 76.6% |
| Jan-2016 | 76.3% |
| Apr-2016 | 77.0% |
| Jul-2016 | 76.3% |
| Oct-2016 | 76.2% |
| Jan-2017 | 76.8% |
Note: Shaded areas denote recessions. Federal Reserve banks' corporate profits were netted out in the calculation of labor share.
Source: EPI analysis of Bureau of Economic Analysis National Income and Product Accounts (Tables 1.14 and 6.16D)
Enjoyed this post?
Sign up for EPI's newsletter so you never miss our research and insights on ways to make the economy work better for everyone.