Racial and ethnic income gaps persist amid uneven growth in household incomes
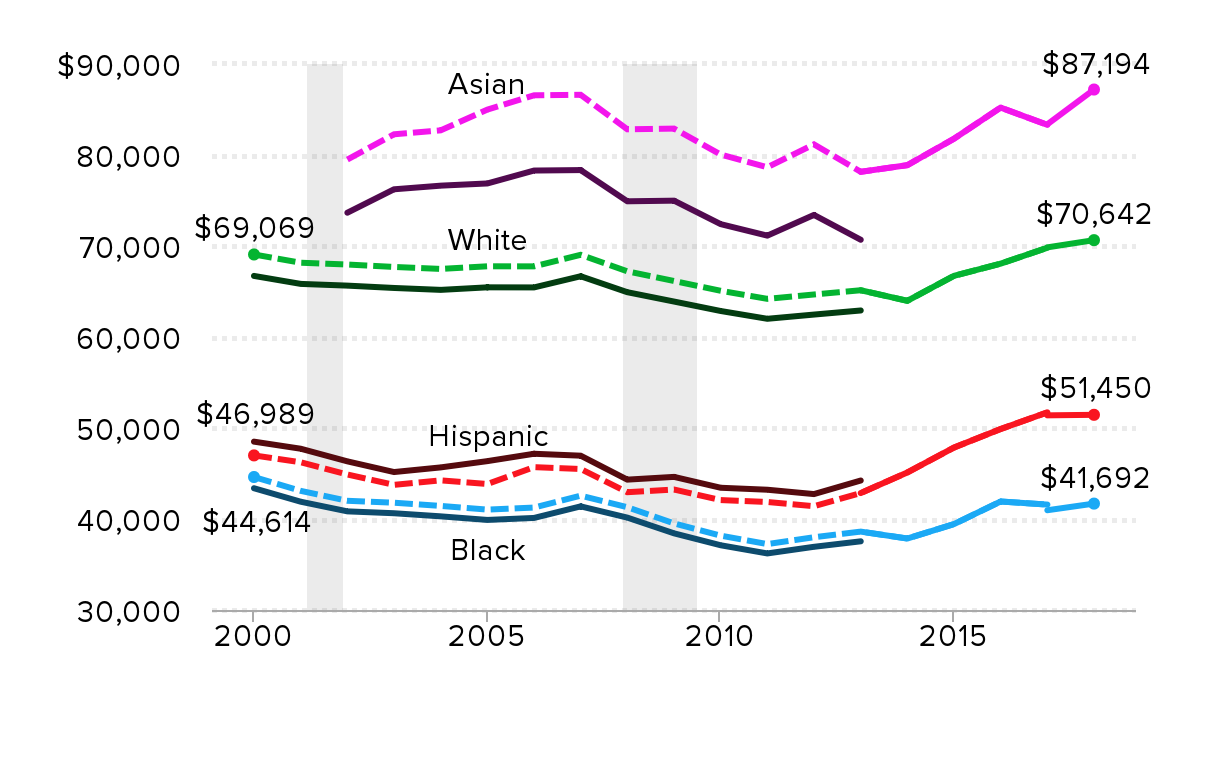
Yesterday’s Census Bureau report on income, poverty, and health insurance coverage in 2018 shows that while there was a slowdown in overall median household income growth relative to 2017, income growth was uneven by race and ethnicity. Real median income increased 4.6% among Asian households (from $83,376 to $87,194), 1.8% among African American households (from $40,963 to $41,692), 1.1% among non-Hispanic white households (from $69,851 to $70,642), and only 0.1% among Hispanic households (from $51,390 to $51,450), as seen in Figure A. The only groups for which income growth was statistically significant were Asian and Hispanic households.
In 2018, the median black household earned just 59 cents for every dollar of income the median white household earned (unchanged from 2017), while the median Hispanic household earned just 73 cents (down from 74 cents).
Real median household income by race and ethnicity, 2000–2018
| Year | White | Black | Hispanic | Asian | White-imputed | Black-imputed | Hispanic-imputed | Asian-imputed | White | Black | Hispanic | Asian | White | Black | Hispanic | Asian |
|---|---|---|---|---|---|---|---|---|---|---|---|---|---|---|---|---|
| 2000 | $66,712 | $43,380 | $48,500 | $69,069 | $44,614 | $46,989 | ||||||||||
| 2001 | $65,835 | $41,899 | $47,721 | $68,161 | $43,091 | $46,234 | ||||||||||
| 2002 | $65,646 | $40,839 | $46,334 | $73,660 | $67,965 | $42,001 | $44,890 | $79,501 | ||||||||
| 2003 | $65,388 | $40,633 | $45,160 | $76,231 | $67,698 | $41,789 | $43,753 | $82,276 | ||||||||
| 2004 | $65,178 | $40,292 | $45,670 | $76,631 | $67,481 | $41,438 | $44,247 | $82,708 | ||||||||
| 2005 | $65,458 | $39,898 | $46,360 | $76,873 | $67,771 | $41,033 | $43,846 | $84,991 | ||||||||
| 2006 | $65,449 | $40,116 | $47,169 | $78,291 | $67,762 | $41,257 | $45,699 | $86,560 | ||||||||
| 2007 | $66,676 | $41,388 | $46,958 | $78,343 | $69,032 | $42,565 | $45,495 | $86,616 | ||||||||
| 2008 | $64,923 | $40,154 | $44,326 | $74,913 | $67,217 | $41,296 | $42,945 | $82,824 | ||||||||
| 2009 | $63,895 | $38,423 | $44,628 | $74,982 | $66,153 | $39,516 | $43,238 | $82,901 | ||||||||
| 2010 | $62,857 | $37,114 | $43,433 | $72,402 | $65,078 | $38,170 | $42,080 | $80,048 | ||||||||
| 2011 | $62,001 | $36,215 | $43,217 | $71,139 | $64,192 | $37,245 | $41,870 | $78,653 | ||||||||
| 2012 | $62,465 | $36,945 | $42,738 | $73,415 | $64,672 | $37,996 | $41,406 | $81,169 | ||||||||
| 2013 | $62,915 | $37,547 | $44,228 | $70,687 | $65,138 | $38,615 | $42,850 | $78,153 | $65,138 | $38,615 | $42,850 | $78,153 | ||||
| 2014 | $63,976 | $37,854 | $45,114 | $78,883 | $63,976 | $37,854 | $45,114 | $78,883 | ||||||||
| 2015 | $66,721 | $39,440 | $47,852 | $81,788 | $66,721 | $39,440 | $47,852 | $81,788 | ||||||||
| 2016 | $68,059 | $41,924 | $49,887 | $85,210 | $68,059 | $41,924 | $49,887 | $85,210 | ||||||||
| 2017 | $69,806 | $41,584 | $51,717 | $83,314 | $69,806 | $41,584 | $51,717 | $83,314 | $69,851 | $40,963 | $51,390 | $83,376 | ||||
| 2018 | $70,642 | $41,692 | $51,450 | $87,194 |

Notes: Because of a redesign in the CPS ASEC income questions in 2013, we imputed the historical series using the ratio of the old and new method in 2013. Solid lines are actual CPS ASEC data; dashed lines denote historical values imputed by applying the new methodology to past income trends. The break in the series in 2017 represents data from both the legacy CPS ASEC processing system and the updated CPS ASEC processing system. White refers to non-Hispanic whites, Black refers to Blacks alone or in combination, Asian refers to Asians alone, and Hispanic refers to Hispanics of any race. Comparable data are not available prior to 2002 for Asians. Shaded areas denote recessions.
Source: EPI analysis of Current Population Survey Annual Social and Economic Supplement Historical Poverty Tables (Tables H-5 and H-9).
Based on EPI’s imputed historical income values (see the note under Figure A for an explanation), 11 years after the start of the Great Recession in 2007, only African American households remained below their pre-recession median income. Compared with household incomes in 2007, median household incomes in 2018 were down 2.1 percent for African American households, but up 0.7% for Asian households, 2.3% for non-Hispanic white households, and 13.1% for Hispanic households. Asian households continued to have the highest median income, despite large income losses in the wake of the recession.
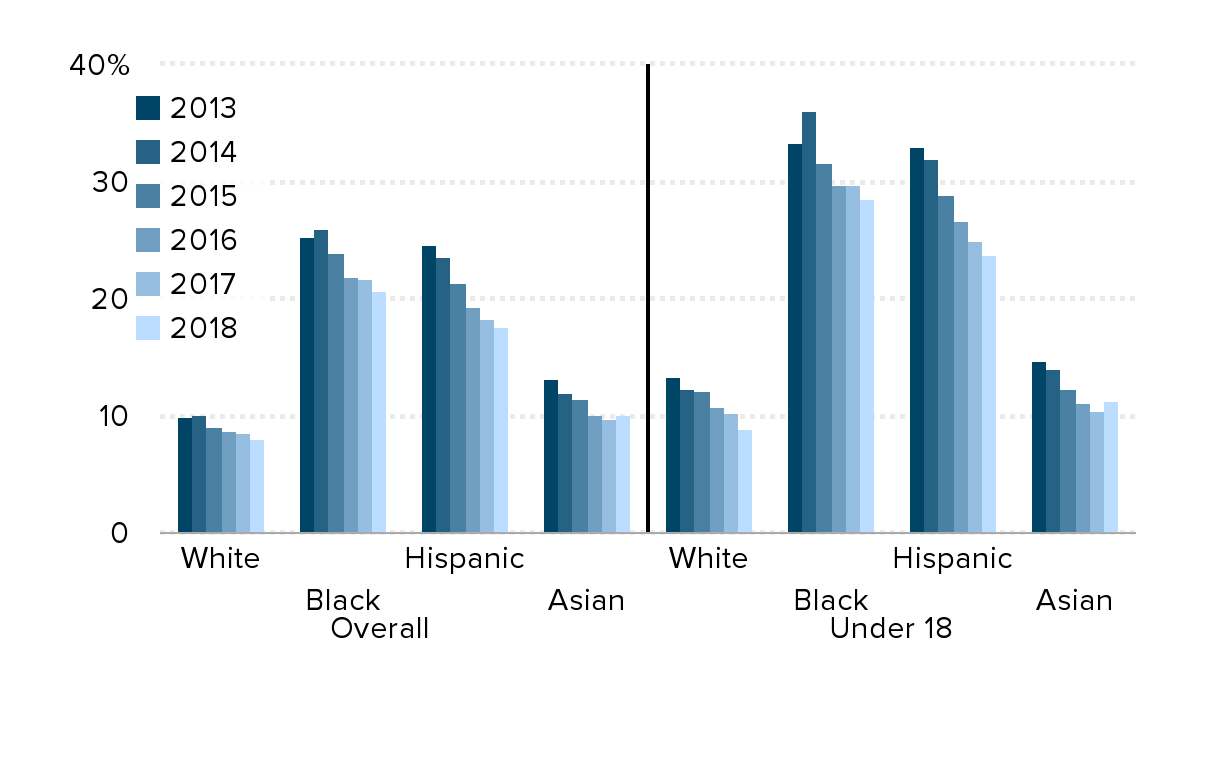
The 2018 poverty rates also reflect the patterns of income growth between 2017 and 2018. As seen in Figure B, poverty rates for all groups were down slightly or unchanged, but remained highest among African Americans (20.7%, down 1.0 percentage point), followed by Hispanics (17.6%, down 0.7 percentage points), Asians (10.1%, up 0.4 percentage points), and whites (8.1%, down 0.4 percentage points). African American and Hispanic children continued to face the highest poverty rates—28.5% of African Americans and 23.7% of Hispanics under age 18 lived below the poverty level in 2018. African American children were more than three times as likely to be in poverty as white children (8.9%).
Overall poverty rate and poverty rate of those under age 18, by race and ethnicity, 2013–2018
| Overall | 2013 | 2014 | 2015 | 2016 | 2017 | 2018 |
|---|---|---|---|---|---|---|
| White | 10.0% | 10.1% | 9.1% | 8.8% | 8.5% | 8.1% |
| Black | 25.3% | 26.0% | 23.9% | 21.8% | 21.7% | 20.7% |
| Hispanic | 24.7% | 23.6% | 21.4% | 19.4% | 18.3% | 17.6% |
| Asian | 13.1% | 12.0% | 11.4% | 10.1% | 9.7% | 10.1% |
| White | 13.4% | 12.3% | 12.1% | 10.8% | 10.2% | 8.9% |
| Black | 33.4% | 36.0% | 31.6% | 29.7% | 29.7% | 28.5% |
| Hispanic | 33.0% | 31.9% | 28.9% | 26.6% | 25.0% | 23.7% |
| Asian | 14.7% | 14.0% | 12.3% | 11.1% | 10.4% | 11.3% |

Note: White refers to non-Hispanic whites, black refers to blacks alone, Asian refers to Asians alone, and Hispanic refers to Hispanics of any race.
Source: Current Population Survey Annual Social and Economic Supplement Historical Poverty Tables (Table 3)
The Supplemental Poverty Measure (SPM), an alternative to the long-running official poverty measure, provides an even more accurate measure of a household’s economic vulnerability. While the official poverty rate captures only before-tax cash income, the SPM accounts for various noncash benefits and tax credits. The SPM also allows for geographic variability in what constitutes poverty based on differences in the cost of living. According to the 2018 SPM, the official poverty measure understates poverty among Hispanics (the 2018 SPM rate is 21.2% vs. 17.6% by the official poverty measure) and among Asians (14.0% vs. 10.1%), while the measures produce relatively similar rates for whites (8.8% vs. 8.1%) and for African Americans (21.0% vs. 20.7%).
Enjoyed this post?
Sign up for EPI's newsletter so you never miss our research and insights on ways to make the economy work better for everyone.
