Behind the numbers of Hispanic employment: A strong labor market has delivered historic gains, but differences remain among demographic groups
The strong labor market over the last two years has produced historic employment gains for Hispanic workers. In 2022, Hispanic workers achieved one of their lowest unemployment rates on record. Later in 2023, the share of the Hispanic population ages 25–54 with a job reached the highest point in recorded history.
Behind these aggregate statistics, however, there is a more nuanced picture of one of the most diverse ethnic groups in the United States. This blog provides a brief description of how different groups of Hispanic workers have fared during the economic recovery from the pandemic recession.
The unemployment rate of Hispanic workers from all backgrounds has declined, but notable differences remain
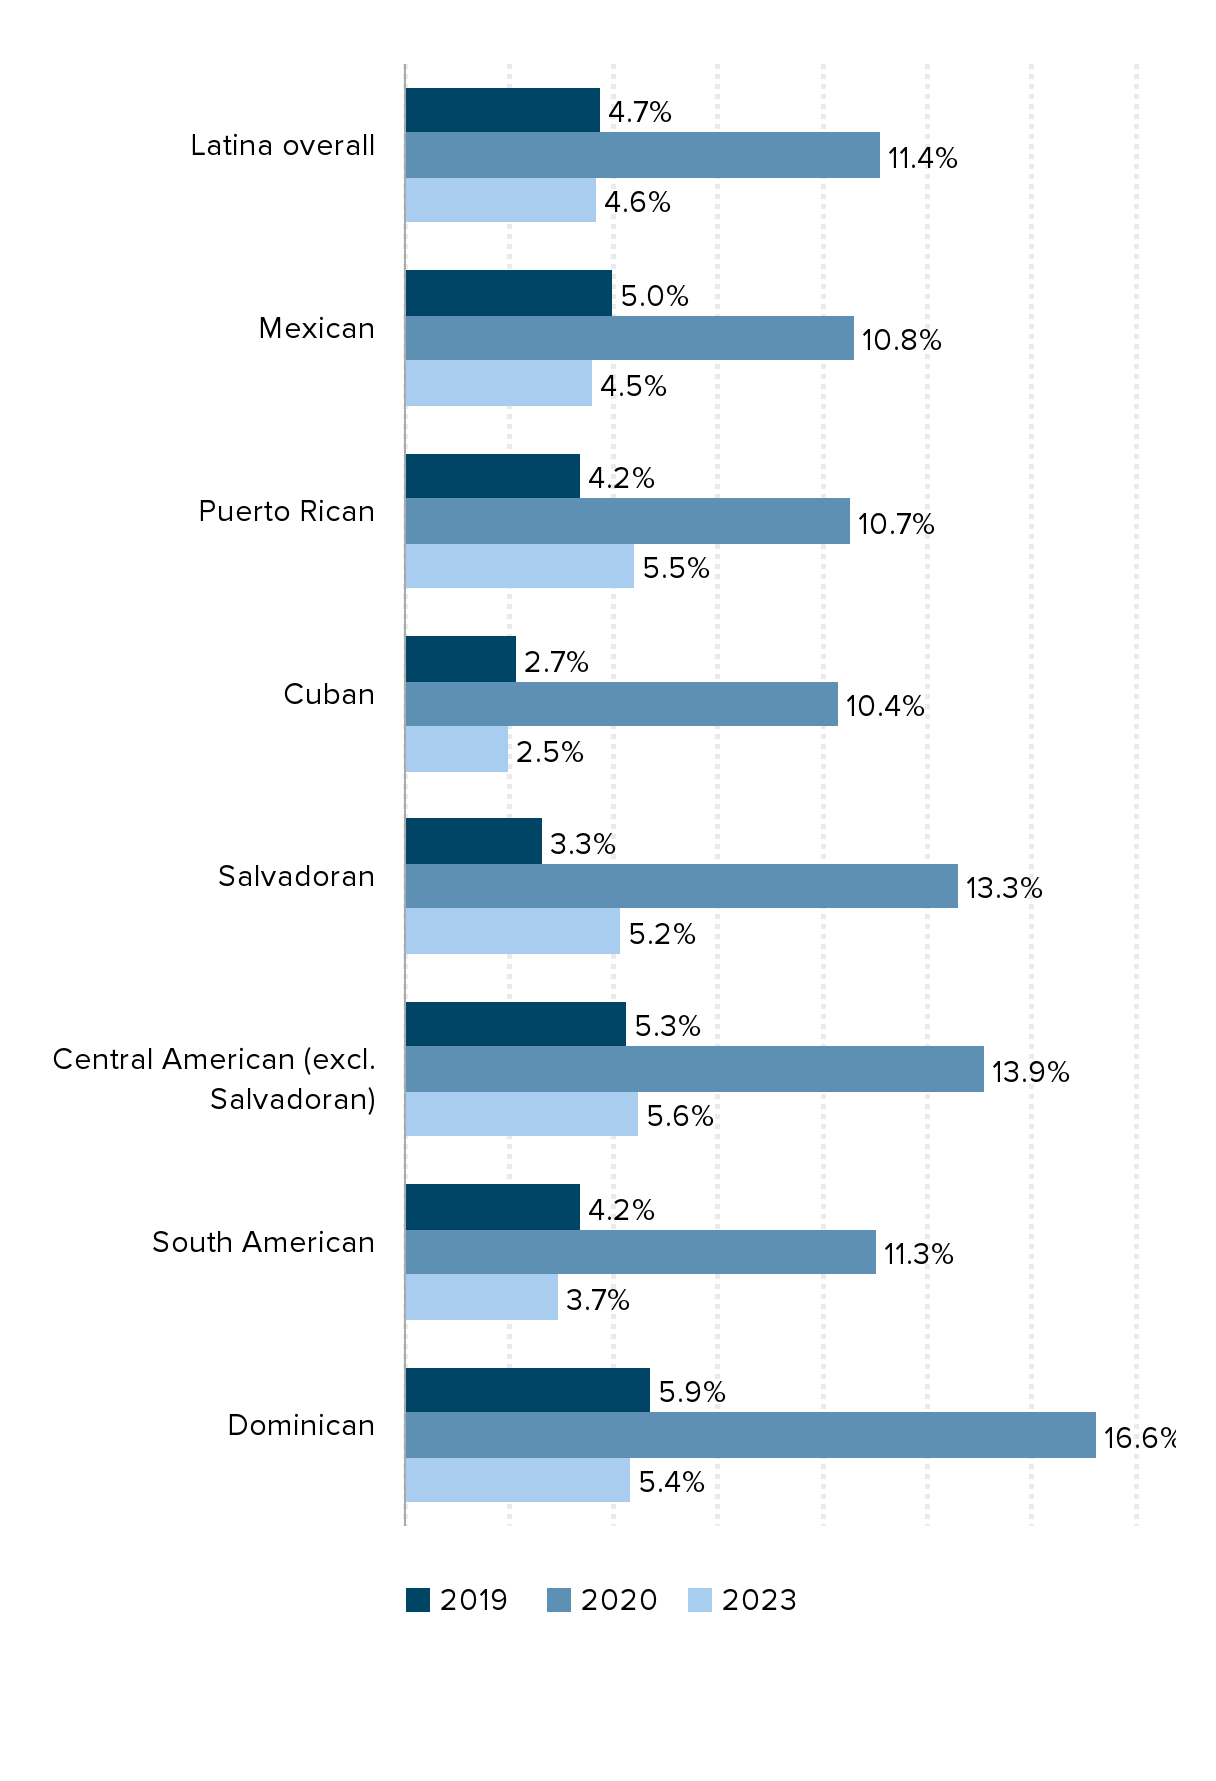
In 2022, the Hispanic unemployment rate reached 4.3%, one of the lowest figures in recorded history. By 2023, the unemployment rate of both Latinos and Latinas had returned to pre-pandemic levels, below 5%. Though the economic recovery has been robust, noticeable differences in employment outcomes have remained depending on country of origin (see Figure A).
Among Latina workers, those originating from Cuba had the lowest unemployment rate at 2.5% in 2023. However, unemployment rates were more than twice as high for Latinas of Dominican, Puerto Rican, and Central American (excluding Salvadoran) origin. While the unemployment rate for Latinas originating from Mexico, South America, and the Dominican Republic had fully recovered to pre-pandemic levels by 2023, the unemployment rate for Latinas of Salvadoran origin remained above the pre-pandemic rate.
Latina unemployment rates by country of origin, select years
| 2019 | 2020 | 2023 | |
|---|---|---|---|
| Latina overall | 4.7% | 11.4% | 4.6% |
| Mexican | 5.0 | 10.8 | 4.5 |
| Puerto Rican | 4.2 | 10.7 | 5.5 |
| Cuban | 2.7 | 10.4 | 2.5 |
| Salvadoran | 3.3 | 13.3 | 5.2 |
| Central American (excl. Salvadoran) | 5.3 | 13.9 | 5.6 |
| South American | 4.2 | 11.3 | 3.7 |
| Dominican | 5.9 | 16.6 | 5.4 |

Note: Data are for workers ages 16 and older. Annual averages are calculated using not seasonally adjusted estimates.
Source: EPI analysis of Bureau of Labor Statistics Current Population Survey public data series
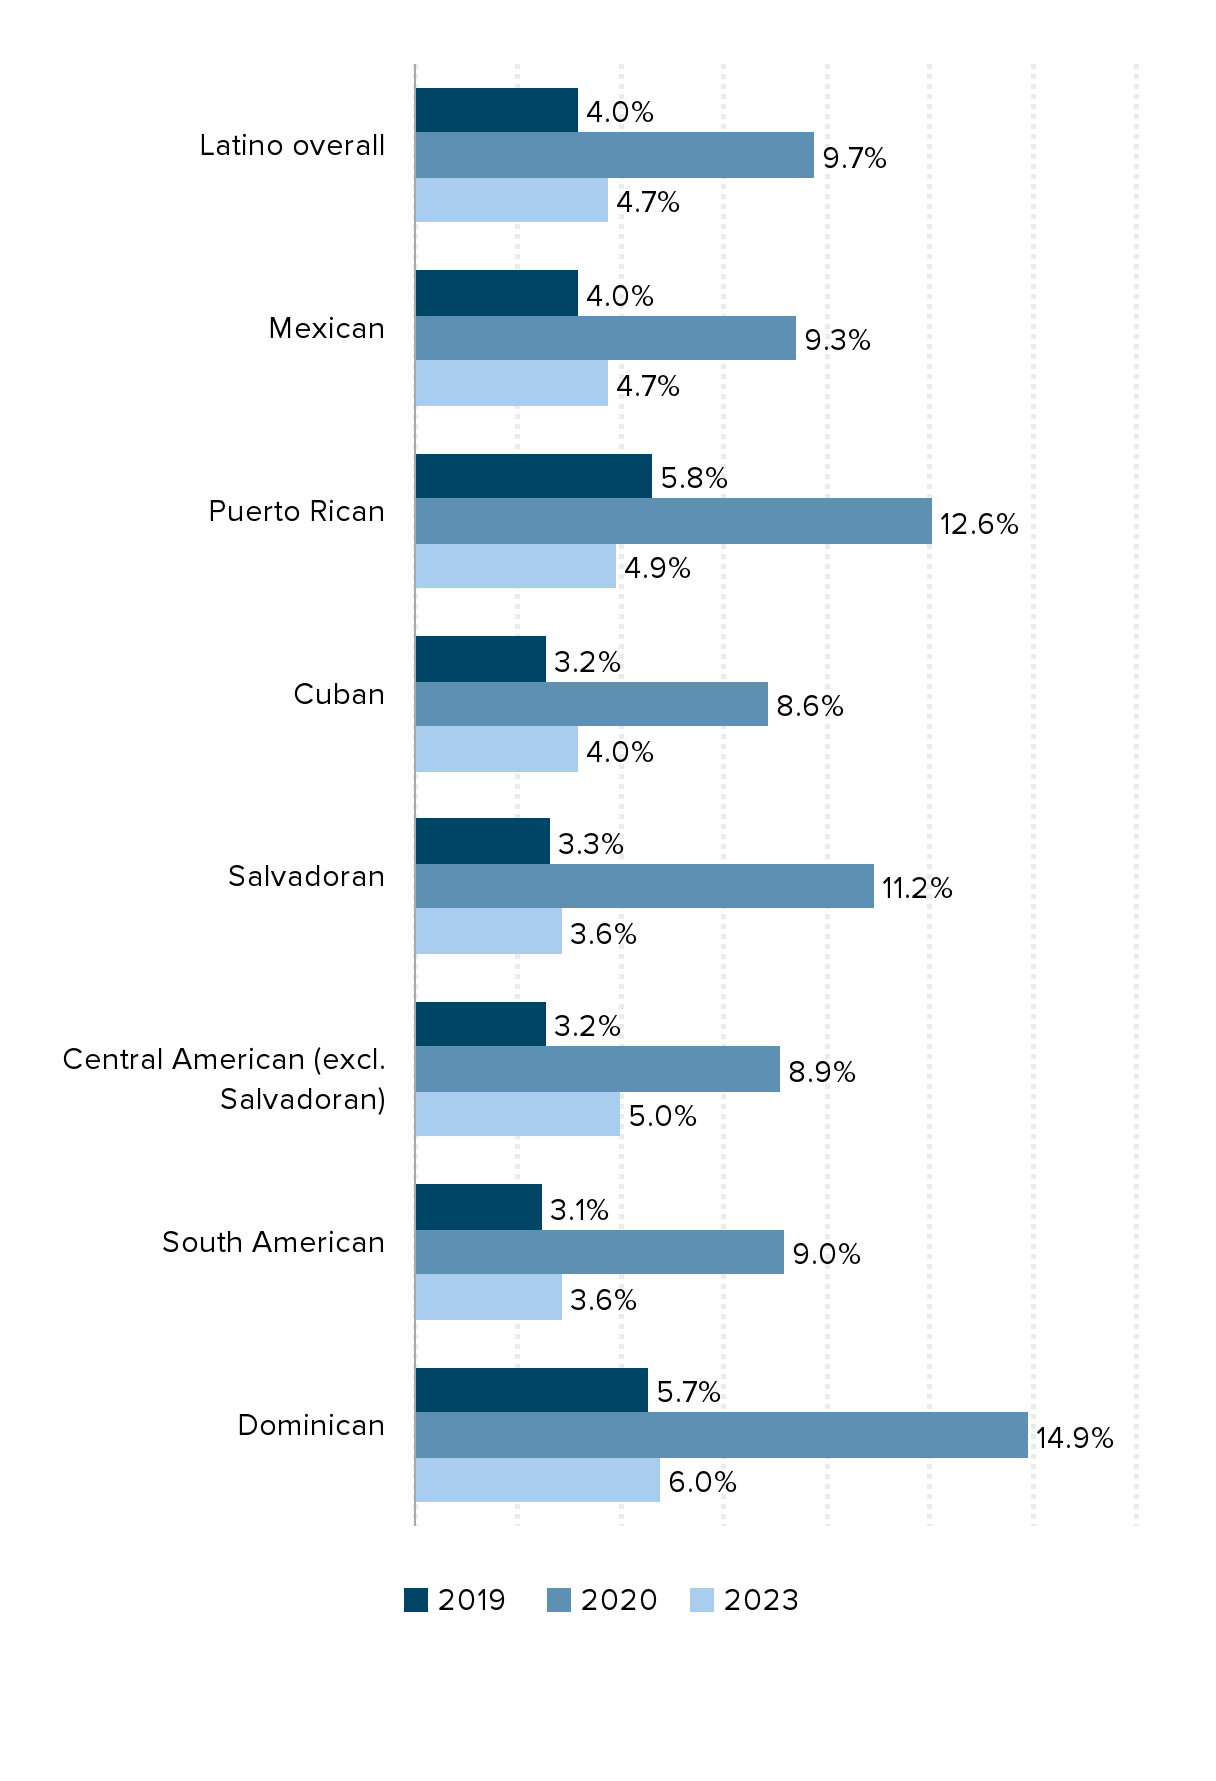
Among Latinos, workers of Salvadoran and South American origin had the lowest unemployment rates at 3.6% in 2023 (see Figure B). While declining from a high of 14.9% in 2020, the unemployment rate of Dominican men stood higher than that of their peers at 6.0% in 2023. While Latino workers of Puerto Rican origin had a lower unemployment rate in 2023 than before the pandemic, the unemployment rate of Latinos originating from Central America (excluding El Salvador), among other countries in the region, had yet to fully recover.
Latino unemployment rates by country of origin, select years
| 2019 | 2020 | 2023 | |
|---|---|---|---|
| Latino overall | 4.0% | 9.7% | 4.7% |
| Mexican | 4.0 | 9.3 | 4.7 |
| Puerto Rican | 5.8 | 12.6 | 4.9 |
| Cuban | 3.2 | 8.6 | 4.0 |
| Salvadoran | 3.3 | 11.2 | 3.6 |
| Central American (excl. Salvadoran) | 3.2 | 8.9 | 5.0 |
| South American | 3.1 | 9.0 | 3.6 |
| Dominican | 5.7 | 14.9 | 6.0 |

Note: Data are for workers ages 16 and older. Annual averages are calculated using not seasonally adjusted estimates.
Source: EPI analysis of Bureau of Labor Statistics Current Population Survey public data series
The share of Hispanic workers with a job has increased for all groups
While the unemployment rate can provide us with insights into the employment situation of job seekers, it can be misleading since it can rise or fall with changes in labor force participation. For this reason, it is useful to also look at the share of a given population that is actively employed, as captured by the employment-to-population (EPOP) ratio. In 2023, the share of Hispanic workers between the ages of 25 and 54 with a job reached a historic high. This achievement was in large part a result of the bold policy response to the COVID-19 economic shock. Hispanic workers from nearly all backgrounds shared the gains of the robust economic recovery.
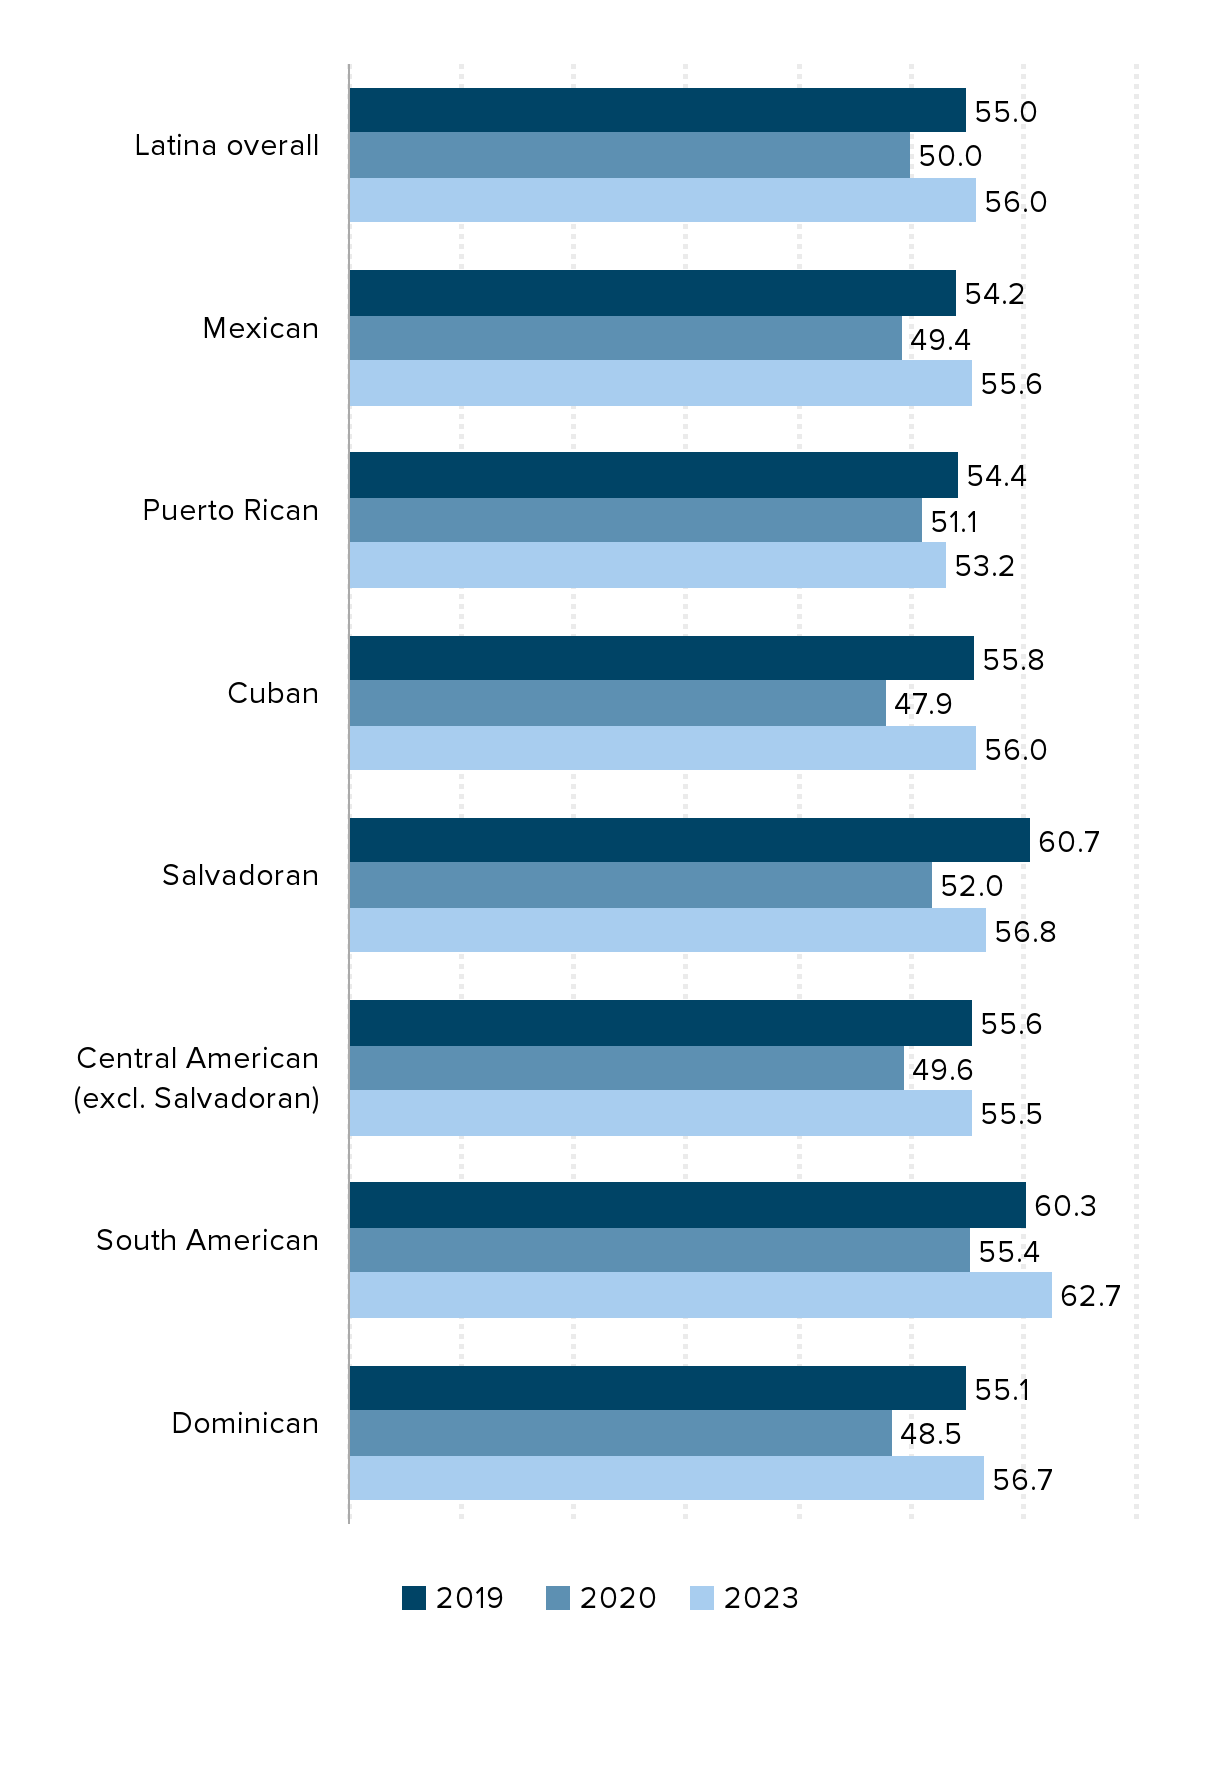
Among Latinas, workers of Dominican and Cuban origin saw the sharpest rebound in their EPOP ratio, as the share of these individuals with a job rose by more than eight percentage points between 2020 and 2023 (see Figure C). By 2023, the employment share of Latinas of nearly all backgrounds, except those originating from Puerto Rico and El Salvador, had fully recovered to pre-pandemic levels. Latinas of South American origin recorded the highest EPOP ratio among their peers at 62.7% in 2023, a share notably higher than in 2019.
Latina employment-to-population ratio by country of origin, select years
| 2019 | 2020 | 2023 | |
|---|---|---|---|
| Latina overall | 55.0 | 50.0 | 56.0 |
| Mexican | 54.2 | 49.4 | 55.6 |
| Puerto Rican | 54.4 | 51.1 | 53.2 |
| Cuban | 55.8 | 47.9 | 56.0 |
| Salvadoran | 60.7 | 52.0 | 56.8 |
| Central American (excl. Salvadoran) | 55.6 | 49.6 | 55.5 |
| South American | 60.3 | 55.4 | 62.7 |
| Dominican | 55.1 | 48.5 | 56.7 |

Note: Data are for workers ages 16 and older. Annual averages are calculated using not seasonally adjusted estimates.
Source: EPI analysis of Bureau of Labor Statistics Current Population Survey public data series
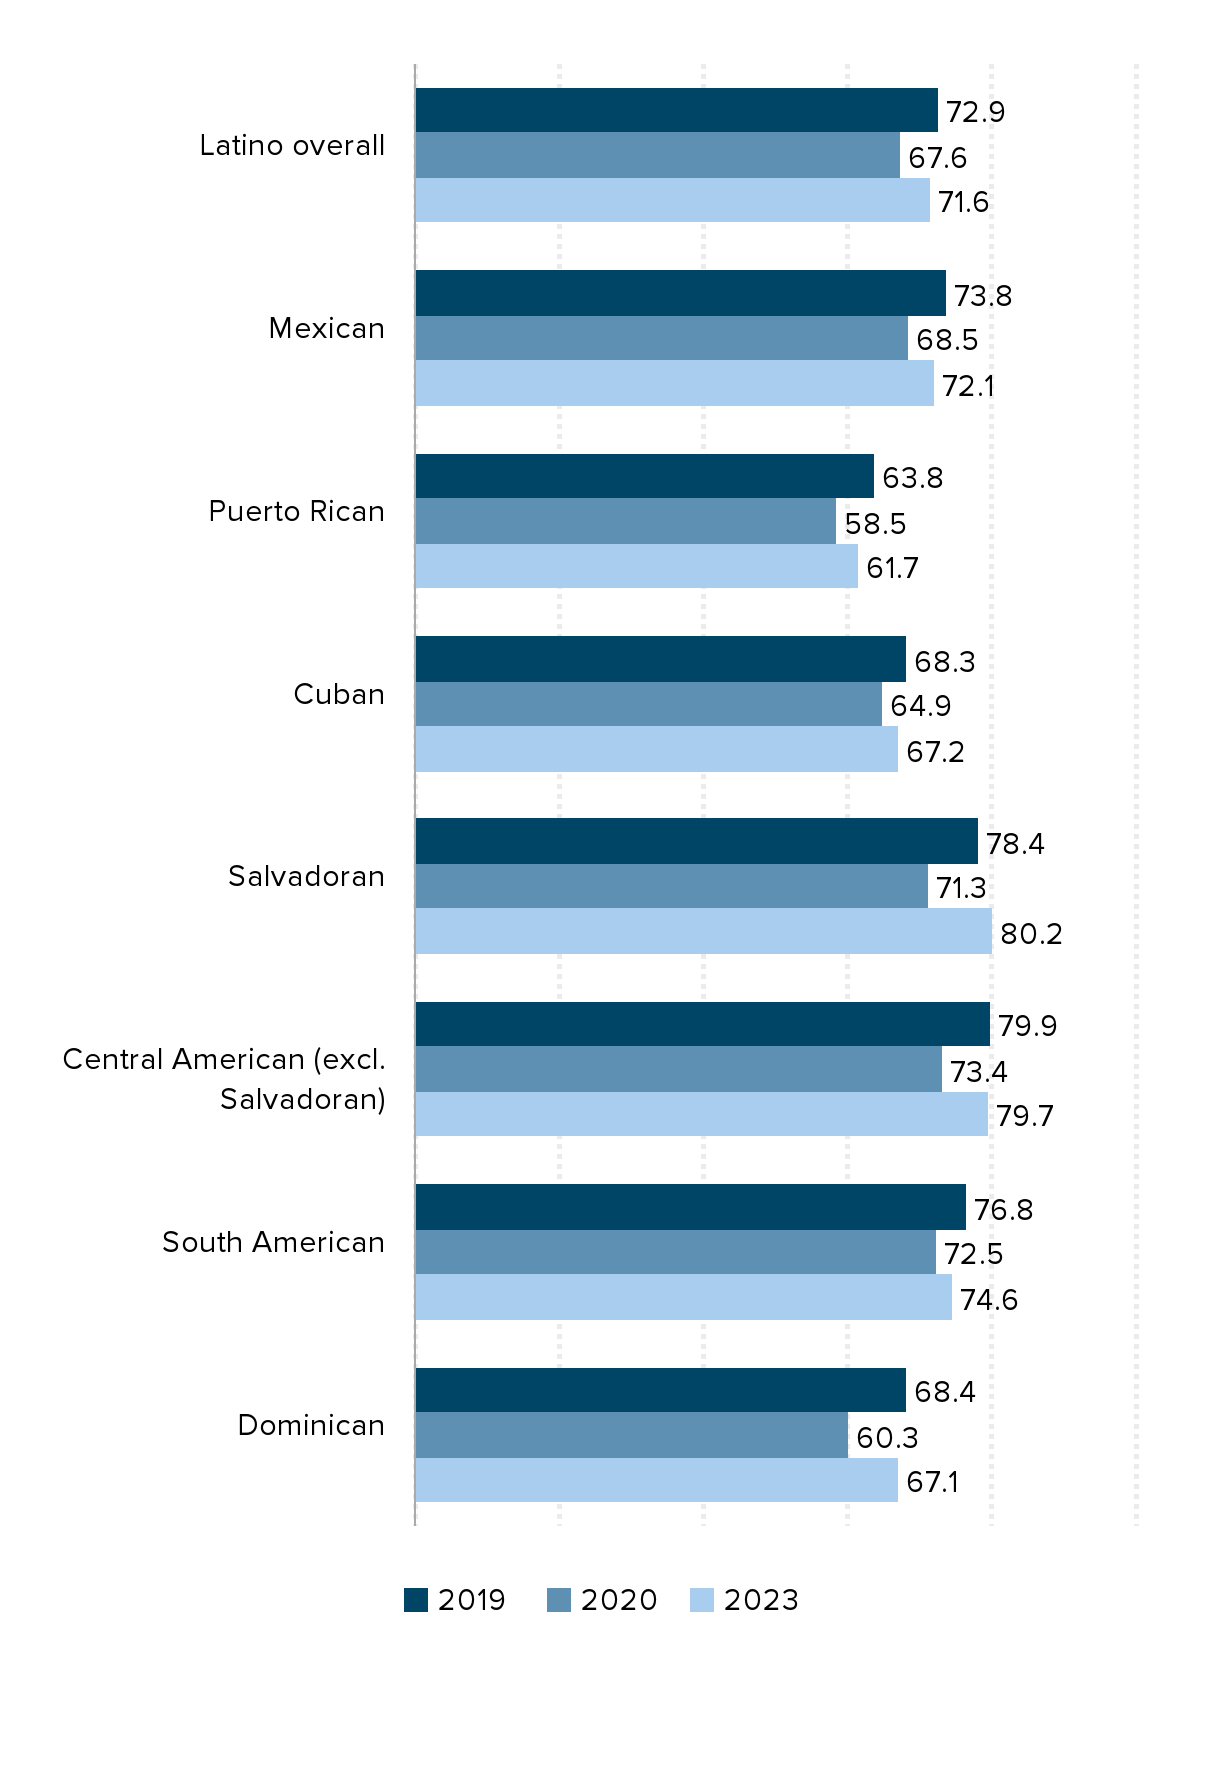
Between 2020 and 2023, Latinos of Salvadoran origin experienced the strongest rebound in employment, as the share of these individuals with a job increased by 8.9 percentage points from 71.3% to 80.2% (see Figure D). However, Latinos of Salvadoran origin were the only ones among their peers who had surpassed pre-pandemic employment by 2023. Notable differences by country of origin remained, as the employment share of Latinos of Puerto Rican origin lagged that of their peers at 61.7% in 2023.
Latino employment-to-population ratio by country of origin, select years
| 2019 | 2020 | 2023 | |
|---|---|---|---|
| Latino overall | 72.9 | 67.6 | 71.6 |
| Mexican | 73.8 | 68.5 | 72.1 |
| Puerto Rican | 63.8 | 58.5 | 61.7 |
| Cuban | 68.3 | 64.9 | 67.2 |
| Salvadoran | 78.4 | 71.3 | 80.2 |
| Central American (excl. Salvadoran) | 79.9 | 73.4 | 79.7 |
| South American | 76.8 | 72.5 | 74.6 |
| Dominican | 68.4 | 60.3 | 67.1 |

Note: Data are for workers ages 16 and older. Annual averages are calculated using not seasonally adjusted estimates.
Source: EPI analysis of Bureau of Labor Statistics Current Population Survey public data series
Latinx workers remain an integral part of the U.S. economy and labor market
In 2023, Hispanics accounted for nearly 1 in 5 (19.03%) of the workers in the labor force. This figure has increased by more than half over the last two decades. While Hispanics of Mexican origin make up the largest share of workers in the labor force, Hispanic workers represent a diversity of nationalities and ethnicities that remains hidden behind aggregate statistics. Because the labor market characteristics of all these Latinx workers vary as much as their country origin and racial makeup, expanded and disaggregated data help us capture the rich diversity and unique experience of these workers in the U.S. labor market. Solidifying the recent gains of these workers will require a continued commitment to job and wage growth, workers’ rights, and improved disaggregated data on race and ethnicity.
Enjoyed this post?
Sign up for EPI's newsletter so you never miss our research and insights on ways to make the economy work better for everyone.
