A record-breaking recovery for Black and Hispanic workers: Prime-age employment rates have hit an all-time high alongside tremendous wage growth
U.S. labor market strength in the recovery has been extraordinary because policymakers addressed the pandemic and subsequent recession at the scale of the problem. Unemployment has been at or below 4.0% for 27 months running, the longest such stretch since the late 1960s. Low-wage workers experienced an unprecedented surge in wage growth over the last four years, as shown in our new report.
These historically robust outcomes extended to Black and Hispanic workers. In 2023, the share of Black and Hispanic people ages 25-54 with a job hit an all-time high. Further, real wage growth among Black and Hispanic workers experienced a significant turnaround from the stagnant wage growth they suffered in much of the prior four decades.
Record-breaking employment-to-population ratio
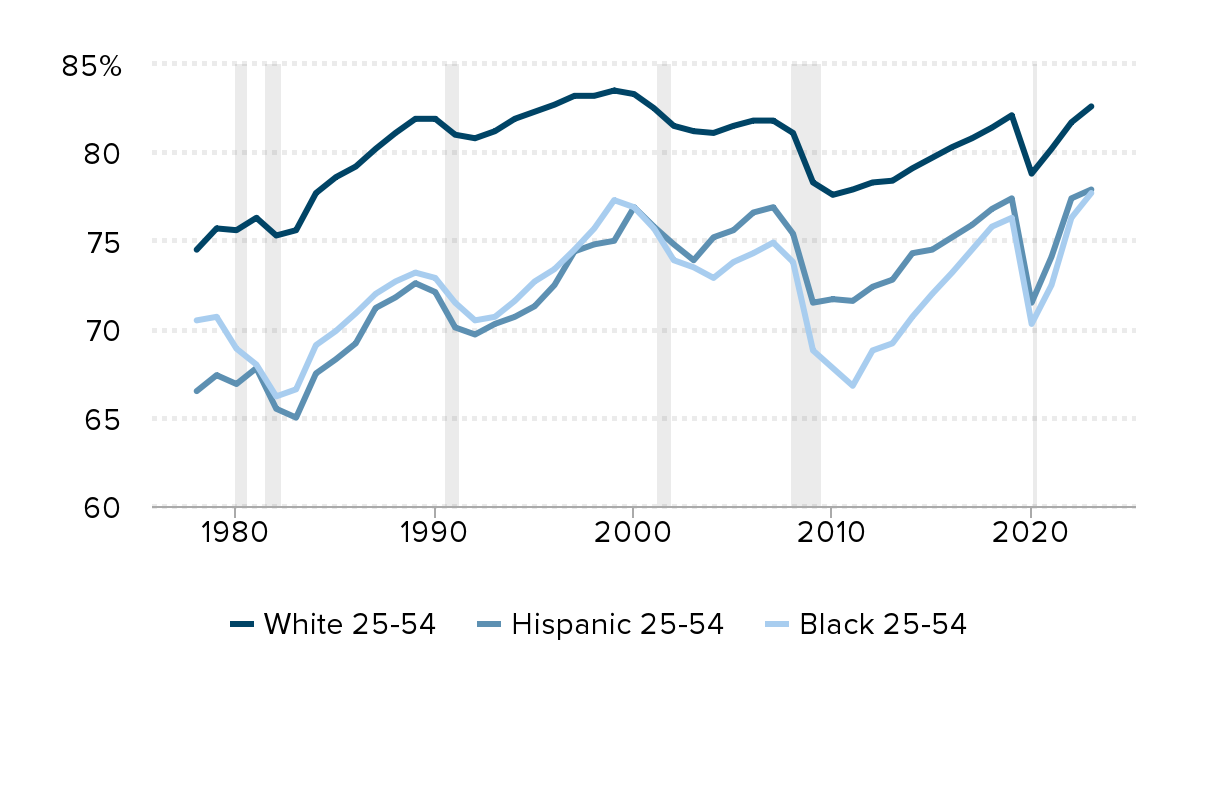
The share of the population ages 25-54 with a job—the prime-age employment-to-population ratio (PA EPOP)—rose to 80.7% in 2023, surpassing the pre-pandemic high of 80.0% in 2019 and marking the highest level since 2000. Historically marginalized workers are hit harder than other workers in recessions. In tight labor markets like today’s, historically marginalized workers experience more improved labor market outcomes and faster wage growth. In fact, Black and Hispanic workers hit all-time high employment rates in 2023: The Black PA EPOP hit 77.7% in 2023, better than its previous high in 1999 (77.3%). The Hispanic PA EPOP reached 77.9%, better than its pre-pandemic high of 77.4% in 2019.
Figure A displays Black, Hispanic, and white PA EPOPs between 1978 and 2023. Prime age is a key demographic to analyze because it is less influenced by the aging population or increases in college attendance (which may depress the employment rates of younger workers relative to earlier historical periods when college attendance was less common). On average, white workers have always experienced better labor market outcomes—specifically lower unemployment and higher EPOPs—than Black and Hispanic workers. Further, Black and Hispanic workers experience larger swings in labor market outcomes in business cycles, clearly shown in the larger dips in employment in and after the shaded recessions in the figure.
Due largely to the more robust policy response, it took only four years for Black and Hispanic workers to hit pre-pandemic employment peaks in this business cycle compared with the prolonged recovery from the Great Recession—when Black and Hispanic employment only hit pre-recession levels after 11 and 12 years, respectively.
Black and Hispanic employment for 25-54 year olds reach all-time high in 2023: Employment-to-population ratio for 25-54 year olds, 1978–2023
| Black 25-54 | Hispanic 25-54 | White 25-54 | |
|---|---|---|---|
| 1978 | 70.5% | 66.5% | 74.5% |
| 1979 | 70.7% | 67.4% | 75.7% |
| 1980 | 68.9% | 66.9% | 75.6% |
| 1981 | 68.0% | 67.8% | 76.3% |
| 1982 | 66.2% | 65.5% | 75.3% |
| 1983 | 66.6% | 65.0% | 75.6% |
| 1984 | 69.1% | 67.5% | 77.7% |
| 1985 | 69.9% | 68.3% | 78.6% |
| 1986 | 70.9% | 69.2% | 79.2% |
| 1987 | 72.0% | 71.2% | 80.2% |
| 1988 | 72.7% | 71.8% | 81.1% |
| 1989 | 73.2% | 72.6% | 81.9% |
| 1990 | 72.9% | 72.1% | 81.9% |
| 1991 | 71.5% | 70.1% | 81.0% |
| 1992 | 70.5% | 69.7% | 80.8% |
| 1993 | 70.7% | 70.3% | 81.2% |
| 1994 | 71.6% | 70.7% | 81.9% |
| 1995 | 72.7% | 71.3% | 82.3% |
| 1996 | 73.4% | 72.5% | 82.7% |
| 1997 | 74.5% | 74.4% | 83.2% |
| 1998 | 75.7% | 74.8% | 83.2% |
| 1999 | 77.3% | 75.0% | 83.5% |
| 2000 | 76.9% | 76.9% | 83.3% |
| 2001 | 75.7% | 75.8% | 82.5% |
| 2002 | 73.9% | 74.8% | 81.5% |
| 2003 | 73.5% | 73.9% | 81.2% |
| 2004 | 72.9% | 75.2% | 81.1% |
| 2005 | 73.8% | 75.6% | 81.5% |
| 2006 | 74.3% | 76.6% | 81.8% |
| 2007 | 74.9% | 76.9% | 81.8% |
| 2008 | 73.8% | 75.4% | 81.1% |
| 2009 | 68.8% | 71.5% | 78.3% |
| 2010 | 67.8% | 71.7% | 77.6% |
| 2011 | 66.8% | 71.6% | 77.9% |
| 2012 | 68.8% | 72.4% | 78.3% |
| 2013 | 69.2% | 72.8% | 78.4% |
| 2014 | 70.7% | 74.3% | 79.1% |
| 2015 | 72.0% | 74.5% | 79.7% |
| 2016 | 73.2% | 75.2% | 80.3% |
| 2017 | 74.5% | 75.9% | 80.8% |
| 2018 | 75.8% | 76.8% | 81.4% |
| 2019 | 76.3% | 77.4% | 82.1% |
| 2020 | 70.3% | 71.5% | 78.8% |
| 2021 | 72.5% | 74.1% | 80.2% |
| 2022 | 76.3% | 77.4% | 81.7% |
| 2023 | 77.7% | 77.9% | 82.6% |

Note: Race/ethnicity categories are mutually exclusive (i.e., white non-Hispanic, Black non-Hispanic, and Hispanic any race).
Source: EPI analysis of the EPI Current Population Survey Basic monthly extracts, Version 1.0.48 (2024), https://microdata.epi.org.
Faster wage growth for Black and Hispanic workers over the last four years
Black and Hispanic workers have also experienced stronger wage growth during this recovery. Because of long-standing patterns of discrimination and occupational segregation, faster wage growth among Black and Hispanic workers is due in part to their disproportionate representation in the low-wage labor market relative to their shares within the overall workforce.
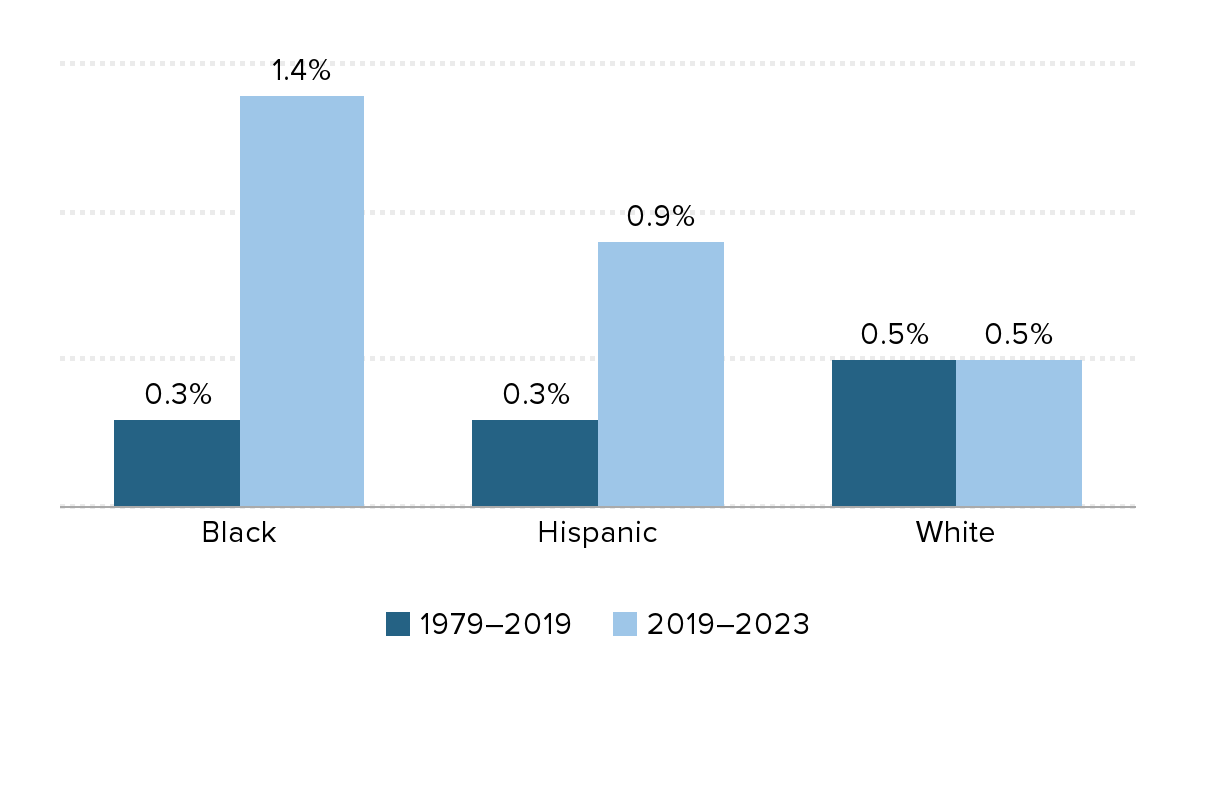
Figure B shows wage growth by race and ethnicity over the last four years compared with the prior 40 years. Because of the different periods of time, the growth rates here are annualized to better compare apples to apples. While there were short periods of decent wage growth for Black and Hispanic workers—particularly in the late 1990s and the years leading up to the pre-pandemic labor market peak in 2019—the overall impression of the 1979 to 2019 period is one of slower wage growth. In comparison, real wage growth—which accounts for high inflation—was particularly strong for these historically marginalized groups between 2019 and 2023. Black workers in particular experienced wage growth far above their historical norm: 1.4% annually over the last four years.
In our latest State of Working America Wages report, we show how the Black-white and Hispanic-white wage gaps remain much larger now than in 1979 even as the narrowing over the last four years has been significant. We also show how Black men experienced particularly fast growth relative to past performance, increasing 1.5% annualized over the last four years, compared with 0.0% on average over the prior 40 years.
After decades of slow growth, Black and Hispanic workers experience faster wage growth: Annualized real wage growth for Black, Hispanic, and white workers, select periods
| 1979–2019 | 2019–2023 | |
|---|---|---|
| Black | 0.3% | 1.4% |
| Hispanic | 0.3% | 0.9% |
| White | 0.5% | 0.5% |

Note: Race/ethnicity categories are mutually exclusive (i.e., white non-Hispanic, Black non-Hispanic, and Hispanic any race).
Source: EPI analysis of the Current Population Survey Outgoing Rotation Group microdata, EPI Current Population Survey Extracts, Version 1.0.48 (2024), https://microdata.epi.org.
While overall low unemployment and high EPOPs are certainly positive indicators of labor market strength right now, allowing the economy to recover and keep growing has translated into significant gains for historically marginalized Black and Hispanic workers. Policymakers need to keep pushing to keep the labor market pinned very tightly near full employment. The evidence is clear: If the Federal Reserve keeps interest rates higher than is needed to normalize inflation, the result may be an avoidable recession. Even a mild recession will do significant harm to Black and Hispanic workers’ opportunities for employment and wage growth.
Enjoyed this post?
Sign up for EPI's newsletter so you never miss our research and insights on ways to make the economy work better for everyone.
