See Snapshots Archive.
Snapshot for December 17, 2003.
Job growth up, job quality down
Along with the growth of employment, however, it is also important to examine the quality of the jobs gained relative to those lost. Over the course of the recovery (from November 2001 to November 2003), 1.3 million jobs in manufacturing have been lost, 272,000 jobs in information services, and 93,000 jobs in professional/technical services, all sectors that pay above-average wages. At the same time, jobs have been added in administrative services and accommodations/food services, two lower wage sectors. (Health care, another growth sector, pays wages close to the average of $15.44 in the third quarter of this year.)

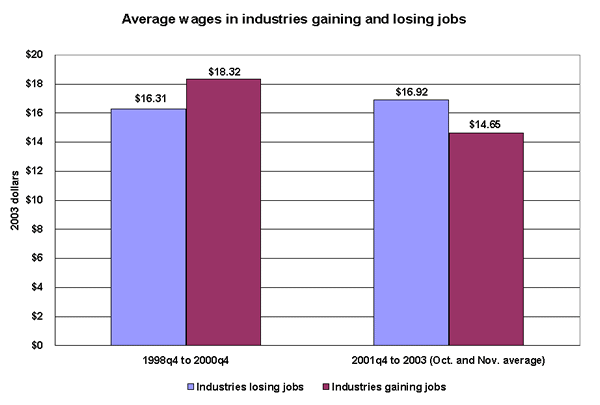
The figure shows the average wage in industries that grew as a share of private-sector employment versus those whose share of employment diminished over two time periods: the last two years of the 1990s recovery (1998 to 2000) and the first two years of this recovery. Over the past two years, expanding industries paid $14.65 per hour, while contracting industries paid $16.92. Conversely, higher paying jobs dominated in the latter 1990s, when industries such as information and professional services, with above-average wages, were expanding. In percentage terms, expanding industries now pay 13% less than contracting ones; in the 1998 to 2000 period, growth industries paid 12% more.
Compared to the job market of the latter 1990s, many of the new jobs added in this recovery pay relatively low wages. At the same time, some of the higher wage sectors, such as manufacturing and high-end services, continue to lose employment or grow too slowly to provide enough higher earning opportunities for job seekers. This dynamic, in tandem with the fact that wages are rising more slowly within specific industries right now, has the potential to significantly slow the growth of living standards for working families. With this in mind, job quality should be closely monitored as the recovery proceeds.
Methodology: Data are from the Bureau of Labor Statistics Payroll Survey and are for private-sector employment only; wages refer to production, non-supervisory workers (this BLS wage series does not provide wage data for the government sector). We begin by calculating industry shares of private employment and then take the difference in the shares over the period of interest (we disaggregate to the level of 20 industries). These changes are negative for industries contracting as a share of the total and visa-versa. We then create industry weights by taking each change as a share of the total change separately for contracting and expanding industries (thus, we have weights that sum to one for both groups). These weights are multiplied by hourly wages for the 20 industries in 2003q3. Note that we hold this wage vector constant so that the results are only affected by the shift in industry shares, not by wage changes.
This week’s Snapshot was written by EPI economist Jared Bernstein with research assistance by Yulia Fungard.
For the most recent jobs numbers from the Bureau of Labor Statistics, see the December Jobs Picture.
