A weekly presentation of downloadable charts and short analyses designed to graphically illustrate important economic issues. Updated every Wednesday.
Snapshot for July 24, 2002.
CEOs make in a day what average worker does in a year
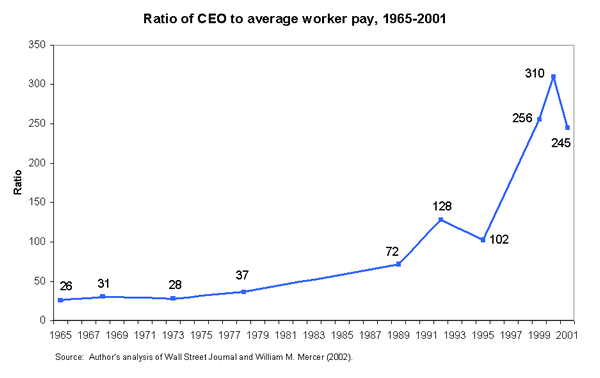
CEO pay has grown far faster than the pay of other workers over the last two decades but particularly in the late 1990s. The increased divergence between the growth of CEO pay and an average worker’s pay is captured in the growth of the ratio of CEO to worker pay, shown in the figure below.

In 1965, U.S. CEOs in major companies earned 26.0 times more than an average worker; this ratio grew to 36.5 in 1978 and to 71.7 in 1989. There was a huge jump in the 1990s as the ratio of CEO-to-worker pay surged to 310.0 at the end of the recovery in 2000. In other words, in 2000, a CEO earned more in one workday (there are 260 in a year) than what an average worker earned in 52 weeks. In 1965, by contrast, it took a CEO two weeks to earn a worker’s annual pay. This ratio fell in 2001 but remained well above its historical levels.
This week’s Snapshot by EPI vice president Lawrence Mishel.
Check out the archive for past Economic Snapshots.
