July 6, 2007
Moderate top-line growth masks underlying weakness
By Jared Bernstein with research assistance from James Lin
Payrolls expanded moderately in June, up 132,000 jobs, boosted by a strong 40,000 job gain in government employment, according to today’s report from the Bureau of Labor Statistics (BLS). Private sector job gains were a modest 92,000, with about two-thirds of those jobs in education and health. Thus, while today’s top-line number met economists’ expectations and suggests steady growth, beneath the surface, today’s report reveals some weakness in cyclically parts of the private economy.
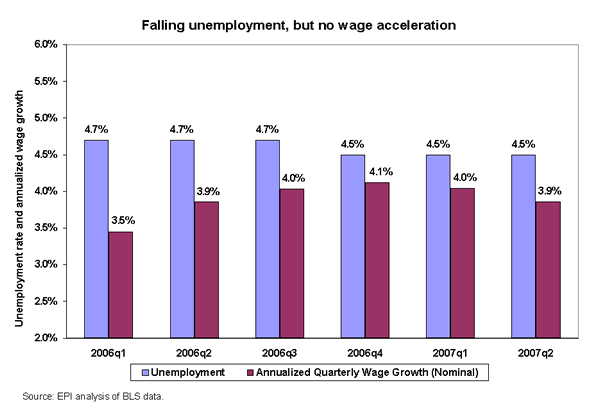
The unemployment rate held at 4.5%, and has now been below 5% since November 2005. Yet, while this relative low rate implies a tight job market, wage trends show no sign of acceleration. We examine this important relationship in greater detail below.
Revisions to April and May added 75,000 jobs to the payroll counts, leading to an average monthly gain this year of 145,000, compared to 189,000 last year. The BLS household survey showed job gains of 197,000 last month, but this is a much more volatile survey on a monthly basis. Averaging over the first half of the year, however, the household survey shows very small monthly gains of 36,000, compared to 262,000 last year.
This deceleration in job growth reflects slower overall economic growth in 2007, as the economy expanded at a rate of less than 1% in the first quarter. This is well below trend—the normal, healthy GDP growth path—of around 3%. When GDP growth lags below trend, there is typically less economic activity by consumers and investors, leading to diminished labor demand and less job growth.
However, diminished job growth this year, evident in both surveys, has not led to higher unemployment rates. One reason for this unusual development is the decline in the share of the population in the labor force, down three-tenths of a percentage point since December of last year. Since only those seeking work are counted as unemployed, this decline may reflect potential job seekers taking themselves out of the running, as it were, and thus not counted among the unemployed.
A closer look at labor force participation rates strengthens this hypothesis. Rates are down more sharply for both minority and younger persons, groups whose participation is known to be highly “elastic,” i.e., especially sensitive to the economy’s ups and downs. Since last December, labor force participation rates (LFPR) are down 0.6 points for African Americans (twice the overall decline of 0.3 points), and down 0.9 points for Hispanics, perhaps reflecting employment losses in residential construction.
Were those missing 0.3% from the LFPR on the unemployment rolls instead of out of the labor force, the unemployment rate would be 5.0% instead of the current 4.5%.
Outside of education and health, the other private service sector with strong growth in June was leisure and hospitality, which added 39,000 jobs, with most of those gains coming from restaurants and bars (35,000). Most other service sectors pulled back in June. Retail trade employment was down 24,000, and professional service jobs—office jobs like legal services, temp help, and accounting—were down 9,000, a reversal of the 24,000 average monthly gain over the prior two months.
Financial services had a weak month, essentially flat at 1,000 net new jobs. This partially reflects weakness in hiring related to the housing slump. For example, employment among credit intermediaries—persons that help arrange mortgage loans—was down 9,000 in June. Residential construction was essentially flat last month, while non-residential added about 12,000 jobs. Some analysts have raised concerns about BLS’s addition of jobs to the construction sector from their “birth/death” model (used to adjust the sample to account for firms’ births and deaths), but June’s relatively small adjustment of 26,000 for construction (both residential and non-residential) is unlikely to skew the results.
Manufacturing continues its long employment slide, down 18,000 in June, with losses spread throughout the sub-sectors. The factory sector has contracted for each of the past 12 months, and is down 191,000 over the past year, and 1.8 million over the economic recovery that began in November 2001.
Finally, today’s report shows average hourly and weekly earnings to be up around 4% compared to last June. Hourly wage growth, before inflation, has recently stayed in that range, not accelerating at all even as unemployment has remained historically quite low. The Chart makes this case graphically, by comparing quarterly unemployment rates with hourly wage growth (quarterly measures, annualized). As the jobless rate has come down slightly, quarterly wages continue to grow at an annual rate hovering around 4%.

In sum, today’s jobs report is weaker than the top-line employment growth number of 132,000 would suggest. Outside of restaurants, the only private sector gains came in health and education, sectors that do not typically respond to underlying weakness in the economy. Wage pressures are subdued, and diminished labor force participation rates, especially for minorities, also suggest cyclical weakness. None of these observations suggest recession, but neither do they suggest that the labor market is safely out of the economic doldrums.
To view archived editions of JOBS PICTURE, click here.
The Economic Policy Institute JOBS PICTURE is published each month upon release of the Bureau of Labor Statistics’ employment report.
EPI offers same-day analysis of income, price, employment, and other economic data released by U.S. government agencies. For more information, contact EPI at 202-775-8810.