June 2, 2006
Report shows slowing job growth
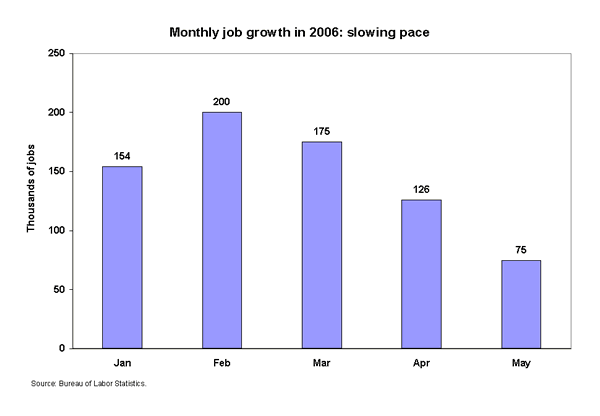
For the second month in a row, the nation’s employers added fewer workers than expected, according to today’s report from the Bureau of Labor Statistics (BLS). Payrolls were up 75,000 in May, while analysts expected gains of around 175,000. As the figure below shows, employment growth has slowed consistently since February.

Ignoring months affected by the Gulf Coast hurricanes, May’s gain is the smallest since July of 2004. Prior to the recent deceleration, payrolls were on a trend of about 200,000 jobs per month. Thus far this year, the average monthly addition is just below 150,000, generally considered an adequate level of job growth in that it is strong enough to prevent the unemployment rate from rising (unemployment ticked down insignificantly in May, from 4.7% to 4.6%).
However, the clear deceleration in job growth, in tandem with other weak indicators in today’s report (both average weekly hours and total hours over the whole economy fell in May), point towards a possible downward shift in net job creation.
As noted, unemployment ticked down in May to 4.6%, the lowest rate since July of 2001. Though statistically indistinguishable from last month’s rate, the jobless rate fell due in part to much stronger job growth recorded by the BLS’s household survey, from which unemployment is derived. But the monthly employment changes from the household survey are based on a much smaller sample than the payroll survey, are far more volatile, and are widely considered less reliable indicators of monthly growth.
The main industries to shed jobs on net last month were manufacturing, retail trade, and information. Factory employment was down 14,000, reversing most of April’s addition of 19,000 jobs. Over the year, manufacturing employment is unchanged, which is actually an improvement over the long-term slide in the sector beginning in the late 1990s.
Retail trade, down 27,000 last month, continues to be a somewhat surprisingly weak sector for job growth. Both overall consumption and retail sales have been at least moderately robust of late, yet retail employment is down 71,000 over the past two months. Wholesale trade, conversely, is up 26,000 over the past two months and 49,000 over the year. As we’ve noted in past reports, these relations may be indicative of a shift in retail point-of-purchase from stores to internet sources.
Health services continued to be a reliable growth sector, adding 19,000 jobs last month. Since the payroll employment trough of August 2003, education and health services together account for 21% of job growth, although they were 13% of total employment at that time.
Construction employment, another major contributor to job growth over the recovery, was flat last month, and appears to be slowing somewhat as the housing market shows some signs of cooling (employment in residential construction has been flat this year). At an annualized rate, job growth in overall construction this year is running 25% below last year’s rate.
Though the unemployment rate was essentially unchanged last month, long-term unemployment ticked up slightly and remains uncharacteristically high. In May, 18.8% of the unemployed had been jobless for at least half a year, suggesting a higher share of persons is stuck in unemployment than might be expected given the low and declining jobless rate. Since January of last year, unemployment is down 0.6 percentage points, while the long-term jobless share is down 2.2 points. Over an identical period in the last recovery, the decline in unemployment was similar, but the fall in the long-term share was twice that of this recovery (-4.4 points). The implication is that it will take more robust job creation to ameliorate this serious problem of extended joblessness.
Average hourly wages were up only $0.01 last month, contributing, along with the slowdown in average weekly hours, to a loss of $1.32 in weekly earnings. Last month, however, hourly wages were up strongly, by $0.10, or 0.6%, and averaging over the two months, the monthly change of 0.3% is in line with recent growth rates of wages.
A more salient concern is the decline in both weekly hours—down 0.1 of an hour—and aggregate (economy-wide) hours—down 0.2%. On a three-month annualized basis, aggregate hours, which tend to correlate with the overall growth of the economy, are up by a weak rate of 1.5%. Both of these measures, along with the slowing of job growth, suggest weakening labor demand.
Turning points are always hard to pick out of monthly reports, but the slower monthly job growth shown in the figure has persisted now for the past few months. The economy is now facing headwinds that were not evident in prior months, including higher interest rates, less stimulus from the housing sector, and higher energy prices.
Putting these facts together, policy makers need to be mindful of a weakened job market and the negative impact this could have on working families, many of whom are already feeling the squeeze of higher gas prices and weak real wage trends. From the perspective of the Federal Reserve, this would suggest holding interest rates steady, to avoid pouring more water on a fire that is showing worrisome signs of generating less heat.
—By Jared Bernstein, with research assistance by Yulia Fungard.
To view archived editions of JOBS PICTURE, click here.
The Economic Policy Institute JOBS PICTURE is published each month upon release of the Bureau of Labor Statistics’ employment report.
EPI offers same-day analysis of income, price, employment, and other economic data released by U.S. government agencies. For more information, contact EPI at 202-775-8810.