September 2, 2005
Payrolls up moderately, but slack persists despite low unemployment
The nation’s payrolls grew less than expected last month, according to the data in today’s report from the Bureau of Labor Statistics. The BLS establishment survey showed an addition of 169,000 jobs in August, well behind July’s gain, which was revised upward to 242,000.
The BLS’ survey of households, however, was considerably more positive, showing larger job gains, which pushed the unemployment rate down to 4.9%, the lowest rate in four years.
The BLS was careful to note that, because these employment data were collected in the middle of August, they do not reflect the impact of hurricane Katrina. Next month’s report, however, is sure to reflect the significant negative effects of the storm and its aftermath on employment.
While most industries continued to expand in August, they do so at a slower pace than July. Retail trade, which had a strong July (up 58,000 jobs), pulled back last month, adding only 12,000 jobs. Similarly, employers in the nation’s business services added 29,000 jobs in August compared to 42,000 in July.
The factory sector continues to be an exception to the generally positive trend in payroll growth. Manufacturing employment fell again in August, shedding 14,000 jobs, surpassing July’s loss of 6,000. Thus far this year, factory employment is down 78,000. This represents a clear reversal of what turned out to be a short-term positive trend last year in this sector, when manufacturing employment was up 69,000 January through August 2004.
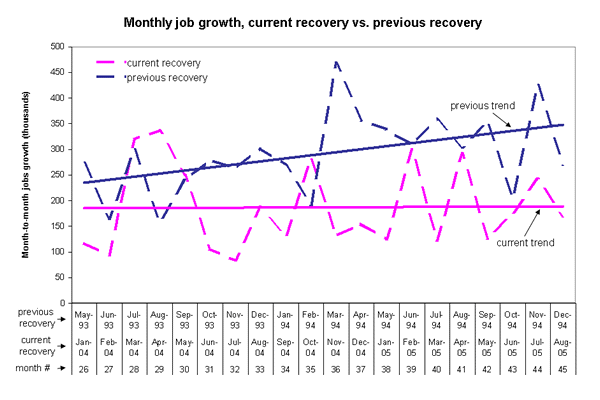
Since January 2004, payrolls have been growing at a rate of 187,000 per month, a pace that most commentators consider to be strong, and one that has prompted Federal Reserve officials to worry publicly about the possibility of inflationary pressures generated by a tightening labor market. Three factors, however, suggest otherwise.
The accompanying chart plots the monthly changes in job growth since January 2004 in this recovery, and over the comparable months of the recovery in the last expansion (May 1993 to December 1994), along with a linear trend line. First, note that the monthly changes were greater at this stage of the last recovery. On average, employment was expanding at a monthly rate of 292,000, compared to 187,000 in the current period. Second, the current pattern has been a good deal more “choppy” with strong months of job growth (like July) followed by only adequate months (like last month). This unsteady nature of employment growth may be one of the factors, along with high and rising gas prices, behind the growing sense of economic insecurity that has been showing up in recent polling data. Finally, as the trend lines reveal, the rate of job growth was steadily increasing in the last recovery at this stage, which does not appear to be the case in this recovery.
As noted, the household survey painted a more positive picture of the August labor market. While most analysts will rightly discount the large job growth number (373,000) as due to the monthly volatility in this survey, the trend increase in employment rates for most groups of workers is genuinely encouraging. Overall, the share of the population employed has ticked up half-a-percentage point over the past year, from 62.4% to 62.9%. An important exception is the employment rates of prime-age women (age 25-54), which is little changed this year and remains 2.2 percentage points below it pre-recession level.
While employment rates for other groups are still below their pre-recession levels, this overall upward trend suggest that employment growth is effectively in the process of slowly absorbing the slack remaining in the job market following the recession and jobless recovery.
That slack remains, however, is evident in a number of indicators from today’s report. First, the share of the unemployed who have been jobless for at least half-a-year was up last month, to 19.2%, an especially high level of long-term unemployment considering the unemployment rate of 4.9%. In fact, historically, when unemployment has been in the 4.9 to 5.5% range (the range since last July), the long-term share of the unemployed has been 11.8%, as opposed to the 20.5% of the current period. Making the same comparison for average weeks spent looking for a job reveals that the average spell of joblessness is a month and a half longer than would be expected, given the unemployment rate over the past year.
Two other indicators of labor slack are weekly hours and hourly wages. Since the recovery began in November 2001, weekly hours among blue-collar workers and non-managers are down slightly, from 33.8 hours per week to 33.7. In the last recovery, they were up by one-half hour per week, from 34 to 34.5. This pattern helps explain the lack of income growth for the median household revealed in the recent Census report ( see EPI’s analysis here).
Finally, hourly wage growth was flat last month, up 0.1%, coming off of July’s stronger 0.4% gain. Over the past year, both average weekly and hourly earnings are up 2.7%, while consumer inflation has been running closer to 3%, meaning the buying power of the typical worker’s paycheck has been losing ground.
In coming weeks, this problem of falling real wages is very likely to worsen. The disruption to the domestic fuel distribution system must now be added to other factors that were already pushing up the price of gas at the retail level. In addition, analysts are warning that the impact of the hurricane and its aftermath threatens to slow overall economic growth over the next few months. If so, workers may well face weaker labor demand in addition to higher inflation.
Today’s report was written by EPI economist Jared Bernstein, with research assistance from Yulia Fungard.
To view archived editions of JOBS PICTURE, click here.
The Economic Policy Institute JOBS PICTURE is published each month upon release of the Bureau of Labor Statistics’ employment report.
EPI offers same-day analysis of income, price, employment, and other economic data released by U.S. government agencies. For more information, contact EPI at 202-775-8810.