EPI’s Daniel Costa appeared as a witness and submitted the following written testimony before the U.S. Senate Committee on the Judiciary, on Wednesday, May 31, 2023 at 10:00 AM, for hearing titled “From Farm to Table: Immigrant Workers Get the Job Done.”
Introduction
Thank you to Senator Durbin, the Committee Chair as well as Ranking Member Graham, and the other distinguished members of the Committee for allowing me to testify at this hearing on the contributions of immigrant workers to the food supply chain and how to better protect them. I am a lawyer and researcher at the Economic Policy Institute, a nonprofit, nonpartisan think tank dedicated to advancing policies that ensure a more broadly shared prosperity, and that conducts research and analysis on the economic status of working America and proposes policies that protect and improve the economic conditions of low- and middle-income workers—regardless of their immigration status—and assesses policies with respect to how well they further those goals. I am also a Visiting Scholar at the Global Migration Center at the University of California, Davis, a university known for its focus on the study of agriculture. UC Davis is the top university in the nation for agricultural sciences, plant and animal sciences, and agricultural economics and policy research.
I am especially honored to be before the Judiciary Committee because I am myself the son of immigrants, each of whom came from a different country and through different immigration pathways, and who met each other in the great melting pot that is my home state of California. The first jobs that most family members on both my mother’s and father’s side had after arriving in the United States were in the food supply chain, in the agricultural heartland of California, the San Joaquin Valley, where I grew up, and now live. My parents and I are the direct beneficiaries of the American immigration system—but I also believe that the United States has benefitted greatly from immigration and the immigrants who arrive—both economically and culturally—which is why there is no question in my mind that immigration is good for the United States. It’s also why I believe that the United States should grow and expand pathways for immigrants, to allow them come and stay and integrate into the United States, and believe we should do much more to improve the migration pathways that currently exist, and we also should regularize immigrants who are in the United States who lack an immigration status or only have a precarious, temporary status, such as Temporary Protected Status, Deferred Action for Childhood Arrivals, and parole.
The purpose of this hearing is to discuss the work that immigrant workers do across the entire food supply chain, from “farm to table,” and how immigration reforms could help immigrant workers and farms and business, as well as how best to protect both U.S. workers and immigrant workers. This hearing is especially timely given the countless stories of abuse and exploitation of immigrant workers who are employed in the low-wage jobs that support America’s food production and distribution. The COVID-19 pandemic exacerbated the already-extreme vulnerabilities of this cohort of workers, who were considered by the federal government to be “essential” and who were required to work in person rather than remotely, and who suffered disproportionately in terms of covid infections and deaths. Despite the plight of workers across the food supply chain being broadcast across the front pages of newspapers and on television, policymakers did little to protect them and honor their contributions.
Employers and industry associations have now been complaining about labor shortages and the lack of a stable workforce and calling for immigration reforms that would provide them with additional workers, but virtually no action has been taken to improve conditions in a number of industries, including agriculture—to help attract and retain workers—nor have the necessary investments been made to improve labor standards enforcement to protect workers in those industries. Without those measures first, it is impossible to know if the claims made by employers are legitimate. In a number of industries, there is little evidence of shortages of workers—but ample evidence that there’s a shortage of decent wages and working conditions on offer—creating a false image of a shortage that employers then wish to resolve with temporary migrant workers who are indentured to them through nonimmigrant work visa programs. The fervor around so-called labor shortages has gotten so intense, in fact, that in response, numerous state legislatures around the country are now passing and proposing laws that peel back the few prohibitions that exist to protect against child labor, as some of my EPI colleagues have recently documented.1
In addition, many migrant workers who are already in the United States lack an immigration status or only have a precarious, temporary status, such as those with DACA and TPS, parole, or those who are asylum seekers, as well as those who are in a temporary nonimmigrant status with a work visa. The status of those workers is subject to change depending on conditions and the whims of policymakers; thus, the first needed step in terms of the immigration system is to stabilize the current workforce by ensuring migrant workers are regularized and have a quick path to permanent residence and citizenship. The employers and industries complaining that the U.S. workforce is not “stable” should look directly at Congress, which has the power to resolve and improve the status of immigrant workers.
Immigration, if done right, may be a perfectly reasonable response to labor shortages, but only when it aligns with broader strategies to lift workplace conditions. Our current workforce—whether migrants or U.S. workers—need and expect support in the form of regularization, access to green cards, and improved wages and working conditions and labor standards. Immigration is not the only policy response available to lawmakers—raising wages and investing in training are other examples of responses—but immigration is certainly an option, if done right.
All immigration pathways, including our refugee and asylum systems, can be vehicles for economic growth and workforce expansion, not just those that are employment-based by design. To the extent that pathways are increased with the primary intention of meeting employer need, those pathways must include, at a minimum, a credible method to determine whether the need is real if shortages exist (and not a system that simply relies on the attestations of employers). U.S. workers must have a fair opportunity to apply and be considered first for U.S. jobs for which they are qualified
When opportunities are offered to migrant workers, they must be fair. At a minimum, migrant workers must be paid fairly according to U.S. standards, have adequate protections against retaliation and access to justice when their rights are violated. As importantly, Congress must create a clear and direct path to permanent residence that the migrant worker controls (rather than one that is controlled by the employer). Unfortunately, when it comes to U.S. temporary work visa programs, the U.S. government is failing to meet these basic standards and provide these basic rights to U.S. workers and migrant workers alike.
Furthermore, two of the most well-known and important temporary work visa programs in the United States, the H-2A visa program—for temporary and seasonal jobs in agriculture—and the H-2B program—for temporary and seasonal jobs outside of agriculture, have been an integral part of the public discourse on migrant workers and the food supply chain. Employer groups and industry associations have been calling to expand and deregulate both programs. Shamefully, policymakers have supported budget riders allowing employers to hire more H-2A and H-2B workers, while also lowering wage standards and watering down other important worker protections.
While the size of both the H-2A and H-2B programs has increased rapidly in recent years—during that time, few, if any, new protections have been implemented to ensure that workers in those programs and industries are adequately protected. Congress and federal agencies have failed to implement needed measures to lift standards and safeguard fundamental rights, despite numerous and egregious cases of worker abuses and exploitation including wage theft, health and safety violations, discrimination, human trafficking, and even death.
My written testimony will discuss the importance of the immigrant workforce in the United States and the need to invest in improving labor standards enforcement to protect workers, with a close look at labor standards enforcement in agriculture, including a discussion of wages for farmworkers and the false narratives around the discussion about the Adverse Effect Wage Rate for H-2A farmworkers. It will then turn to a discussion of U.S. temporary work visa programs, providing a background on their usage and the flaws that are common across them, and offer common sense solutions for the programs in their entirety, along with a specific focus on the H-2A and H-2B visa programs.
Immigrant workers in the U.S. economy and the food supply chain
Numerous scholars, institutions, and government agencies have documented the key role that immigrant and nonimmigrant workers play in the U.S. economy, including in the U.S. food supply chain. Without immigrant workers, many sectors of the economy would cease to function adequately—whether it be the construction of buildings, crop production, or information technology services. This section discusses and cites some of those sources.
Immigrant workers play an important role in nearly all sectors of the economy
The latest report from the Bureau of Labor Statistics (BLS) on the labor force characteristics of foreign-born workers shows that in 2022, immigrant workers accounted for 18.1% of the U.S. civilian labor force, an increase of 0.7% compared to 2021.2 According to the U.S. Census, the share of the U.S. population that is foreign-born was 13.6% in 2021; if this share held in 2022,
It means that immigrants are overrepresented in the labor force by 4.5 percentage points. The labor force participation rate of immigrants was 65.9%, which was 4.4 percentage points higher than the labor force participation rate of the native-born.3
According to BLS, immigrant workers were also “more likely than native-born workers to be employed in service occupations (21.6 percent versus 14.8 percent); natural resources, construction, and maintenance occupations (13.9 percent versus 7.9 percent); and production, transportation, and material moving occupations (15.2 percent versus 12.1 percent).”4 Other sources made similar findings. For example, the Migration Policy Institute (MPI) reported that immigrants accounted for 17% of the workforce between 2017 and 2021, and represented 21% of all workers in the food industry, excluding restaurants. They also reported that immigrants were 18% of transportation workers, 22% of grocery and farm product wholesalers, 35% of meat processing workers, 25% of seafood processing workers, and 16% of grocery retail workers.5
The Immigration Research Initiative also recently reported on the immigrant workforce. “Immigrants are a big and important part of the economy,” the report stresses, with immigrant labor responsible for 17 percent of total GDP in the United States.”6 Contrary to common misperception, the report shows, immigrants work in jobs across the economic spectrum, and in a wide range of occupations. The report underscores two basic realities. On the one hand, the majority of immigrants are in middle- or upper-wage jobs—with 48% employed in middle-wage jobs, earning more than 2/3 of median earnings for full-time workers (or $35,000 per year), and 17% are in upper-wage jobs, earning more than double the median. On the other hand,
immigrants are “at the same time disproportionately likely to be in low-wage jobs. In all, 35 percent of immigrants are in jobs paying under $35,000, compared to 26 percent of U.S.-born workers.”7 The immigrants employed in the food supply chain occupations and industries cited above by MPI, as well as those employed in agricultural jobs like crop farming and livestock production, are overwhelmingly likely to be part of the 35% of immigrants in low-wage jobs.
These data show that immigrant workers are playing a vital role all across the food supply chain and in countless other industries. This is virtually an undisputable claim.
Millions of immigrant workers lack an immigration status or have only a precarious, temporary status, including many in the food supply chain
While the importance of immigrants to the U.S. economy is generally understood, there is generally less discussion about the impact of the different statuses of immigrants in the mainstream public discourse, especially with respect to the varying labor market outcomes associated with those statuses. For employers who claim they lack a “stable” workforce, one of the key drivers is likely to be the lack of a stable and permanent status for too many immigrant workers.
The Pew Research Center has reported on the makeup of the U.S. immigrant population, by immigration status, showing that 45% of immigrants are naturalized citizens, 27% are lawful permanent residents (also known as green card holders), while 23% are unauthorized immigrants who lack status, and 5% of the total foreign-born population are temporarily residing in the United States with nonimmigrant visas.8 The latest estimate from the Center for Migration Studies shows that in 2019 there were 10.3 million total unauthorized immigrants residing in the United States, with 7.3 million of them of working age and participating in the U.S. labor force.9 The United States stands alone in terms of having such high share of its immigrants lacking an immigration status, and no country comes close in terms of an absolute number of unauthorized immigrants.
The 7.3 million unauthorized immigrant workers are not fully protected by U.S. labor laws because they lack an immigration status: Unauthorized workers are often afraid to complain about unpaid wages and substandard working conditions because employers can retaliate against them by taking actions that can lead to their deportation. That also makes it difficult for unauthorized immigrants to join unions and help organize workers. This imbalanced relationship gives employers extraordinary power to exploit and underpay these workers, ultimately making it more difficult for similarly situated U.S. workers to improve their wages and working conditions.
The exploitation described here is not theoretical. A landmark study and survey of 4,300 workers in three major cities found that 37.1% of unauthorized immigrant workers were victims of minimum wage violations, as compared with 15.6% of U.S.-born citizens. Further, an astounding 84.9% of unauthorized immigrants were not paid the overtime wages they worked for and were legally entitled to.10
There are also many migrant workers whose status is in a grey area: they may not have a permanent path to remain in the United States, but have some protection from deportation, along with an Employment Authorization Document (EAD) issued by United States Citizenship and Immigration Services (USCIS), which permits them to work lawfully. Having an EAD reduces the reasonable fear that unauthorized immigrants have of employer retaliation that can lead to deportation. A few of the major categories of migrants with EADs include asylum applicants and those who were recently granted asylum, parolees, those who were granted Temporary Protected Status (TPS) or established prima facie eligibility for TPS, and those who qualified for Deferred Action for Childhood Arrivals (better known as DACA). In fiscal year 2022, there were approximately 1.8 million migrant workers with valid EADs in those categories alone.11
When it comes to the 5% of migrants that Pew estimates are in the United States with temporary visas, I’ve calculated that of that total 5%, approximately 2.1 million are employed in the U.S. labor force in a number of different work visa programs.12 As will be discussed in-depth later in this testimony, the migrant workers in these programs are among the most exploited laborers in the U.S. workforce because the employment relationship created by the visa programs leaves workers powerless to defend and uphold their rights, due to fear of retaliation and deportation. Temporary migrant workers are usually tied to one employer and cannot change jobs if their boss is abusive or breaks the law, and the exorbitant fees charged to them by labor recruiters for employment opportunities in the United States leave workers indebted and indentured to both employers and recruiters.
Three of the main temporary work visa programs utilized by U.S. employers across the food supply chain, for almost exclusively low-wage jobs, are the H-2A, H-2B, and J-1 visa programs. The H-2A program, used almost exclusively by employers in the food supply chain, allows employers to hire workers from abroad for agricultural jobs that normally last less than one year, including picking crops and sheepherding. There is no numerical limit on H-2A visas, and in recent years, the H-2A program has grown sharply, to approximately 300,000 workers in 2022. The H-2B program allows employers to hire temporary workers in low-wage nonagricultural jobs like landscaping, forestry, food processing, hospitality, and construction. There is an annual numerical limit of 66,000, but workers often stay longer than one year or have their stay extended, and congressional appropriations riders have raised the cap in recent years, resulting in approximately 150,000 H-2B workers in 2022 (as discussed later in this testimony). According to the Office of Foreign Labor Certification, approximately 10.5% of H-2B jobs were certified for occupations in the food supply chain.13
The J-1 visa is part of the Exchange Visitor Program, a cultural exchange program run by the State Department that has more than a dozen different J-1 programs, including programs that permit Fulbright Scholars to come to the United States, but also five de facto low-wage work visa programs. J-1 workers are employed in a number of low-wage occupations like au pairs, camp counselors, maids and housekeepers, and lifeguards, but many—especially in the Summer Work Travel program, the largest J-1 program—are employed in the food supply chain, by staffing restaurants, as well as smaller food stores and concessions stands like ice cream shops, including at amusement parks and national parks.14 The Summer Work Travel Program has a numerical limit of 109,000 per year; and 92,619 temporary migrant workers were employed through it in 2022.
Together, there were close to 550,000 temporary migrant workers employed in just these three visa programs in 2022, rivaling the number of low-wage temporary migrant workers at the peak of the Bracero program,15—a program so notorious for worker abuses that Congress eventually shut it down—with the vast majority employed across the food supply chain. Like the Braceros before them, temporary migrant workers in the H-2A, H-2B, and J-1 programs—and most other work visa programs—are indentured to their employers and have limited workplace rights. The trend towards temporary work visa programs—instead of providing migrants with a permanent immigrant status—is a trend that is being observed across the OECD, and has been documented by migration scholars.16 It is a particularly troubling trend, considering the consensus that exists among economists that permanent residence and citizenship raises wages and reduces poverty.17
Immigration is the government’s top federal law enforcement priority while labor standards enforcement agencies are starved for funding and too understaffed to adequately protect workers
Since this hearing is focused on how of immigration and labor are deeply intertwined, it must be noted how Congress has heavily prioritized the enforcement of immigration laws—much to the detriment of labor and employment laws—as evidenced by the massive imbalance in appropriations made to enforce each. For too long, employers have lobbied members of Congress to keep funding levels unrealistically and disastrously low for agencies like the U.S. Department of Labor (DOL) and the National Labor Relations Board (NLRB)—so low that they cannot adequately fulfill their missions. The result is an environment of near impunity for rampant violators of labor and wage and hour laws, a situation brought to light by the recent wave of labor organizing across the country as workers make it clear that they are unwilling to continue accepting unsafe and unjust conditions on the job.
“Budgets are moral documents,”18 and one clear way to understand the priorities of a government is to look at how it spends money. For at least the past decade, the U.S. Congress has placed little value on worker rights and working conditions. A recent comparative analysis I published of federal budget data from 2012 to 2021 reveals that the top federal law enforcement priority of the United States is to detain, deport, and prosecute migrants, and to keep them from entering the country without authorization. Protecting workers in the U.S. labor market—by ensuring that their workplaces are safe and that they get paid every cent they earn—is barely an afterthought.
This situation leaves migrant workers especially vulnerable to employer lawbreaking. There are not enough federal agents to police employers, while a massive immigration enforcement dragnet threatens workers with deportation. Employers take advantage of the climate of fear this creates to prevent workers from reporting workplace abuses. Workers who find the courage to speak up can be retaliated against in ways that can set the deportation process in motion.
The wide gap in government funding between immigration and labor standards enforcement has persisted for at least a decade
In 2013, the Migration Policy Institute made headlines with a report highlighting how appropriations for immigration enforcement agencies exceeded the combined funding for the five main U.S. federal law enforcement agencies by 24%.19 Updating these figures for its 2019 report, the institute revealed how in 2018, after another six years of skyrocketing spending, immigration enforcement agencies received $24 billion, or $25.6 billion in 2021 dollars after adjusting for inflation.20 This amount is “34 percent more than [what was] allocated for all other principal federal criminal law enforcement agencies combined” [italics in original], including the Federal Bureau of Investigation; the Drug Enforcement Administration; the Secret Service; the U.S. Marshals Service; and the Bureau of Alcohol, Tobacco, Firearms, and Explosives. Both reports bring to light the fact that immigration enforcement has undoubtedly become the U.S. government’s top federal law enforcement priority.
Not much has changed since 2018. My analysis of DHS budget documents reveals that Congress appropriated another $25 billion in fiscal year 2021 to enforce immigration laws, while Department of Justice and DHS budget documents show an appropriation of $20.4 billion to the principal federal criminal law enforcement agencies.21
But where do labor standards and worker rights fit in?
My analysis of federal budget data also reveals that government spending on immigration enforcement in 2021 was nearly 12 times the spending on labor standards enforcement—despite the mandate of the labor agencies to protect the 144 million workers employed at nearly 11 million workplaces.22 Labor standards enforcement agencies across the federal government received only $2.1 billion in 2021. (See Figure A.)
This is an important fact to acknowledge, because having a robust system for labor standards enforcement is a key strategy to balance the interests of employers—in having the labor force they need—and those of both immigrant and U.S. workers—in having decent wages and working conditions and recourse when employers break the law. Any new immigration reforms considered by Congress should include increased funding and strong mandates for labor standards enforcement.
Government funding for immigration enforcement was nearly 12 times as much as labor standards enforcement funding in 2021: U.S. government funds appropriated for immigration and labor standards enforcement, 2021
| Immigration enforcement | Labor standards enforcement | |
|---|---|---|
| 2021 | $25.0 | $2.1 |

Notes: Values are adjusted to constant 2021 dollars and reflect totals for the U.S. government’s fiscal year (October 1 to September 30).
Notes: Values are adjusted to constant 2021 dollars and reflect totals for the U.S. government’s fiscal year (October 1 to September 30). The immigration enforcement total for 2021 includes funding for U.S. Customs and Border Protection, U.S. Immigration and Customs Enforcement, and the Office of Biometric Identity Management. Totals for labor standards enforcement include appropriations for all subagencies, administrations, and offices of the U.S. Department of Labor considered for “worker protection” in budget documents, including the Employee Benefits Security Administration, Office of Workers’ Compensation Programs, Wage and Hour Division, Office of Federal Contract Compliance Programs, Office of Labor-Management Standards, Occupational Safety and Health Administration, Mine Safety and Health Administration, and the Office of the Solicitor, in addition to two other agencies not within the Department of Labor: the National Labor Relations Board and the National Mediation Board.
Sources: U.S. Department of Labor, Fiscal Year 2023—Department of Labor, Budget in Brief and Archived Budgets, fiscal years 2012–2022; National Mediation Board, Congressional Justifications, fiscal years 2014–2023; National Labor Relations Board, Performance Budget Justification, fiscal years 2012–2023; and U.S. Department of Homeland Security, DHS Budget, Congressional Budget Justification for Fiscal Years 2012–2023.
The appropriations story is largely the same over the past decade and across three presidential administrations. As Figure B shows, in 2012—a decade ago—Congress appropriated $21.4 billion for immigration enforcement but only $2.4 billion for labor standards enforcement (in constant 2021 dollars). In fact, 2012 was the peak year for labor standards enforcement funding for the 2012–2021 period. Shockingly, the budget for labor standards actually declined by $300 million from 2012 to 2021. Meanwhile, immigration enforcement funding peaked in 2019 at $26.9 billion. The average annual amount appropriated for immigration enforcement funding over the past decade was $23.4 billion, while the average for labor standards enforcement was $2.2 billion.
Over the past decade, average annual funding for immigration enforcement has been over 10 times as much as labor standards enforcement funding: U.S. government funds appropriated for immigration and labor standards enforcement, 2012–2021
| Immigration enforcement | Labor standards enforcement | |
|---|---|---|
| 2012 | $21.4 | $2.4 |
| 2013 | $20.2 | $2.2 |
| 2014 | $21.1 | $2.3 |
| 2015 | $21.7 | $2.3 |
| 2016 | $22.0 | $2.3 |
| 2017 | $23.4 | $2.2 |
| 2018 | $25.6 | $2.2 |
| 2019 | $26.9 | $2.1 |
| 2020 | $26.3 | $2.2 |
| 2021 | $25.0 | $2.1 |
Notes: Values are adjusted to constant 2021 dollars and reflect totals for the U.S. government’s fiscal year (October 1 to September 30).
Notes: Values are adjusted to constant 2021 dollars and reflect totals for the U.S. government’s fiscal year (October 1 to September 30). The immigration enforcement total for 2012 includes appropriations for U.S. Customs and Border Protection (CBP), U.S. Immigration and Customs Enforcement (ICE), and the U.S. Visitor and Immigrant Status Indicator Technology program. Immigration enforcement totals for 2013 to 2018 include appropriations for CBP and ICE. Immigration enforcement totals for 2019 to 2021 include appropriations for CBP, ICE, and the Office of Biometric Identity Management. Totals for labor standards enforcement include appropriations for all subagencies, administrations, and offices of the U.S. Department of Labor considered for “worker protection” in budget documents, including the Employee Benefits Security Administration, Office of Workers’ Compensation Programs, Wage and Hour Division, Office of Federal Contract Compliance Programs, Office of Labor-Management Standards, Occupational Safety and Health Administration, Mine Safety and Health Administration, and the Office of the Solicitor, in addition to two other agencies not within the Department of Labor: the National Labor Relations Board and the National Mediation Board.
Sources: U.S. Department of Labor, Fiscal Year 2023—Department of Labor, Budget in Brief and Archived Budgets, fiscal years 2012–2022; National Mediation Board, Congressional Justifications, fiscal years 2014–2023; National Labor Relations Board, Performance Budget Justification, fiscal years 2012–2023; and U.S. Department of Homeland Security, DHS Budget, Congressional Budget Justification for Fiscal Years 2012–2023.
This estimate for labor standards enforcement appropriations uses an expansive definition that includes federal budget data for fiscal years 2012 to 2021 for the eight subagencies, administrations, and offices that DOL considers for “worker protection,” in addition to the NLRB and the National Mediation Board.
The wide staffing gap between immigration and labor standards enforcement agencies has persisted for at least a decade
Federal budget data show that labor enforcement agencies are staffed at only a fraction of the levels required to adequately fulfill their missions. In 2021, as Figure C shows, Congress gave the 10 labor standards enforcement agencies combined only enough funding to employ fewer than 9,400 personnel, while the immigration enforcement agencies—U.S. Customs and Border Protection (which includes the U.S. Border Patrol), U.S. Immigration and Customs Enforcement (ICE), and the Office of Biometric Identity Management—received enough funds to employ a total of almost 79,000 personnel, more than eight times as many personnel as the labor standards agencies.
In 2021, immigration enforcement agencies had eight times as many staff as labor standards agencies: Annual full-time equivalent staffing levels at immigration and labor standards enforcement agencies, 2012–2021
| Immigration enforcement | Labor standards enforcement | |
|---|---|---|
| 2012 | 81,127 | 12,288 |
| 2013 | 79,373 | 12,297 |
| 2014 | 80,228 | 11,918 |
| 2015 | 78,669 | 11,744 |
| 2016 | 78,585 | 11,465 |
| 2017 | 77,845 | 11,188 |
| 2018 | 78,645 | 10,419 |
| 2019 | 81,112 | 10,843 |
| 2020 | 83,689 | 9,669 |
| 2021 | 78,938 | 9,337 |
Notes: The number of full-time equivalent staff reflects totals for the U.S. government’s fiscal year (October 1 to September 30).
Notes: The number of full-time equivalent staff reflects totals for the U.S. government’s fiscal year (October 1 to September 30). The immigration enforcement staffing total for 2012 includes personnel at U.S. Customs and Border Protection (CBP), U.S. Immigration and Customs Enforcement (ICE), and the U.S. Visitor and Immigrant Status Indicator Technology program. Immigration enforcement staffing totals for 2013 to 2018 include staff at CBP and ICE. Immigration enforcement totals for 2019 to 2021 include staff at CBP, ICE, and the Office of Biometric Identity Management. Totals for labor standards enforcement include appropriations for all subagencies, administrations, and offices of the U.S. Department of Labor considers for “worker protection” in budget documents, including the Employee Benefits Security Administration, Office of Workers’ Compensation Programs, Wage and Hour Division, Office of Federal Contract Compliance Programs, Office of Labor-Management Standards, Occupational Safety and Health Administration, Mine Safety and Health Administration, and the Office of the Solicitor, in addition to two other agencies not within the Department of Labor: the National Labor Relations Board and the National Mediation Board.
Sources: U.S. Department of Labor, Fiscal Year 2023—Department of Labor, Budget in Brief and Archived Budgets, fiscal years 2012–2022; National Mediation Board, Congressional Justifications, fiscal years 2014–2023; National Labor Relations Board, Performance Budget Justification, fiscal years 2012–2023; and U.S. Department of Homeland Security, DHS Budget, Congressional Budget Justification for Fiscal Years 2012–2023.
Figure C also shows the staffing levels for immigration and labor standards enforcement over the past decade, 2012 to 2021. Labor standards enforcement agencies’ staffing levels peaked in 2012 at 12,288. Alarmingly, staffing at those agencies declined by nearly a quarter over the decade, hitting a low of just 9,337 in 2021.
Immigration enforcement staffing for the 2012–2021 period peaked in 2020 at 83,689. Average staff levels over the 10-year period were 79,821 for immigration enforcement and 11,117 for labor standards enforcement; in other words, immigration enforcement agency staff numbers are, on average, 618% greater than those of labor standards enforcement agencies (seven times as many personnel).
The wide funding gap between immigration and labor standards enforcement hurts all workers—including migrant workers
So why does any of this matter? Because it is increasingly more difficult to ensure that all workers—whether they were born in the United States or abroad—are treated fairly in the workplace. Budgets for labor standards enforcement agencies are shrinking, as shown above. Employer tactics such as forced arbitration prevent workers from suing in court when they are robbed by their employers.23 And a growing body of research shows that workers attempting to change jobs face many challenges.24 Making matters worse, without a strong mandate and funding from Congress to enforce labor standards, the executive branch can severely limit the work that labor agencies do on behalf of workers through executive actions, regulatory policy, and even political appointees—something the former Trump administration specialized in.25
Vastly underfunded labor agencies combined with enforcement-only immigration policies hypercharged by runaway budgets risk enabling retaliation against immigrant workers who stand up for their rights on the job. When immigrant workers can’t stand up for their rights, it degrades labor standards for their American counterparts working alongside them.26 Perhaps that is why employers rob their immigrant employees at much higher rates than those who are U.S. citizens.27
All workers face too much risk if they act to make their workplaces safer and fairer. But for nearly 8 million workers—roughly 5% of the U.S. labor force28—those risks include deportation and family separation because they lack immigration status.
Temporary migrant workers represent another significant and rapidly growing segment of the workforce. These are migrant workers employed through temporary visas (known as “nonimmigrant” visas under U.S. law).29 There are roughly 2 million temporary migrant workers employed in the United States, accounting for 1.2% of the total labor force.30 These workers have good reason to fear retaliation and deportation if they speak up about wage theft, workplace abuse, or working conditions such as substandard health and safety procedures on the job—not because they lack valid immigration status but because their visas are almost always tied to a single employer who controls both their livelihoods and their visa status.
No worker should ever have to risk deportation in order to file a claim with a labor agency, but that’s the reality for 6% of the entire U.S. workforce in a grossly imbalanced enforcement context.
Effective labor standards enforcement in agriculture is necessary to protect farmworkers
Now that I have contextualized the state of labor standards enforcement in the United States vis-à-vis immigration enforcement, I turn to a discussion of labor standards enforcement in agriculture.
Farmworkers in the United States: A background on numbers and the existing legal framework
Farmworkers support the first and most important element of the food supply chain, by growing and picking crops and tending to livestock. Yet farmworkers in the United States earn some of the lowest wages in the labor market and experience an above-average rate of workplace injuries.31 In addition, a large share of them are also vulnerable to exploitation and abuse in the workplace because of their immigration status.
No one knows the exact number of workers employed for wages on U.S. farms during the year, although there are multiple estimates. The Quarterly Census of Employment and Wages (QCEW) shows that average annual employment of farmworkers who are employed on farms that report to state unemployment insurance (UI) agencies was 1.2 million in 2021,32 but estimated that there were an additional 300,000 “wage and salary” farmworkers not included in QCEW data,33 suggesting average employment of 1.5 million in 2019.
The QCEW reports average employment, which underestimates the number of unique farmworkers due to seasonality and turnover. The Census of Agriculture (COA) asks farmers (i.e. farm employers or farm owners) how many workers they employ directly; in 2017, farmers reported hiring 2.4 million farmworkers.34 However, the COA does not report workers who are brought to farms by nonfarm employers such as nonfarm labor contractors, and double counts workers employed by two farms, so 2.4 million is not a count of unique farm workers. The Current Population Survey included a December supplement through the 1980s, and it reported about 2.5 million farmworkers when annual average employment ranged between about 1.1 million to 1.3 million, suggesting about two unique workers per year-round equivalent job, or 2.5 million to 3.4 million workers today based on QCEW data.35
The U.S. Department of Labor’s National Agricultural Workers Survey (NAWS) reports the characteristics of crop farmworkers, excluding those who are migrants employed through the H-2A temporary work visa program for agriculture, but not their number. The NAWS reports that 44% of the non-H-2A crop workers were unauthorized immigrants in 2019–2020,36 and as discussed above there were roughly 300,000 H-2A workers employed in the United States in 2022, who worked for an average of six months out of the year, representing roughly 10% to 15% of farmworkers employed on U.S. crop farms. Both unauthorized and H-2A workers have limited labor rights and are vulnerable to wage theft and other abuses due to their immigration status.37 The remaining farm workforce, roughly just under half of all farmworkers, are U.S. citizens and legal immigrants with full rights and agency in the labor market. But that means that roughly half of all farmworkers are vulnerable to violations of their rights because of their lack of an immigration status or their precarious, temporary immigration status.
The U.S. Department of Labor’s (DOL) Wage and Hour Division (WHD) is the federal agency that protects the rights of farmworkers in terms of wage and hour laws, including those that protect H-2A workers. WHD labor standards enforcement actions are intended to ensure that the rights of workers are protected, and to level the playing field for employers, so that employers that underpay workers or engage in other cost-reducing behavior in violation of wage and hour laws do not gain a competitive advantage over law-abiding employers. WHD aims to “promote and achieve compliance with labor standards to protect and enhance the welfare of the nation’s workforce” by enforcing 13 federal labor standards laws, including the Fair Labor Standards Act (FLSA), which requires minimum wages and overtime pay, and regulates the employment of workers who are younger than 18, as well as the Family and Medical Leave Act, and laws governing government contracts, consumer credit, and the use of polygraph testing, etc.38 WHD also enforces two laws and their implementing regulations specific to agricultural employment. One is the Migrant and Seasonal Agricultural Worker Protection Act (MSPA), the major federal law that protects U.S. farmworkers. The other is the statute that establishes the H-2A program.
However, federal law exempts farmworkers from some of the basic protections that cover most other workers in the U.S. labor market. The National Labor Relations Act—the federal law that provides the right to form and join unions, and to engage in protected, concerted activities to improve workplace conditions, does not protect farmworkers. Only California and New York have enacted state legislation to allow farmworkers to have the rights covered by the federal NLRA. Farmworkers are partially covered by the FLSA, but not the FLSA’s overtime provisions that require most workers to be paid time and a half after working eight hours in a day or 40 hours in a week. Some states, including California and New York, have enacted laws that are gradually phasing-in the overtime threshold for farmworkers until it eventually reaches 8 hours per day and/or 40 hours per week, while a small number of states have enacted or are phasing-in overtime thresholds for farmworkers that require a higher number of hours worked per week before farmworkers get overtime pay, with some of the laws nevertheless still exempting many farmworkers from overtime pay.39
Data on labor standards enforcement on farms reveal the biggest violators and raise new questions about how to improve and target efforts to protect farmworkers
In December 2020, Dr. Philip Martin, Dr. Zach Rutledge, and I published a lengthy report analyzing 20-years of data from WHD on their enforcement actions in agriculture,40 and Martin and I analyzed more recent data for a forthcoming EPI report that will be published later this year. The rest of this section highlights some of the key findings from those two reports.
The number of federal and wage and hour inspections continued to decline and hit a record low in 2022 under the Biden administration
This section analyzes WHD’s aggregate enforcement data. WHD conducted over 34,000 investigations in U.S. agriculture between fiscal years 2000 and 2022, an average of almost 1,500 per year (1,485). The WHD data we use represent investigations that were closed by year (meaning they have been concluded or resolved), which means that some cases may have begun in earlier fiscal years, and some that began in the current fiscal year are not included because they have not yet been closed.
Figure D shows a clear downward trend in the number of closed WHD investigations of agricultural employers over the past two decades, from more than 2,000 a year in the early 2000s to 1,000 or fewer a year during the last two fiscal years, i.e., during the Biden administration. In 2022, WHD conducted only 879 investigations of agricultural employers, an average of 73 a month, and just over a third of the 2,431 agricultural investigations conducted in 2000, the peak year for WHD agricultural investigations.
The number of federal wage and hour investigations of farms hit record low in 2022: Wage and Hour Division investigations of agricultural employers, fiscal years 2000–2022
| Fiscal Year | Inspections of agricultural employers |
|---|---|
| 2000 | 2,431 |
| 2001 | 2,300 |
| 2002 | 2,176 |
| 2003 | 1,495 |
| 2004 | 1,630 |
| 2005 | 1,449 |
| 2006 | 1,410 |
| 2007 | 1,666 |
| 2008 | 1,600 |
| 2009 | 1,377 |
| 2010 | 1,277 |
| 2011 | 1,527 |
| 2012 | 1,659 |
| 2013 | 1,673 |
| 2014 | 1,430 |
| 2015 | 1,361 |
| 2016 | 1,275 |
| 2017 | 1,307 |
| 2018 | 1,076 |
| 2019 | 1,125 |
| 2020 | 1,036 |
| 2021 | 1,000 |
| 2022 | 879 |
Source: Authors’ analysis of U.S. Department of Labor, Wage and Hour Division, Agriculture data table.
Few investigations mean that most farms are never investigated by WHD
The Census of Agriculture (COA) reported over 513,000 U.S. farms with labor expenses for directly hired workers in 2017,41 and 112,134 agricultural establishments were registered with state unemployment insurance agencies in the third quarter of 2022, according to the QCEW.42
At 879 WHD investigations of agricultural employers in 2022, and using the QCEW number of establishments in 2022 as a reference for the number of agricultural employers—which includes only farms registered in the unemployment insurance system—the probability that a farm will be investigated for violating federal wage and hour laws in a given year is less than one percent: 0.7%.43
Despite the low number of investigations, it is also true that when WHD investigators inspect an agricultural employer, they nearly always detect violations of wage and hour laws. As we reported in 2020 and will discuss below, WHD detects violations 70% of the time they conduct an investigation—a sign that many agricultural employers are violating the law. Among the 70% of investigations that detected violations between 2005 and 2019, almost 40% found one to four violations on the farm and 31% found five or more.44
DOL’s Wage and Hour Division is underfunded and understaffed
Why are there so few investigations of agricultural employers? A major reason is too little funding and staffing, a topic we have addressed before.45 The Wage and Hour Division is responsible for enforcing provisions of several federal laws related to minimum wage, overtime pay, child labor, federal contract workers, work visa programs, migrant and seasonal agricultural workers, family and medical leave, and more. Yet, despite this broad portfolio and the 165 million workers who are covered by these protections,46 funding for WHD has not kept pace with the growth of the U.S. labor force.
Figure E shows that, in inflation-adjusted 2022 dollars, WHD’s budget in 2006 was $241 million, and in 2022, $246 million, an increase of just $5 million over nearly two decades. Lack of funding for WHD reflects the general decline in overall labor standards enforcement spending across the federal government from $2.4 billion in 2012 to $2.1 billion in 2021 (in 2021 dollars).47
In 2022, funding for the Wage and Hour Division was roughly the same as in 2006: Funding for the Wage and Hour Division in the U.S. Department of Labor, fiscal years 2006–2022
| Fiscal Years | Annual funding for the Wage and Hour Division |
|---|---|
| 2006 | $241,049,000 |
| 2007 | $245,012,000 |
| 2008 | $239,318,000 |
| 2009 | $263,988,000 |
| 2010 | $306,124,000 |
| 2011 | $296,769,000 |
| 2012 | $289,918,000 |
| 2013 | $270,742,000 |
| 2014 | $277,550,000 |
| 2015 | $280,988,000 |
| 2016 | $277,410,000 |
| 2017 | $271,569,000 |
| 2018 | $265,107,000 |
| 2019 | $262,106,000 |
| 2020 | $273,570,000 |
| 2021 | $265,686,000 |
| 2022 | $246,000,000 |
Note: Dollar amounts reported have been adjusted for inflation to constant 2022 dollars using the CPI-U-RS. As a result, the dollar amounts presented here may differ from the amounts reported in the source data.
Source: Department of Labor, Budget, Performance, and Planning reports, fiscal years 2008-2022, available at https://www.dol.gov/general/budget, accessed February 27, 2023.
Yet, in addition to the lack of funding and the more than 165 million workers WHD has a mandate to protect, the number of WHD investigators that the agency employs, who are primarily responsible for ensuring that federal wage and hour laws are actually followed on the ground across all 50 states and U.S. territories, is near an all-time low.
Figure F shows that there were only 810 WHD investigators at the end of November 2022 to enforce all federal wage and hour laws, two fewer than in 1973, the first year for which data are available, and 422 fewer than the peak year of 1978, when there were 1,232 WHD investigators. Meanwhile, the number of workers that WHD has a mandate to protect has increased sharply. The average number of WHD-covered workers in 2022 was 164.3 million, which amounts to 202,824workers for every wage and hour investigator. Compare this to 1973, when there were 72,588 covered workers for every wage and hour investigator.48 Investigators are now responsible for almost triple the number of workers than in 1973 (2.8 times more).
Number of federal wage and hour investigators is near its historic low: Number of Wage and Hour Division investigators, U.S. Department of Labor, 1973–2022
| Year | Investigators on board at year’s end |
|---|---|
| 1973 | 812 |
| 1974 | 869 |
| 1975 | 921 |
| 1976 | 964 |
| 1977 | 980 |
| 1978 | 1,232 |
| 1979 | 1,087 |
| 1980 | 1,059 |
| 1981 | 953 |
| 1982 | 914 |
| 1983 | 928 |
| 1984 | 916 |
| 1985 | 950 |
| 1986 | 908 |
| 1987 | 951 |
| 1988 | 952 |
| 1989 | 970 |
| 1990 | 938 |
| 1991 | 865 |
| 1992 | 835 |
| 1993 | 804 |
| 1994 | 800 |
| 1995 | 809 |
| 1996 | 781 |
| 1997 | 942 |
| 1998 | 942 |
| 1999 | 938 |
| 2000 | 949 |
| 2001 | 945 |
| 2002 | 898 |
| 2003 | 850 |
| 2004 | 788 |
| 2005 | 773 |
| 2006 | 751 |
| 2007 | 732 |
| 2008 | 731 |
| 2009 | 894 |
| 2010 | 1,035 |
| 2011 | 1,024 |
| 2012 | 1,067 |
| 2013 | 1,040 |
| 2014 | 976 |
| 2015 | 995 |
| 2016 | 974 |
| 2017 | 912 |
| 2018 | 835 |
| 2019 | 780 |
| 2020 | 823 |
| 2021 | 782 |
| 2022 | 810 |
Note: Numbers represent Wage and Hour Division investigators on staff at the end of each fiscal year (the federal government's fiscal year runs from October 1 to September 30), except for 2022, which represents the number of investigators on staff at the end of November 2022.
Sources: Author’s analysis of Wage and Hour Division (WHD) data on number of investigators from unpublished Excel files provided by WHD staff members to the author. Source for 2020 and 2021 is Rebecca Rainey, “Wage-Hour Investigator Hiring Plans Signal DOL Enforcement Drive,” Bloomberg Law, January 28, 2022. Source for 2022 is Rebecca Rainey, "Wage Division Enforcement Declines Again in Wake of Hiring Woes," Bloomberg Law, Decemer 28, 2022.
Another issue related to the funding and staffing challenges, has reportedly been WHD’s “issues with recruiting and retaining employees.” Bloomberg Law reported in December 2022 that WHD has “struggled to recruit new investigative staff” and WHD’s overall back wages recovered, employees who received back wages, and total number of hours spent on investigations “all dropped in fiscal year 2022 compared to the year prior” according to WHD data.49 Despite WHD’s stated intention to hire 100 new investigators in the Biden administration, a heavy workload and inadequate funding from Congress appears to be hindering WHD from hiring enough staff for the tasks at hand.
Despite few investigations, the amount of back wages and civil money penalties assessed by WHD are on a generally upward trend
Nonetheless, Figure G shows that despite fewer investigations and WHD investigators, the total back wages owed for all violations of federal wage and hour laws in agriculture has been on a generally upward trend. Figure G shows the back wages owed and civil money penalties assessed in agriculture between 2000 and 2022. (Back wages are the amount that WHD assesses is due to be paid to the workers by their employers as the result of an investigation. Civil money penalties, or CMPs, are additional monetary fines levied by WHD to punish and deter employers from violating wage and hour laws.) Both back wages and CMPs have been on a generally upward trend over the 23-year period, although there was a significant dip in back wages in 2022. Back wages peaked at $9.7 million in 2013 during the Obama administration, the same year that civil money penalty assessments peaked at $9.2 million. (All amounts are adjusted to constant 2022 dollars.)
Back wages owed and civil money penalties assessed in agriculture have been on a generally upward trend since 2000: Back wages and civil money penalties assessed (in millions of dollars) against agricultural employers by the Wage and Hour Division, fiscal years 2000–2022
| Fiscal year | Back wages | Civil money penalties |
|---|---|---|
| 2000 | $2.27 | $2.34 |
| 2001 | 2.86 | 2.09 |
| 2002 | 3.31 | 1.93 |
| 2003 | 3.89 | 1.81 |
| 2004 | 1.89 | 2.57 |
| 2005 | 2.00 | 1.60 |
| 2006 | 2.46 | 1.18 |
| 2007 | 4.51 | 2.04 |
| 2008 | 2.88 | 1.84 |
| 2009 | 1.92 | 1.72 |
| 2010 | 4.24 | 1.48 |
| 2011 | 3.72 | 2.53 |
| 2012 | 6.73 | 5.84 |
| 2013 | 9.67 | 9.18 |
| 2014 | 5.57 | 3.83 |
| 2015 | 5.33 | 6.25 |
| 2016 | 5.91 | 4.31 |
| 2017 | 6.03 | 5.18 |
| 2018 | 4.90 | 7.63 |
| 2019 | 6.94 | 7.24 |
| 2020 | 8.11 | 7.25 |
| 2021 | 9.12 | 7.89 |
| 2022 | 5.82 | 7.98 |
Note: Dollar amounts reported have been adjusted for inflation to constant 2022 dollars using the CPI-U-RS. As a result, the dollar amounts presented here may differ from the amounts reported in the source data.
Source: Authors’ analysis of U.S. Department of Labor, Wage and Hour Division, Agriculture data table (last accessed February 26, 2023).
When WHD investigates, 70% of the time they detect employer violations
In addition, despite fewer investigations, it is the case that when WHD initiates an investigation of an agricultural employer, they often find violations. Figure H groups the number of violations found per investigation during the FY2005–FY2019 period, from zero to more than five violations per investigation. When looked at this way, the data reveal a U-shape among the violators, with almost 30% of investigations bunched at the zero and 31% bunched at more than five violations; those two ends of the spectrum account for almost two-thirds of the violations, while 17% of investigations found one violation and 23%, nearly a quarter, found two to four violations. However, overall, the data show that 70% of all investigations detected violations, while 30% detected zero violations. In addition, it should be noted that this figure does not account for the severity of the violations or the amounts assessed. In other words, some investigations that detected one or two violations may have detected egregious violations and found employers owing large amounts of back pay, while investigations that detected with five or more violations may have resulted in smaller amounts of back wages owed.
Over 70% of federal investigations of agricultural employers detected wage and hour violations: Violations detected during investigations of agricultural employers, by number of violations found per investigation, fiscal years 2005–2019
| Number of violations | Share of investigations |
|---|---|
| 0 violations | 29.5% |
| 1 violation | 16.7% |
| 2–4 violations | 22.7% |
| 5+ violations | 31.1% |
Note: Data include H-2A, MSPA, FLSA, and all other types of employment law violations in the agricultural sector.
Source: Authors' analysis of U.S. Department of Labor, Wage and Hour Compliance Action Data (U.S. DOL-WHD 2020f).
Farm labor contractors are the worst violators of wage and hour laws in agriculture
One particular area of interest to highlight with respect to wage and hour enforcement in agriculture is the employment of farmworkers by farm labor contractors (FLCs). FLCs are nonfarm employers that act as staffing firms for farm employers. For FLCs, which correspond to NAICS code 115115, average employment was 181,000 in 2019, according to the Quarterly Census of Employment and Wages from DOL; FLCs are a subset of the Support Activities for Crop Production category (NAICS 1151), which had average employment of 342,000 in 2019, meaning that FLCs accounted for 53% of U.S. crop support services employment.
FLCs accounted for 14% of total average employment in UI-covered agriculture of 1.3 million in 2019—including employment in both crops and animal agriculture—but accounted for one-quarter of all wage and hour law violations detected in agriculture (24%). Thus, the share of agricultural employment law violations committed by farm labor contractors was 10 percentage points greater than the FLC share of average annual agricultural employment. In practical terms, that means that farmworkers employed by FLCs or on farms that use FLCs are more likely to suffer wage and hour violations than farmworkers who are employed by farms directly.
We also found that 75% of all WHD investigations of FLCs detected violations, while 25% of investigations detected zero violations. We grouped the number of violations detected per investigation of FLCs, as shown in Figure I. The share of investigations of FLCs that found zero violations, at 25%, was significantly less than the share of investigations of FLCs that found five or more violations, 36%. Nearly two-fifths of investigations detected either one violation or two to four violations.
Three-fourths of federal investigations of farm labor contractors detected wage and hour violations: Violations detected during investigations of farm labor contractors, by number of violations found per investigation, fiscal years 2005–2019
| Number of violations | Share of investigations |
|---|---|
| 0 Violations | 25.3% |
| 1 Violation | 15.9% |
| 2–4 Violations | 22.9% |
| 5+ Violations | 35.9% |
Source: Authors' analysis of U.S. Department of Labor, Wage and Hour Compliance Action Data (U.S. DOL-WHD 2020f).
We also reviewed violations by FLCs in the two major agricultural states of California and Florida. California and Florida each accounted for 14% of the total wage and hour violations detected as the result of WHD investigations nationwide, by far the most, followed by North Carolina with 10%, Texas and Washington with 5% each, and Oregon with 4%. These six states accounted for 52% of all wage and hour law violations found in agriculture. In the two states with the highest shares of violations, California and Florida, FLCs accounted for the largest share of the violations detected by WHD investigators. Figure J shows that FLCs accounted for 48% of the total violations in California during fiscal years 2005 to 2019, and Figure K shows that FLCs accounted for 50% of the total violations detected in Florida over the same period. This finding is particularly significant for California, given that FLCs now account for a majority of crop employment in the state.50
Employer violations detected in California by the Wage and Hour Division among all agricultural employers and farm labor contractors, fiscal years 2005–2019
| Year | Violations by all agricultural employers | Violations by farm labor contractors |
|---|---|---|
| 2005 | 1,233 | 972 |
| 2006 | 4,166 | 918 |
| 2007 | 1,931 | 1,189 |
| 2008 | 2,911 | 1,469 |
| 2009 | 2,202 | 1,645 |
| 2010 | 1,577 | 363 |
| 2011 | 2,909 | 1,949 |
| 2012 | 4,589 | 1,556 |
| 2013 | 5,420 | 3,348 |
| 2014 | 3,079 | 1,302 |
| 2015 | 2,181 | 947 |
| 2016 | 2,113 | 1,490 |
| 2017 | 1,902 | 570 |
| 2018 | 2,794 | 733 |
| 2019 | 315 | 240 |
Note: Violations by California farm labor contractor are a subset of employment law violations detected among all agricultural employers in California.
Source: Authors' analysis of U.S. Department of Labor, Wage and Hour Compliance Action Data (U.S. DOL-WHD 2020f).
Employer violations detected in Florida by the Wage and Hour Division among all agricultural employers and farm labor contractors, fiscal years 2005–2019
| Year | Violations by all agricultural employers | Violations by farm labor contractors |
|---|---|---|
| 2005 | 1,225 | 670 |
| 2006 | 1,484 | 686 |
| 2007 | 4,469 | 1,643 |
| 2008 | 1,989 | 1,021 |
| 2009 | 2,034 | 1,020 |
| 2010 | 2,886 | 545 |
| 2011 | 4,045 | 1,726 |
| 2012 | 4,633 | 2,765 |
| 2013 | 2,380 | 1,084 |
| 2014 | 3,744 | 1,986 |
| 2015 | 3,338 | 2,360 |
| 2016 | 1,871 | 1,182 |
| 2017 | 1,837 | 974 |
| 2018 | 1,412 | 1,112 |
| 2019 | 989 | 455 |
Note: Violations by Florida farm labor contractor are a subset of employment law violations detected among all agricultural employers in Florida..
Source: Authors' analysis of U.S. Department of Labor, Wage and Hour Compliance Action Data (U.S. DOL-WHD 2020f).
Violations in the H-2A visa program account for a growing share of back wages owed and civil money penalties assessed in agriculture—rising to nearly three-fourths during the Biden administration
WHD’s aggregate data on enforcement in agriculture list separately the violations detected when enforcing the three major federal employment laws and regulations covering farmworkers: (1) those that govern the H-2A visa program, (2) the Migrant and Seasonal Agricultural Worker Protection Act (commonly referred to as MSPA), the major federal law that protects U.S. farmworkers, and (3) the Federal Labor Standards Act (FLSA) along with all other wage and hour laws that WHD enforces.51 FLSA is the law that requires minimum wages and overtime pay and regulates the employment of workers who are younger than 18.
In order to have a better sense of which laws are being violated, we summed the back wages owed and the CMPs assessed for the 23-year period for which data are available (fiscal years 2000-22), for violations of H-2A, MSPA, and FLSA et al. (FLSA plus all other violations).52 We divided the sum of back wages and CMPs under each law by the sum of total back wages and CMPs assessed by WHD for the entire 23-year period, which gave us the relevant shares of back wages and CMPs that correspond to each law. (Note that employers often violate several wage and hour laws at once; WHD categorizes cases by the three major laws and they may overlap, but the sum of the three major categories corresponds closely with the total back wages and CMPs assessed by WHD.)
We found that violations of H-2A rules account for much higher shares of back wages owed and CMPs assessed than violations of other laws, and now account for an overwhelming share of the back wages owed and CMPs assessed.
Table 1 shows the shares of total back wages owed and CMPs assessed (combined) by type of legal violation for the 2000-22 period. H-2A violations accounted for nearly half (46%) of all back wages owed to farmworkers and CMPs assessed over the 23-year period, and their share rose sharply during the two years of the Biden administration. As Table 3 shows, WHD investigations during the Trump administration found that H-2A violations accounted for roughly half of the back wages and CMPs owed by farm employers during 2017-20, but the H-2A share rose to 73%, almost three-fourths, during the Biden administration. As a result, WHD investigations that find H-2A violations now account for the vast majority of back wages owed and CMPs assessed.
Violations of the H-2A visa program account for most of the back wages owed and civil money penalties assessed in agriculture: Share of total back wages owed and civil money penalties assessed by the Wage and Hour Division against agricultural employers, by type of legal violation, fiscal years 2000–2022
| Fiscal Year | H-2A | MSPA | FLSA et al. |
|---|---|---|---|
| 2000 | 8% | 36% | 54% |
| 2001 | 24% | 37% | 36% |
| 2002 | 12% | 36% | 49% |
| 2003 | 19% | 24% | 55% |
| 2004 | 11% | 42% | 41% |
| 2005 | 27% | 29% | 42% |
| 2006 | 11% | 31% | 56% |
| 2007 | 11% | 29% | 58% |
| 2008 | 31% | 31% | 37% |
| 2009 | 27% | 42% | 30% |
| 2010 | 17% | 23% | 59% |
| 2011 | 33% | 27% | 37% |
| 2012 | 52% | 18% | 30% |
| 2013 | 70% | 10% | 20% |
| 2014 | 41% | 22% | 36% |
| 2015 | 59% | 16% | 25% |
| 2016 | 44% | 20% | 36% |
| 2017 | 49% | 20% | 30% |
| 2018 | 47% | 31% | 22% |
| 2019 | 42% | 34% | 23% |
| 2020 | 52% | 17% | 30% |
| 2021 | 73% | 10% | 17% |
| 2022 | 73% | 11% | 16% |
| TOTALS | 46% | 22% | 31% |
Note: Values represent the share of total back wages and civil money penalties assessed by the Wage and Hour Division (WHD) in the U.S. Department of Labor in a given fiscal year, according to the three broad categories of laws listed by WHD. "H-2A" represents violations of the laws and regulations governing the H-2A visa program; "MSPA" represents the Migrant and Seasonal Agricultural Worker Protection Act (commonly referred to as MSPA), which is the major federal law that protects U.S. farmworkers, and "FLSA et al." represents the Fair Labor Standards Act (FLSA), which WHD data group with all other wage and hour laws that WHD enforces. FLSA is the U.S.’ main worker protection law that requires minimum wages and overtime pay and regulates the employment of workers younger than 18.
Source: Authors’ analysis of U.S. Department of Labor, Wage and Hour Division, Agriculture data table (last accessed February 26, 2023).
Recommendations to improve farm employer compliance with wage and hour laws and better protect farmworkers
Based on my research and the evidence presented in this testimony, it is clear that the first step to improve employer compliance with wage and hour laws on farms should be to hire more investigators to detect more violations—which will require Congress to appropriate more funding to WHD. Outgoing Labor Secretary Marty Walsh recently expressed a similar sentiment to the Washington Post, noting that he hoped Congress would provide “more money for enforcement officers…[because] you can’t handle the number of complaints if you don’t have the number of officers.”53 For fiscal year 2024, WHD has requested $81 million in additional funds compared to their 2023 funding level, which would result in an increase of 398 full-time staff across the agency (not just WHD investigators).54
Absent more funding from Congress, WHD will need to better target currently available resources, issue larger fines and more significant sanctions, and more frequently utilize existing legal mechanisms to encourage compliance, such as using the joint employment standard under the Fair Labor Standards Act and the Migrant and Seasonal Worker Protection Act, to hold farms accountable for FLC violations.55 If farm operators are jointly liable for violations committed by the FLCs that bring workers to their farms, they will have incentives to police their FLCs to ensure FLCs comply with the law. The concept of joint employment is longstanding, but DOL could use it more often and strengthen H-2A regulations to make clear that farm employers will be held jointly responsible for the actions of their FLCs.
In addition, when serious violations of FLSA are found, WHD can file a lawsuit asking a federal court for an injunction that seeks to prohibit the shipment and distribution of goods produced in violation of FLSA’s minimum wage, overtime, or child labor requirements, with what’s known as the “hot goods” provision.56 This supply-chain approach can be very effective because it sends a message to all businesses that they must not facilitate or acquiesce in wage and hour violations, and was used by former WHD administrator David Weil.57
Third, Congress and the Administration must recognize that the farm workforce of 2.4 million is becoming more vulnerable and in need of additional protection58—which requires both legislative and administrative action. About 70% of U.S. farmworkers were born in Mexico,59 and they include two very vulnerable groups, the unauthorized immigrants who arrived in their 20s and 30s in the 1990s—and are now in their 50s and may lack the language and skills to find nonfarm jobs—and temporary migrant H-2A workers who are tied to their employers by contracts, which means that they lose their right to remain in the United States if they lose their jobs. Most of the 5% of farmworkers from Central America are likely to be in a similar situation and facing similar challenges.60 Children and indigenous workers who hail from Latin America are also laboring in the fields and need protection.
A path to citizenship for unauthorized farmworkers, which would require legislation from Congress—or work authorization through deferred action or parole, which could be accomplished through the executive branch—could reduce the vulnerability of unauthorized farmworkers by allowing them to exercise their workplace rights. Options to increase the mobility of H-2A workers, such as regulations allowing them to more easily change employers, could be explored. The recent announcement by the Department of Homeland Security (DHS) that clarifies the process for how migrant workers in labor disputes can access immigration protections can bolster worker protections from retaliation.61 WHD and other agencies within the Labor Department should issue more letters and statements of interest in support of deferred action for farmworkers and coordinate with DHS to facilitate quick adjudications that reflect the unique pressures faced by unauthorized and H-2A farmworkers.
And fourth, absent additional funding and resources to conduct more investigations, WHD should strategically target for enforcement the employers most likely to violate wage and hour laws, including the farm labor contractors who account for the largest share of violations,62 and employers who hire farmworkers through the H-2A visa program. Among the farms found to have committed wage and hour violations, as we showed in our 2020 report, repeat violators account for a significant share of the violations found in particular commodities and regions, which suggests the need to develop enforcement strategies that identify and monitor farm employers whose business models seem to be based on violating the law.63
Creating a front-end screening process to prohibit employers from hiring through H-2A if they have a track record of violating wage and hour and labor laws, for instance, could make a significant impact and lessen the burden on WHD’s investigators.64 And requiring program violators to submit certified payroll information periodically, and developing a mobile app for farmworkers to report their wages and hours, could give WHD early warning of potential violations as well as provide workers with a way to anonymously report violations.
Monitoring working conditions in the fields has always been challenging and is becoming more and more difficult. The Wage and Hour Division needs more investigators, more funding, and more effective strategies to protect farmworkers, which needs to be bolstered by political will in the legislative and executive branches to overcome opposition from those who believe that farm employers are somehow above needing to follow basic workplace laws. This is driven by a narrative of agricultural “exceptionalism”—which is the belief that agriculture is such a different industry with such unique operations that it lies outside of—and thus should not be regulated by—the usual labor and employment law framework. This view unfortunately has a well-established and harmful foothold in our laws and politics, resulting in legal carveouts of farmworkers from many of the bedrock labor standards protections that have covered workers outside of agriculture for decades at the federal and state level. Over the past half century, public acceptance of agricultural exceptionalism has finally begun to erode, but the job is far from complete. Additional enforcement resources are needed to ensure that farm employers play by the rules and that all farmworkers are guaranteed their basic rights for fair pay and working conditions.
Are farmworkers overpaid? Dispelling the myths about farmworker wages and the H-2A visa program
The public discourse around the wage of farmworkers has recently reached a fever pitch; with farm employers and industry associations arguing that the wages of farmworkers—but particularly temporary migrant farmworkers in the H-2A visa program—have risen too quickly and are out of control. As a response, farm employers and industry associations have called on and lobbied Congress to take action to reduce the required wage rates for H-2A farmworkers, known as the Adverse Effect Wage Rate (AEWR) and sued the U.S. Department of Labor (DOL) to invalidate the AEWR, which is designed to reflect the current wages in the farm labor market, with the intention of protecting wage standards for all U.S. and migrant farmworkers in the United States. This effort it underway despite the fact that, as noted above, most farmworkers are not covered by many basic federal labor and wage and hour law protections that other workers have, such as overtime pay.
The most recent attempt to reduce the value of the AEWR has occurred in just the past month, with legislators in the House and Senate each proposing legislation to use the Congressional Review Act (CRA) to repeal the most recent update to the AEWR from DOL that went into effect on March 30, 2023—which made only a slight change to the existing methodology, impacting very few farmworkers and a miniscule share of farm employers’ labor costs. This section will briefly discuss the state of farmworker wages, take a historical look at the value of the AEWR over the past decade and in the most recent years, and discuss the recent proposal to use the CRA to repeal the latest iteration of the AEWR.
Farmworkers earn lower wages than workers in other low-wage industries
The most reliable data on farmworker earnings comes from the U.S. Department of Agriculture’s (USDA) National Agricultural Statistics Service (NASS), which conducts the Farm Labor Survey (FLS), the results of which are published twice a year in USDA’s Farm Labor report series, with data reported for reference weeks in January, April, July, and October.65 As noted above, the minimum wage that employers are required to pay to H-2A farmworkers is in most cases the Adverse Effect Wage Rate (AEWR),66 which varies by region and is set by DOL, based on the average hourly earnings of nonsupervisory field and livestock workers, as reported by farm operators in the FLS. DOL uses the FLS data to set H-2A wages so they reflect current real-world trends in the farm labor market.
Despite some documented real increases in wages the past few years,67 the latest data show the wages of farmworkers are extremely low by any measure, even when compared with similarly situated nonfarm workers and workers with the lowest levels of education (see Figure L).
The farmworker wage gap in 2022: Farmworkers earn very low wages compared with other workers: Average hourly wage rate for nonsupervisory farmworkers nationwide compared with average hourly wages of other workers, 2022
| Type | Amount | |
|---|---|---|
| Nonsupervisory farmworkers | $16.62 | |
| Workers with less than HS | $16.52 | |
| Workers with HS diploma only | $21.94 | |
| Nonsupervisory nonfarm | $27.56 | |
| All workers | $32.00 | |
Notes: All values are for 2022 and in 2022 dollars. HS = high school. Nonsupervisory nonfarm workers’ wage represents the average hourly earnings of production and nonsupervisory employees, total for the private sector, not seasonally adjusted. Nonsupervisory farmworkers’ wage is the gross average hourly wage of field and livestock workers. Data for all workers, and for workers with a high school diploma and less than high school, can be found at the Economic Policy Institute State of Working America Data Library.
Source: Author’s analysis of USDA Farm Labor Survey data and nonfarm wage data from the BLS Current Employment Statistics survey; EPI analysis of CPI-ORG microdata.
In 2022, the average wage of all nonsupervisory farmworkers (i.e. combined field and livestock workers, to use USDA’s terminology and category) was $16.62 per hour, according to USDA, which was a 7% increase in nominal terms from what farmworkers earned per hour in 2021, which was $15.56 per hour. However, after adjusting for inflation, the real value of the 2021 average hourly wage of farmworkers was $16.67 per hour—meaning that the real value of the average farmworker wage declined by 5 cents from 2021 to 2022, i.e. from $16.67 in 2021 to $16.62 in 2022.68
The 2022 average farmworker wage of $16.62 per hour is also just half (52%) of the average hourly wage for all workers in 2022, which stands at $32.00 per hour. The average hourly wage for production and nonsupervisory nonfarm workers—the most appropriate cohort of nonagricultural workers to compare with farmworkers—was $27.56.
In other words, farmworkers earned just under 60% of what production and nonsupervisory workers outside of agriculture earned. USDA has referred to this wage gap between farmworker and nonfarm worker wages as “slowly shrinking, but still substantial.”69 In 2022, the farmworker wage gap remained substantial and virtually unchanged from the previous two years.70
Farmworkers have very low levels of educational attainment. According to the NAWS, 26% completed the 10th, 11th, or 12th grade, and 14% completed some education beyond high school.71 Farmworkers earn the same or less than the two groups of workers with the lowest levels of education in the United States: Nonsupervisory farmworkers at $16.62 per hour earned 10 cents an hour more than the average wage earned by workers without a high school diploma ($16.53), nearly an identical wage, and farmworkers earned $5.32 less per hour than the average wage earned by workers with only a high school diploma ($21.94).
When it comes to the AEWR, the required AEWR wage varies by state. In 2022, it ranged from $11.99 per hour to $17.51. That means that for many H-2A workers, the wage they earned was even lower than the national average wage for all nonsupervisory farmworkers in 2022—meaning the gap between what many H-2A farmworkers and nonagricultural workers earn is even wider.
The AEWR was higher than the national average farmworker wage of $16.62 in three states—California, Washington, and Oregon. But in the other 46 states for which DOL published an AEWR, it was lower than the national average. In Florida and Georgia—the top two states for H-2A employment, and where more than a quarter of all H-2A jobs were located in 2022, workers were paid much less than the national average wage. The AEWR in Florida was $12.41 per hour, $4.21 less than the national average farmworker wage. And Georgia had the lowest overall state AEWR, at $11.99 per hour, which was $4.63 less than the national average wage.
To reiterate, a quarter of all H-2A farmworkers in 2022 were paid over $4 less per hour than the national average wage for farmworkers, with those in Georgia being paid the lowest permissible wage under the AEWR. And H-2A farmworkers in most other states were also paid less than the national average wage for farmworkers. These were not exorbitant salaries that can be cut without harming farmworkers and their livelihoods, contrary to what agribusiness wants the public and lawmakers to believe.
Farmworker wages are so low, in fact, that even a nominal increase in the price that consumers pay for fruits and vegetables—$25 per family per year—would raise farmworker wages by 40% and lift many out of poverty, as Philip Martin and I showed.72
The real, inflation-adjusted value of the Adverse Effect Wage Rate has changed little over the past decade
As noted in the introduction to this section, the value and the rate of increase of the AEWR has become a hot-button issue and many claims about its impact are being made by representatives of industry. For example, the American Farm Bureau has called the new AEWR “a blow to growers” and AmericanHort says they are “steep.”73 This brief section examines the value of the AEWR over the past decade. My testimony in this section does not suggest that I know the what the appropriate AEWR for each state should be, or suggest that changes in the AEWR have no impact on farmers, or make any other bold claims about the AEWR. This section is simply an evidence-based look at the value of the AEWR over time, as a response to claims that the AEWR has risen sharply and quickly.
Many of the claims about year-to-year AEWR increases often do not adjust for inflation, which overstates the actual increase in terms of its dollar value. This is a basic mistake that misleads. Take for example, comments from Craig Regelbrugge from AmericanHort, who noted that “growers in Delaware, Maryland, New Jersey, and Pennsylvania will take the biggest hit, with a 9.6% increase” in the AEWR from 2021 to 2022, with California’s increasing “more than 8%.”74 Regelbrugge calculates these increases in nominal terms—but what do the increases look like after one adjusts for inflation?
While the percentage increase from 2021 to 2022 was in fact the largest in the states of Delaware, Maryland, New Jersey, and Pennsylvania, after adjusting for inflation, the increase was just 2.3% in those states. A year-over-year real hourly average wage increase of 2.3% is not even large enough to be consistent with the wage gains that could be reasonably expected for an occupation where employers have argued that severe labor shortage exist. If there are in fact labor shortages, it is reasonable to expect wages to rise; that’s simply Economics 101. A raise of 2.3% is hardly one that is unreasonable given the circumstances, especially considering how low H-2A wages are relative to other occupations. And in California, what did the “more than 8%” AEWR increase that Regelbrugge cites for California amount to after adjusting for inflation? H-2A farmworkers in California only saw a real increase of less than one percent (0.9%) in 2022.75
Now let’s turn to the AEWRs in all states over the past decade. Table 2 (which is admittedly large and difficult to see, but will be posted shortly on EPI.org), shows the Adverse Effect Wage Rates for H-2A farmworkers in all reported states between 2013 and 2022, in values that have been adjusted to constant 2022 dollars, and shows the calculated total real change in terms of dollar value, as well as the real total percentage change, and the annualized real percentage per year, from 2013 to 2022. The AEWRs listed are ranked by number of H-2A workers, using approved petitions from USCIS as a proxy for the number of workers.
Let’s examine the top five states for H-2A employment, which together account for more than half of all H-2A employment nationwide (52%). The table shows that in Florida, the biggest state for H-2A farmworkers—where 15% of H-2A farmworkers are employed—the value of the AEWR decreased by 17 cents between 2013 and 2022 (in constant 2022 dollars); that’s a total decrease in value of 1.3% over the decade. In Georgia, the second-biggest state for H-2A employment—where 11% of H-2A farmworkers are employed, the value of the AEWR decreased by 35 cents over the decade, a total decrease of 2.8%, averaging a decrease of 0.3% per year.
The largest increase in the value of the AEWR (in constant 2022 dollars) was in California, which accounts for nearly 10% of H-2A employment. In California, the total real value of the AEWR increased by $3.96 over the decade; a total percentage increase of 29.2%, which amounts to annualized percentage increase of 2.6% per year. Again, hardly an unreasonable average yearly increase for an occupation where employers claim there are severe labor shortages.
The AEWR increases over the decade in the next two biggest states for H-2A employment—Washington and North Carolina, respectively—were about half the value of the increase in California. The value of the AEWR in Washington increased by $2.27 over the decade, a total increase of 15%, growing annually at an average of 1.4% per year. The value of the AEWR in North Carolina increased by $1.95 over the decade, a total increase of 15.9%, growing annually at an average of 1.5% per year.
For the increases that occurred in the Pacific states, it is likely that those larger increases were driven by increases in the states’ minimum wage laws, which then fed into the FLS. The minimum wage in California and Washington is more than double the minimum wage of $7.25 in Georgia and more than $4 more than the state minimum wage in Florida.
In total, as the table shows, there were 20 states where the annual average real increase in the AEWR was less than 1%, with four of those states seeing a decline in the value of the AEWR. There were 25 states where the annual average increase in the AEWR was between 1% and 2%, and the AEWR only grew by more than 2% per year in three states (Colorado and Nevada at 2.1% in addition to California). The average yearly percentage increase for each state over the decade was just over 1%, at 1.05%, and if weighted by the number of H-2A workers in the state, just under 1%, at 0.91%
Adverse Effect Wage Rates for H-2A farmworkers, total change and percentage change from 2013 to 2022, adjusted to constant 2022 dollars, and ranked by number of workers
| State | Number of workers | Share of total H-2A workers | 2013 | 2014 | 2015 | 2016 | 2017 | 2018 | 2019 | 2020 | 2021 | 2022 | Total real change | Real % change total | Real % change annualized |
|---|---|---|---|---|---|---|---|---|---|---|---|---|---|---|---|
| Florida | 50,644 | 15.0% | 12.58 | 12.73 | 12.62 | 13.09 | 13.32 | 13.20 | 12.91 | 13.27 | 13.06 | 12.41 | -0.17 | -1.3% | -0.1% |
| Georgia | 37,720 | 11.1% | 12.34 | 12.41 | 12.39 | 12.95 | 12.72 | 12.80 | 12.78 | 13.27 | 12.77 | 11.99 | -0.35 | -2.8% | -0.3% |
| California | 33,575 | 9.9% | 13.55 | 13.66 | 14.04 | 14.54 | 15.05 | 15.41 | 15.98 | 16.74 | 17.35 | 17.51 | 3.96 | 29.2% | 2.6% |
| Washington | 29,783 | 8.8% | 15.14 | 14.73 | 15.39 | 15.52 | 16.02 | 16.51 | 17.26 | 17.94 | 17.66 | 17.41 | 2.27 | 15.0% | 1.4% |
| North Carolina | 25,191 | 7.4% | 12.21 | 12.25 | 12.79 | 13.11 | 13.50 | 13.40 | 14.07 | 14.36 | 14.21 | 14.16 | 1.95 | 15.9% | 1.5% |
| Louisiana | 12,841 | 3.8% | 11.99 | 12.25 | 12.61 | 13.07 | 12.43 | 12.54 | 13.01 | 13.41 | 12.84 | 12.45 | 0.46 | 3.9% | 0.4% |
| Michigan | 12,382 | 3.7% | 14.26 | 14.26 | 14.32 | 14.70 | 15.27 | 15.27 | 15.55 | 16.32 | 15.91 | 15.37 | 1.11 | 7.8% | 0.8% |
| Arizona | 12,141 | 3.6% | 12.28 | 12.37 | 13.06 | 13.70 | 13.11 | 12.23 | 13.78 | 14.63 | 14.78 | 14.79 | 2.51 | 20.5% | 1.9% |
| New York | 9,368 | 2.8% | 13.77 | 13.92 | 13.95 | 14.36 | 14.83 | 15.00 | 15.21 | 16.19 | 16.20 | 15.66 | 1.89 | 13.8% | 1.3% |
| Texas | 8,802 | 2.6% | 12.84 | 13.48 | 12.82 | 13.64 | 13.88 | 13.88 | 14.04 | 14.36 | 14.08 | 13.88 | 1.04 | 8.1% | 0.8% |
| Kentucky | 7,417 | 2.2% | 12.36 | 12.53 | 12.74 | 13.27 | 13.08 | 13.08 | 13.35 | 14.05 | 14.01 | 13.89 | 1.53 | 12.3% | 1.2% |
| South Carolina | 7,292 | 2.2% | 12.34 | 12.41 | 12.39 | 12.95 | 12.72 | 12.80 | 12.78 | 13.27 | 12.77 | 11.99 | -0.35 | -2.8% | -0.3% |
| Mississippi | 6,932 | 2.0% | 11.99 | 12.25 | 12.61 | 13.07 | 12.43 | 12.54 | 13.01 | 13.41 | 12.84 | 12.45 | 0.46 | 3.9% | 0.4% |
| Idaho | 5,696 | 1.7% | 12.60 | 13.27 | 13.80 | 14.37 | 13.96 | 13.60 | 15.48 | 15.43 | 15.73 | 14.68 | 2.08 | 16.5% | 1.5% |
| Tennessee | 5,602 | 1.7% | 12.36 | 12.53 | 12.74 | 13.27 | 13.08 | 13.08 | 13.35 | 14.05 | 14.01 | 13.89 | 1.53 | 12.3% | 1.2% |
| Virginia | 5,577 | 1.6% | 12.21 | 12.25 | 12.79 | 13.11 | 13.50 | 13.40 | 14.07 | 14.36 | 14.21 | 14.16 | 1.95 | 15.9% | 1.5% |
| Arkansas | 5,364 | 1.6% | 11.99 | 12.25 | 12.61 | 13.07 | 12.43 | 12.54 | 13.01 | 13.41 | 12.84 | 12.45 | 0.46 | 3.9% | 0.4% |
| Iowa | 4,553 | 1.3% | 14.40 | 15.17 | 15.63 | 14.88 | 15.71 | 15.69 | 15.32 | 16.52 | 16.61 | 16.19 | 1.79 | 12.5% | 1.2% |
| Indiana | 4,249 | 1.3% | 14.81 | 14.43 | 14.38 | 14.76 | 15.58 | 15.12 | 15.23 | 16.45 | 16.55 | 15.89 | 1.08 | 7.3% | 0.7% |
| Ohio | 3,767 | 1.1% | 14.81 | 14.43 | 14.38 | 14.76 | 15.58 | 15.12 | 15.23 | 16.45 | 16.55 | 15.89 | 1.08 | 7.3% | 0.7% |
| Oregon | 3,679 | 1.1% | 15.14 | 14.73 | 15.39 | 15.52 | 16.02 | 16.51 | 17.26 | 17.94 | 17.66 | 17.41 | 2.27 | 15.0% | 1.4% |
| Colorado | 3,528 | 1.0% | 12.72 | 13.51 | 14.09 | 13.78 | 13.17 | 12.50 | 15.08 | 16.16 | 16.02 | 15.58 | 2.86 | 22.5% | 2.1% |
| Illinois | 3,418 | 1.0% | 14.81 | 14.43 | 14.38 | 14.76 | 15.58 | 15.12 | 15.23 | 16.45 | 16.55 | 15.89 | 1.08 | 7.3% | 0.7% |
| Minnesota | 3,226 | 1.0% | 14.26 | 14.26 | 14.32 | 14.70 | 15.27 | 15.27 | 15.55 | 16.32 | 15.91 | 15.37 | 1.11 | 7.8% | 0.8% |
| Nevada | 3,013 | 0.9% | 12.72 | 13.51 | 14.09 | 13.78 | 13.17 | 12.50 | 15.08 | 16.16 | 16.02 | 15.58 | 2.86 | 22.5% | 2.1% |
| Nebraska | 2,778 | 0.8% | 15.56 | 16.64 | 16.84 | 16.88 | 16.52 | 15.95 | 16.51 | 16.99 | 17.18 | 16.47 | 0.91 | 5.9% | 0.6% |
| North Dakota | 2,605 | 0.8% | 15.56 | 16.64 | 16.84 | 16.88 | 16.52 | 15.95 | 16.51 | 16.99 | 17.18 | 16.47 | 0.91 | 5.9% | 0.6% |
| Pennsylvania | 2,560 | 0.8% | 13.71 | 13.73 | 13.99 | 14.26 | 14.60 | 14.09 | 15.10 | 15.12 | 15.19 | 15.54 | 1.83 | 13.3% | 1.3% |
| New Jersey | 2,512 | 0.7% | 13.71 | 13.73 | 13.99 | 14.26 | 14.60 | 14.09 | 15.10 | 15.12 | 15.19 | 15.54 | 1.83 | 13.3% | 1.3% |
| South Dakota | 2,145 | 0.6% | 15.56 | 16.64 | 16.84 | 16.88 | 16.52 | 15.95 | 16.51 | 16.99 | 17.18 | 16.47 | 0.91 | 5.9% | 0.6% |
| Wisconsin | 2,132 | 0.6% | 14.26 | 14.26 | 14.32 | 14.70 | 15.27 | 15.27 | 15.55 | 16.32 | 15.91 | 15.37 | 1.11 | 7.8% | 0.8% |
| Alabama | 1,940 | 0.6% | 12.34 | 12.41 | 12.39 | 12.95 | 12.72 | 12.80 | 12.78 | 13.27 | 12.77 | 11.99 | -0.35 | -2.8% | -0.3% |
| Missouri | 1,900 | 0.6% | 14.40 | 15.17 | 15.63 | 14.88 | 15.71 | 15.69 | 15.32 | 16.52 | 16.61 | 16.19 | 1.79 | 12.5% | 1.2% |
| Kansas | 1,786 | 0.5% | 15.56 | 16.64 | 16.84 | 16.88 | 16.52 | 15.95 | 16.51 | 16.99 | 17.18 | 16.47 | 0.91 | 5.9% | 0.6% |
| New Mexico | 1,634 | 0.5% | 12.28 | 12.37 | 13.06 | 13.70 | 13.11 | 12.23 | 13.78 | 14.63 | 14.78 | 14.79 | 2.51 | 20.5% | 1.9% |
| Utah | 1,614 | 0.5% | 12.72 | 13.51 | 14.09 | 13.78 | 13.17 | 12.50 | 15.08 | 16.16 | 16.02 | 15.58 | 2.86 | 22.5% | 2.1% |
| Connecticut | 1,287 | 0.4% | 13.77 | 13.92 | 13.95 | 14.36 | 14.83 | 15.00 | 15.21 | 16.19 | 16.20 | 15.66 | 1.89 | 13.8% | 1.3% |
| Oklahoma | 1,276 | 0.4% | 12.84 | 13.48 | 12.82 | 13.64 | 13.88 | 13.88 | 14.04 | 14.36 | 14.08 | 13.88 | 1.04 | 8.1% | 0.8% |
| Maryland | 1,262 | 0.4% | 13.71 | 13.73 | 13.99 | 14.26 | 14.60 | 14.09 | 15.10 | 15.12 | 15.19 | 15.54 | 1.83 | 13.3% | 1.3% |
| Montana | 1,244 | 0.4% | 12.60 | 13.27 | 13.80 | 14.37 | 13.96 | 13.60 | 15.48 | 15.43 | 15.73 | 14.68 | 2.08 | 16.5% | 1.5% |
| Maine | 1,152 | 0.3% | 13.77 | 13.92 | 13.95 | 14.36 | 14.83 | 15.00 | 15.21 | 16.19 | 16.20 | 15.66 | 1.89 | 13.8% | 1.3% |
| Delaware | 721 | 0.2% | 13.71 | 13.73 | 13.99 | 14.26 | 14.60 | 14.09 | 15.10 | 15.12 | 15.19 | 15.54 | 1.83 | 13.3% | 1.3% |
| Wyoming | 562 | 0.2% | 12.60 | 13.27 | 13.80 | 14.37 | 13.96 | 13.60 | 15.48 | 15.43 | 15.73 | 14.68 | 2.08 | 16.5% | 1.5% |
| Massachusetts | 497 | 0.1% | 13.77 | 13.92 | 13.95 | 14.36 | 14.83 | 15.00 | 15.21 | 16.19 | 16.20 | 15.66 | 1.89 | 13.8% | 1.3% |
| Vermont | 496 | 0.1% | 13.77 | 13.92 | 13.95 | 14.36 | 14.83 | 15.00 | 15.21 | 16.19 | 16.20 | 15.66 | 1.89 | 13.8% | 1.3% |
| New Hampshire | 268 | 0.1% | 13.77 | 13.92 | 13.95 | 14.36 | 14.83 | 15.00 | 15.21 | 16.19 | 16.20 | 15.66 | 1.89 | 13.8% | 1.3% |
| West Virginia | 268 | 0.1% | 12.36 | 12.53 | 12.74 | 13.27 | 13.08 | 13.08 | 13.35 | 14.05 | 14.01 | 13.89 | 1.53 | 12.3% | 1.2% |
| Hawaii | 212 | 0.1% | 16.05 | 16.02 | 16.08 | 15.46 | 15.74 | 16.80 | 16.91 | 16.88 | 16.82 | 16.54 | 0.49 | 3.1% | 0.3% |
| Rhode Island | 4 | 0.0% | 13.77 | 13.92 | 13.95 | 14.36 | 14.83 | 15.00 | 15.21 | 16.19 | 16.20 | 15.66 | 1.89 | 13.8% | 1.3% |
| Average | 1.51 | 11.23% | 1.05% | ||||||||||||
| Weighted average | 1.33 | 9.85% | 0.91% |
Notes: All values have been adjusted to constant 2022 dollars using the Consumer Price Index (CPI-U).
Source: Author’s analysis of Adverse Effect Wage Rates for various years from the Employment and Training Administration, U.S. Department of Labor. Number of workers is derived from the number of approved petitions for United States Citizenship and Immigration Services, U.S. Department of Homeland Security, H-2A Employer Data Hub, fiscal year 2021 data file.
USDA data shows labor costs as a share of farm income have not risen over the past two decades
In addition to the discussion above about the real value of the AEWR, it is important to add some additional context about the AEWR and the broader agricultural industry.
In the preamble to the proposed version of the current AEWR rule,76 DOL cited a key data point from the USDA’s Economic Research Service (ERS) that contextualizes farmworkers wages within the broader trends in the agricultural industry:
The ERS data also indicates that labor costs as a share of total gross farm income has not risen significantly over the past two decades, with the ERS concluding that “[a]lthough farm wages are rising in nominal and real terms, the impact of these rising costs on farmers” incomes has been offset by rising productivity and/or output prices,” and adding that “labor costs as a share of gross cash income do not show an upward trend for the industry as a whole over the past 20 years.”77 [emphasis added]
As the ERS data DOL has cited show, farms have become more productive and increased income at the same time that labor costs have risen, and thus labor costs for farmers have not risen as a share of farm income for the past 20 years. Data on farmworker wages and the share of labor costs disprove that the claim which is often made and repeated by farm employers and agribusiness lobbyists and representatives—i.e., that wages are rising too quickly for farmworkers and that the AEWR for H-2A workers is too high and rising too quickly, and thus not consistent with labor market trends. In fact, such claims are not credible and not based on any data or evidence, as the previous section also explained.
Farmers also simultaneously claim that a labor shortage exists and that it is difficult to find agricultural workers, while expecting wages to remain the same and not rise in response to said shortage. As DOL rightly points out in the proposed rule, it is a rule of economics that wages rise in response to a labor shortage, and wages should “increase by an amount sufficient to attract more workers until supply and demand [are] met in equilibrium.”78 It is irrational to claim that there is a labor shortage in the farm labor market, but not expect wages to rise—and therefore unreasonable to ask DOL to use the AEWR to protect farmers from the natural operation of the free market. The AEWR is not a magical instrument created out of thin air; it is simply a tool that reflects ongoing farm labor market trends in the United States and requires that H-2A wages mirror those trends. (Although it can be argued that AEWR wages are always lagging one year behind the current wage rates in the farm labor market, because USDA’s surveyed wage rates in a given year are used to set the AEWR for the following year, without any estimated adjustment for future inflation.) The AEWR is a rational tool based on the available evidence in the real world that is in place because DOL has a statutory mandate to prevent adverse effects to U.S. workers in its administration of the H-2A program.79
Congress should reject misleading comparisons about the AEWR and not craft policies based on them
Next, it is important to address how some employer groups are making unreasonable comparisons to support their argument that the AEWR wage is too high and rising too quickly. For example, the National Council of Agricultural Employers (NCAE), in their comment on the proposed rule for the AEWR, noted that H-2A wages are similar to the starting salaries for teachers in Nebraska who hold a college degree:
A starting teacher in rural Hemingford, Nebraska, with a BS in education can expect an annual salary of $39,919. An H-2A worker or a domestic worker in corresponding employment with a 6th grade education working at the farm adjacent to the school, would receive an hourly AEWR rate of $16.47 or $34,258 on an annualized basis. The AEWR is making the case that maybe a high school or college education is not all that valuable, after all.80
The NCAE’s comparison is inappropriate on multiple fronts. First, it takes the Nebraska hourly AEWR wage rate at the time and annualizes it for a farmworker working 8 hours per day and 40 hours per week for an entire year (52 weeks) at the AEWR for Nebraska, $16.47 per hour—and suggests that if H-2A workers are paid so handsomely at that hourly rate, it diminishes the value of a college degree. It would take an H-2A farmworker working an entire year at the AEWR hourly wage to earn the cited wage of $34,258. But teachers work for 180 days, far fewer than someone who works five or six days a week for 52 weeks (260 or 312 days, respectively), and would thus earn their salary of nearly $40,000 with many fewer workdays than farmworkers.
Presumably, NCAE member must also be aware that most farmworkers do not work 40 hours per week for an entire 52 weeks. We know this is true because, for example, there is a discrepancy between data in the USDA’s Census of Agriculture, which shows there are 2.4 million hired agricultural workers on farms, and the Quarterly Census of Employment and Wages (QCEW), which shows there are 1.5 million year-round full-time-equivalent (FTE) jobs in agriculture (as discussed earlier). Other research also shows that in California, the ratio of farmworkers to FTE jobs is two-to-one.81 Research I coauthored explains the large gap between FTE earnings and the actual earnings of farmworkers in more detail, showing that in 2015, workers in California who received their primary earnings from agricultural employers earned an average of $17,500 in total—less than 60 percent of the average annual wage of a full-time equivalent (FTE) worker—and explains how employers and news reports often repeat this false narrative of farmworkers who earn well over $30,000 per year, by annualizing the reported hourly average wage rates.82 When thinking about and analyzing the wages of farmworkers, it’s of the utmost importance to consider what they’re actually paid—not what they would earn if they worked full-time and year-round, since very few of them do.
In addition, the vast majority of H-2A workers, like U.S. farmworkers, also do not work 40 hours per week for 52 weeks. In fact, DOL disclosure data show that the average duration of H-2A job certifications is 6 months.83 That means that the average H-2A farmworker in Nebraska is only likely to earn $17,129 during their time in the United States.
Finally, the teacher example is misleading because it purports to use teaching jobs as an example of a good-paying jobs that offers a decent middle-class life. Unfortunately, there is reliable evidence showing that teachers in the United States are woefully underpaid, and numerous examples in news reports of teachers who, for example, work three jobs and donate plasma to make ends meet.84 The underpayment of teachers around the country has led to many walkouts and strikes by teachers demanding better pay and working conditions in recent years. EPI data show that in Nebraska, teachers there see a weekly pay penalty of 17.7%.85
Thus, using a profession like teaching where workers have been undervalued and underpaid for years, and comparing them to farmworker wages to argue farmworkers are overpaid, is dishonest, at best. What the NCAE’s example does instead is support the arguments of those advocating for better pay for teachers: If anything, their pay has eroded so far that it is now being compared to the pay of farmworkers, who earn some of the lowest wages in the entire U.S. workforce according to just about any metric.
Congress should reject the proposal to use the Congressional Review Act to repeal the latest Adverse Effect Wage Rule
In late February of 2023, DOL issued a final rule updating the AEWR, which took effect on March 30, 2023.86 The following month, resolutions of disapproval of the AEWR rule were introduced in the House and Senate,87 pursuant to the Congressional Review Act, or CRA. (The CRA provides a legislative tool that Congress can use to reverse a recent rule issued by a federal agency. If both houses of Congress pass a resolution of disapproval and the president signs it, or Congress overrides a presidential veto, then the rule in question will be rescinded or not go into effect.)88
The updated 2023 AEWR made only a slight change to the previously existing AEWR methodology and is arguably a slight improvement that will benefit a small number of farmworkers. The methodology change requires that a different data source—DOL’s Occupational and Employment Wage Statistics (OEWS) survey—be utilized for some H-2A jobs that do not fall under the occupations surveyed by the USDA’s Farm Labor Survey (FLS). Such jobs include farmworkers who are supervisors, and those working on construction, logging, and truck driving.89
The number of workers in occupations such as these who are now eligible for the wage set by the OEWS is very small relative to the size of the entire H-2A program. In the preamble to the final rule, DOL says that “Based on the Department’s program estimates, 98 percent of H-2A job opportunities are classified within [the] six SOC titles and codes” which are covered by the FLS.90 In other words, for 98% of H-2A workers, the AEWR methodology remains exactly the same as it was under the previous AEWR rule. And as a result, only 2% of H-2A farmworkers will fall under the new wage rates set by the OEWS; 2% of the roughly 300,000 workers in 2022 would amount to 6,000 H-2A workers.
In the preamble to the AEWR final rule, DOL also estimates the value of the additional wages that will go to farmworkers under the updated methodology.
The analysis in the preamble to the 2023 AEWR rule estimates that there will be a transfer of $38 million from employers to workers, per year, as the ten-year average—meaning that $38 million is the amount that H-2A farmworkers would be set to lose on average per year if the final rule is rescinded (see the table at Exhibit 8 in the final rule). To be clear, the Members of Congress who vote in favor of repealing the 2023 AEWR final rule will be voting to give migrant H-2A farmworkers a pay cut of $38 million per year.
How much is $38 million in the context of the profits earned by farmers? In 2023, net farm income is forecast to be $136.9 billion.91 The $38 million pay cut the CRA would lead to would constitute 0.03% of total net farm income. Labor expenses for farms in 2023 are forecasted to cost farmers $42.1 billion.92 Thus, the CRA’s $38 million pay cut would represent 0.09% of total farm labor expenses forecasted for 2023—less than one-tenth of one percent.93
In sum, DOL’s 2023 AEWR final rule is a slight change from the previous methodology, applying to a minuscule share of H-2A workers, and representing less than one-tenth of one percent of all money spent on labor by farm employers. Senators and members of the House of Representatives should consider these factors before voting to give farmworkers—already some of the lowest-paid workers in the entire U.S. labor force—another pay cut that will only benefit farmers—the same farmers who last year received $15.6 billion in aid from Congress in the form of direct government payments.94 I therefore urge all Senators and members of the House of Representatives to vote no on the CRA resolutions to rescind the AEWR if they come up for a vote.
Recommendations to protect immigrant workers in the food supply chain and stabilize the workforce for employers
Based on the research and testimony presented herein, I offer the following recommendations for actions that both Congress and the Biden administration should take if they wish to protect immigrant workers and help provide a more stable workforce for U.S. employers across the food supply chain:
- Congress should invest much more in labor standards enforcement, so that labor, wage and hour, and workplace health and safety laws can be adequately enforced.
- Congress should regularize the immigration status of immigrant workers, allowing them to have basic workplace rights and to integrate fully in economic and political life.
- Congress should pass the DREAM and PROMISE Act to provide permanent residence to eligible TPS grantees and DACA recipients.
- Congress should expand green card pathways and reform temporary work visa programs, so they provide a quick and direct path to permanent residence and citizenship, such as proposed in the Seasonal Worker Solidarity Act.
- Congress should pass legislation that regulates foreign labor recruiters, to ensure transparency in the recruitment process for migrant workers and require that employers be held accountable for the actions of recruiters abroad.
- Congress and the administration should expand permanent humanitarian pathways to respond to the urgent humanitarian need in the Western Hemisphere and across the globe, and explore ways to expand the definition of asylum to include additional categories, including those fleeing the impacts of climate change.
- Congress should invest in asylum processing to allow all persons fleeing persecution to have a fair hearing and to benefit from any protections they qualify for.
- Congress should pass the POWER Act to protect worker witnesses and victims from the threat of employer retaliation that can lead to deportation.
- Congress should pass the PRO Act so that all workers, including immigrant workers, can freely exercise their freedom of association.
- Congress should create an independent commission on employment-based migration to advise Congress on how to make the system more flexible and data-driven and depoliticize the adjustment of numerical limits.
- The Biden administration should expand their use of Temporary Protected Status, designating and re-designating countries where appropriate to respond to the current urgent needs.
- The Biden administration should halt its efforts to channel and misdirect asylum-seekers into indentured worker programs like the H-2A and H-2B visa programs.
U.S. temporary work visa programs
As noted above, a growing share of migrant workers in the food supply chain are employed through temporary work visas programs. Because of the role that temporary work visa programs now play in the food supply chain, the following sections will now shift to providing background on those programs, their flaws, and how to reform them to better protect migrant workers, and includes sections focused specifically on the H-2A and H-2B visa programs.
An introduction to U.S. temporary work visa programs
Nearly all immigrants, refugees, and asylum-seekers join the workforce after entering the United States, but a portion of our immigration system is intended to bring people here expressly for work. Within that complex employment-based system, the majority of migrants come through temporary, precarious pathways—known as temporary work visa programs—that provide employers with millions of on-demand workers who have limited rights, and whose needs and realities are not well understood, even by mainstream immigration advocates.
While temporary work visa programs represent a major component of the U.S. immigration system, less is known about them compared with other aspects of the system that garner more public attention. Nonetheless, work visa programs have played an outsized role in political and policy debates about how to reform the immigration system in the past, and likely will again.
Temporary work visa programs are an instrument ultimately used to deliver migrant workers to employers, but without having to afford them equal rights, dignity, or the opportunity to integrate and participate in political life. While such programs may serve as important pathways for migrants to come to the United States, the numerous programmatic flaws that undermine labor standards and leave migrant workers vulnerable to abuses—and even human trafficking—clearly demonstrate a need for dramatic improvements.
This is not news; migrant worker advocates, government auditors, and the media have identified these flaws across U.S. temporary work visa programs for decades. Most of the workers who participate in the programs will never have a chance to become lawful permanent residents or naturalized citizens, despite spending months, and in many cases, years, working in the United States. The COVID-19 pandemic and the national emergency that was declared on March 13, 2020,95 along with the inadequacy of the federal government’s response, have only exacerbated the challenges migrant workers face while employed through temporary work visa programs, many of which continue today.
Despite the popular narrative that former President Trump’s administration instituted a so-called immigration crackdown on all pathways into the United States, temporary work visa programs were a clear exception. Even before the pandemic began, important immigration pathways that can lead to permanent residence and citizenship had been slashed by the Trump administration—and humanitarian pathways for asylees and refugees in particular had already been reduced to historic lows. But, at the same time, data show that temporary work visa programs were 13% larger in 2019 than during the last year of the Obama administration. Even the Trump administration’s temporary work visa “ban” issued in June 2020 in retrospect looks to have been mostly symbolic—a political tactic to blame migrants for high unemployment and the economic collapse that resulted from the COVID-19 pandemic.
This point in history was a dangerous trajectory away from welcoming immigrants as persons who have equal rights and who can settle in the United States permanently and toward using the immigration system mostly to appease the desire employers have for more indentured and disposable migrant workers. Today, the Biden administration is still attempting to reconstitute much of the immigration system that was torn down by the Trump administration. Numerous reports have shown that staffing shortages and backlogs have led to the wasting—in other words the non-issuance of—green cards that should have been issued to people who have been waiting for years to become permanent immigrants to the United States. In recent months, it appears that some of the processing challenges have been resolved, but many still remain.
When it comes to U.S. labor migration pathways, they can and should be reformed to comport with universal human and labor rights standards. Many major improvements to temporary work visa programs can be accomplished by the executive branch through regulations, new guidance, and other executive actions, as my testimony will discuss. Nevertheless, the reality remains that some of the most transformative and lasting solutions will require congressional action, and those reforms will also be disused herein. An added benefit of these more durable solutions is that they will set a useful baseline of protections for temporary migrant workers, both in normal times and during emergencies like pandemics, and during both periods of high unemployment and tight labor markets.
Now is the moment for policymakers to take stock of the immigration system and implement needed reforms to employment-based migration pathways. And considering that a record number of temporary migrant workers are employed in the United States—more than 2 million, with many performing jobs that were at one point deemed “essential”—the need to protect these workers has never been more acute.
The basics: What are temporary work visa programs?
One of the main authorized or “legal” pathways for U.S. employers that wish to hire migrant workers or for migrants who want to work in the United States lawfully is via “nonimmigrant” visas that authorize temporary employment. In the United States, employers almost exclusively control and drive the process, by deciding to recruit and hire employees through temporary work visa programs. Workers who participate in those programs are known as temporary migrant workers, or “guestworkers”—defined as persons employed away from their home countries in temporary labor migration programs. The programs themselves are often referred to as circular or “guest” worker programs, or temporary work visa programs.96 Temporary and home can be defined in different ways, with “temporary” ranging from several months to several years, and “home” usually meaning the worker’s country of birth or citizenship.97 All temporary work visa programs require migrant workers to return to their home countries when their visa expires; workers can remain legally in the United States only if they obtain another temporary visa or lawful permanent resident status.
The most common argument for using temporary work visa programs to facilitate migration is that they help employers fill vacant jobs, especially when employers assert there is a shortage of U.S. workers; in other words, to fill labor shortages. Other major rationales include (1) to facilitate youth exchange programs and admit foreign students (in both cases, the migrants are usually permitted to work); (2) to allow intracorporate transfers (sometimes called intracompany transfers), meaning that employees of multinational companies move from a branch or office of a company to another branch or office of the same company in a different country; (3) to fulfill trade agreement provisions, such as those included in agreements like the North American Free Trade Agreement; (4) to facilitate foreign investment in countries of destination; (5) to manage migration that would otherwise be inevitable—for example, as the result of geopolitical changes; and (6) to allow for cross-border commuting.98
According to the Congressional Research Service, “there are 24 major nonimmigrant visa categories, which are commonly referred to by the letter and numeral that denote their subsection in the Immigration and Nationality Act (INA)”99; over the past few years, between 9 million and 11 million total nonimmigrant visas have been issued. While the vast majority of these were visitor visas that do not authorize employment, nevertheless hundreds of thousands of new nonimmigrant visas in an alphabet soup of temporary work visa programs have been issued to migrant workers or renewed; in addition, the United States has approved work permits for nonimmigrants in visa classifications that do not automatically authorize employment.
Some work visa programs have an annual numerical limitation. For example, the H-2B visa is capped at 66,000 per year; the H-1B visa is capped at 85,000 for the private sector—although it also allows an unlimited number not subject to the annual cap for certain employers.100 However, most work visa programs do not have an annual numerical limit. Each visa program has a different duration of stay associated with it, as well as individual rules about whether and how it can be renewed. For example, H-2A visas for temporary and seasonal agricultural occupations are valid for up to one year, depending on the duration of the job, but can sometimes be renewed, while H-1B visas for occupations that require a college degree may be valid for up to three years, renewable once for a total of six years, and L-1 visas for intracompany transferees may last up to five years for a position that requires specialized knowledge about the employer, or seven years if the worker is a manager or executive.
As discussed earlier, the Pew Research Center has estimated that approximately 5% of the total foreign-born population are temporarily residing in the United States with nonimmigrant visas.101 Although good data are lacking from the U.S. government on the exact number of nonimmigrant residents who are employed, and in which visa programs, I have estimated that more than 2 million temporary migrant workers were employed in 2019, accounting for 1.2% of the U.S. labor force (see discussion in the following section).102
The numbers in context: Temporary work visa programs grew under Trump, while permanent pathways shrunk
Despite the popular narrative that the former Trump administration instituted an “immigration crackdown” on all pathways into the United States, temporary work visa programs were a clear exception. Other, permanent immigration pathways that can lead to citizenship were slashed—even before the pandemic began—including the number of refugees admitted being reduced to a historic low and asylum being severely restricted103—but this has not been the case with temporary work visa programs.
The main factor impacting the issuance of both permanent and temporary visas since the COVID-19 pandemic has been the slowdown and shutdown of consular processing for visas around the world, along with staffing shortages at United States Citizenship and Immigration Services (USCIS), with the fallout still being felt today in mid-2023, despite significant improvements. In any case, the shift to more temporary work visas and fewer permanent immigrant visas during the Trump administration was a significant and dangerous trajectory away from welcoming immigrants who would be granted equal rights and the ability to settle in the United States permanently; it reflects an immigration system used mainly to appease the business community’s demands for more migrant workers who are indentured to them and disposable.104
Table 3 below shows an estimate of the number of temporary migrant workers employed in 2016 and in 2019, the year before the disruptions to the immigration system caused by the pandemic, based on an updated version of the methodology devised by Costa and Rosenbaum.105 It reveals that the number of temporary migrant workers employed during 2019 was nearly 2.1 million—over 237,000 more than during the last year of the Obama administration, or a 13% increase. In total these workers represented 1.2% of the U.S. labor market in 2019. Much of the increase was driven by growth in the visa programs for low-wage jobs—H-2A, H-2B, and J-1—but also by growth in a number of the visa programs for migrant workers who normally possess at least a college degree, including H-1B visas (for information technology jobs), the Optional Practical Training program for foreign graduates with F-1 visas, L-1 visas for intracompany transferees, and O-1 and O-2 visas for persons with extraordinary abilities.
Temporary work visa programs grew 13% under Trump: Estimated number of temporary migrant workers employed in the United States, 2016 and 2019
| Number of workers employed | ||
|---|---|---|
| Nonimmigrant visa classification | 2016 | 2019 |
| A-3 visa for attendants, servants, or personal employees of A-1 and A-2 visa holders | 2,162 | 1,687 |
| B-1 visa for temporary visitors for business | 3,000 | 3,000 |
| CW-1 visa for transitional workers on the Commonwealth of Northern Mariana Islands | 8,093 | 3,263 |
| F-1 visa for foreign students, Optional Practical Training program (OPT) and STEM OPT extensions | 199,031 | 223,308 |
| G-5 visa for attendants, servants, or personal employees of G-1 through G-4 visa holder | 1,309 | 945 |
| E-1 visa for treaty traders and their spouses and children | 8,085 | 6,668 |
| E-2 visa for treaty investors and their spouses and children | 66,738 | 66,738 |
| E-3 visa for Australian specialty occupation professionals | 15,628 | 16,858 |
| H-1B visa for specialty occupations | 528,993 | 583,420 |
| H-2A visa for seasonal agricultural occupations | 134,368 | 204,801 |
| H-2B visa for seasonal nonagricultural occupations | 149,491 | 160,410 |
| H-4 visa for spouses of certain H-1B workers | 54,936 | 74,749 |
| J-1 visa for Exchange Visitor Program participants/workers | 193,520 | 222,597 |
| J-2 visa for spouses of J-1 exchange visitors | 10,147 | 11,781 |
| L-1 visa for intracompany transferees | 316,224 | 337,164 |
| L-2 visa for spouses of intracompany transferees | 25,670 | 25,673 |
| O-1/O-2 visa for persons with extraordinary ability and their assistants | 38,706 | 47,725 |
| P-1 visa for internationally recognized athletes and members of entertainment groups | 24,262 | 25,601 |
| P-2 visa for artists or entertainers in a reciprocal exchange program | 97 | 107 |
| P-3 visa for artists or entertainers in a reciprocal exchange program | 8,426 | 9,848 |
| TN visa or status for Canadian and Mexican nationals in certain professional occupations under NAFTA | 50,000 | 50,000 |
| Total | 1,838,886 | 2,076,343 |
Notes: Methodology for calculating the number of workers derived from Daniel Costa and Jennifer Rosenbaum, Temporary Foreign Workers by the Numbers: New Estimates by Visa Classification, Economic Policy Institute, March 2017. All references to a particular year should be understood to mean the U.S. government’s fiscal year (Oct. 1–Sept. 30).
Sources
Bureau of Consular Affairs, “Nonimmigrant Visa Statistics,” U.S. Department of State; USCIS, “Form I-765 Application for Employment Authorization, All Receipts, Approvals, Denials Grouped by Eligibility Category and Filing Type, Fiscal Year 2019”; H-1B Authorized-to-Work Population Estimate, Office of Policy and Strategy, Research Division, June 2020; Daniel Costa and Jennifer Rosenbaum, Temporary Foreign Workers by the Numbers: New Estimates by Visa Classification, Economic Policy Institute, March 2017; Letter from Sen. Grassley to Attorney General Lynch and Secretaries Johnson, Kerry, and Perez, June 7, 2016; U.S. Government Accountability Office, Nonimmigrant Investors: Actions Needed to Improve E-2 Visa Adjudication and Fraud Coordination, GAO-19-577, July 2019; Educational Commission for Foreign Medical Graduates, “J-1 Physicians: Essential to U.S. Health Care” (infographic), Oct. 9, 2020.
Growth in temporary work visa programs is part of a long-term trend
While temporary work visa programs expanded during the Trump administration, the growth of the programs represented a continuing long-term trend dating back more than 30 years. Figure M shows the number of new visas issued in 36 nonimmigrant visa classifications that represent U.S. temporary work visa programs, or programs that allow spouses and children to accompany the principal temporary migrant worker, between 1987 and 2019.106 For comparison, the figure also shows the number of permanent immigrant visas issued in the employment-based (EB) green card preferences—i.e., green cards issued for the purpose of work, which allow migrants to adjust to become lawful permanent residents—over the same period. The dotted line in Figure A shows the point at which the last major immigration reform was passed in the United States, in November 1990, when the Immigration Act of 1990 (commonly referred to as IMMACT90) was enacted.
Employment-based permanent immigrant visas and temporary nonimmigrant work visas issued, including principal and derivative beneficiaries, 1987–2019
| Temporary work visas | Employment-based LPR | |
|---|---|---|
| 1987 | 245,645 | 57,519 |
| 1988 | 261,712 | 58,727 |
| 1989 | 296,598 | 57,741 |
| 1990 | 315,369 | 58,192 |
| 1991 | 328,985 | 59,525 |
| 1992 | 325,155 | 116,198 |
| 1993 | 340,060 | 147,012 |
| 1994 | 375,207 | 123,291 |
| 1995 | 414,434 | 85,336 |
| 1996 | 429,580 | 117,499 |
| 1997 | 492,600 | 90,607 |
| 1998 | 539,221 | 77,517 |
| 1999 | 624,899 | 56,678 |
| 2000 | 727,234 | 106,642 |
| 2001 | 815,944 | 178,702 |
| 2002 | 785,802 | 173,814 |
| 2003 | 809,657 | 81,727 |
| 2004 | 915,188 | 155,330 |
| 2005 | 862,659 | 246,877 |
| 2006 | 961,855 | 159,081 |
| 2007 | 1,103,767 | 162,176 |
| 2008 | 1,061,182 | 164,741 |
| 2009 | 883,654 | 140,903 |
| 2010 | 937,404 | 148,343 |
| 2011 | 960,223 | 139,339 |
| 2012 | 992,446 | 143,998 |
| 2013 | 1,072,981 | 161,110 |
| 2014 | 1,163,160 | 151,596 |
| 2015 | 1,235,196 | 144,047 |
| 2016 | 1,356,459 | 137,893 |
| 2017 | 1,414,241 | 137,855 |
| 2018 | 1,406,139 | 138,171 |
| 2019 | 1,491,209 | 139,458 |
Notes: The Immigration Act of 1990 was enacted on November 29, 1990. LPR stands for lawful permanent resident. Employment-based LPR refers to permanent immigrant visas in the employment-based preference categories, which confer permanent residence on the migrant beneficiary. For more background on employment-based permanent immigrant visas, see USCIS, “Permanent Workers,” Working in the United States, last reviewed/updated Jan. 9, 2020.
Data shown in the figure include employment-based immigrant visas, preference categories 1–5, and nonimmigrant visas in the A-3, CW-1, CW-2, E-1, E-2, E-2C, E-3, E-3D, E-3R, F-1/OPT, G-5, H-1, H-1A, H-1B, H-1B1, H-1C, H-2, H-2A, H-2B, H-4, J-1, J-2, L-1, L-2, O-1, O-2, O-3, P-1, P-2, P-3, P-4, Q-1, R-1, R-2, TN, and TD classifications.
Source
Author’s analysis of U.S. Department of State, Nonimmigrant Visa Statistics; Interagency Working Group on U.S. Government-Sponsored International Exchanges and Training; U.S. Department of State, J-1 Visa Website; Office of Immigration Statistics, Yearbook of Immigration Statistics, U.S. Department of Homeland Security (various years); Government Accountability Office, Commonwealth of the Northern Mariana Islands: DHS Implementation of Immigration Laws, Statement of David Gootnick, Director, International Affairs and Trade, GAO-19-376T (February 27, 2019); U.S. Immigration and Customs Enforcement, “International Student and Exchange Visitor Data,” Student and Exchange Visitor Program Data Library; USCIS, I-765 approval data, various years, USCIS Electronic Reading Room.
The major trends that have occurred since IMMACT90’s enactment were that issuances of EB green cards increased slowly until stabilizing around the new annual cap for EB green cards of 140,000 (created by IMMACT90), while the number of temporary work visas issued increased exponentially during the same period. In 2019, the number of EB green cards issued represented only 8.6% of all new work visas issued to migrant workers and their families (temporary plus EB green cards). These data show that the labor migration pathways available to migrant workers and their families in the U.S. immigration system are almost exclusively temporary.107
The difference under Trump was that the steady growth in temporary work visa programs occurred while the Trump administration simultaneously, and successfully, made unprecedented moves to slash virtually every permanent immigrant pathway available in the U.S. system. Despite the Biden administration’s stated commitments to restore the immigration system, budget and staffing shortfalls at USCIS led to many of the green cards available in permanent categories from not being issued,108 although issuances appear to be finally normalizing—except in the case of green cards for refugees. The Biden administration raised the refugee cap significantly to 125,000 for fiscal years 2022 and 2023 as compared to under the Trump administration, but statistics show that federal agencies did not come close to processing that many green cards for refugees in 2022 and will not come close again in 2023.109
Temporary migrant workers face unique challenges due to program frameworks
As discussed above, the U.S. labor migration system has shifted towards one that increasingly provides only temporary pathways to work. Yet, although migrants coming to the United States through temporary work visa programs are legally authorized to work, they are among the most exploited laborers in the U.S. workforce because employer control of their visa status leaves many powerless to defend and uphold their rights. Rather than being an issue of a few bad employers, the flaws in temporary work visa programs are systemic and structural. The list below summarizes some of the most problematic aspects of temporary work visa programs and how they impact workers.
Illegal recruitment fees and debt bondage are common
Temporary migrant workers can face abuse even before arriving in the United States: Many are required to pay exorbitant fees to labor recruiters to secure U.S. employment opportunities, even though such fees are usually illegal.110 Those fees leave them indebted to recruiters or third-party lenders, which can result in a form of debt bondage.111 (Even migrants recruited to work with employment-based green cards have ended up paying exorbitant fees, as seen in one case reported in ProPublica, in which a Korean worker paid $26,000 to a recruitment agency to work in a poultry processing plant.112) After arriving in the United States, temporary migrant workers may find out the jobs they were promised don’t exist.113 And in a number of cases, temporary migrant workers have become victims of human trafficking—with some being forced to work in the sex industry.114
Contrary to popular belief, it’s not just farmworkers and other temporary migrant workers in low-wage jobs suffering from the abuses that pervade temporary work visa programs: College-educated workers in computer occupations, as well as teachers and nurses, have been victimized and put in “financial bondage” by shady recruiters and staffing firms that steal wages, forbid workers from switching jobs or taking jobs the recruiters don’t financially benefit from, and file lawsuits against workers if they try to change jobs or quit.115
Temporary work visa programs permit employers to circumvent U.S. anti-discrimination laws and segregate the workforce
While U.S. anti-discrimination laws are intended to make workplaces fairer and more equal by prohibiting discrimination in hiring and employment on the basis of factors like race, color, sex, religion, and national origin at the point of hire—in practice they don’t apply to temporary migrant workers who are recruited abroad. Because workers are being selected by recruiters in countries of origin, outside of U.S. jurisdiction, employers have the ability to reclassify entire sectors of the U.S. workforce by race, gender, national origin, and age through temporary work visa programs.116
This occurs through recruiters and employers limiting access to jobs made available to workers based on employer preferences for national origin, gender, and age, allowing them to sort workers into occupations and visa programs based on racialized and gendered notions of work. Thanks to temporary work visa programs, an employer may select an entire workforce composed of a single nationality, gender, or age group—for example, selecting only young Mexican men for farm jobs with H-2A visas, or young Indian men to work as computer programmers with H-1B visas, or young women from Eastern Europe for work in restaurants and amusement parks with J-1 visas. The large shares of visas issued to specific countries of origin, and the limited demographic data available, provide evidence that this is occurring,117 and websites exist that allow employers to browse the profiles of workers on employment agency websites that advertise workers like commodities.118
Employers and recruiters can also weed out workers who might dare to speak out against unlawful employment practices, assert their legal rights, or organize for better working conditions by joining or forming a union. They can do this by refusing to hire workers whom they think will be likely to complain, and retaliating against workers who do speak up or complain—for instance, by firing them and effectively forcing them to leave the country, or by threatening to blacklist them from being hired for future job opportunities.
The visa status of temporary migrant workers is usually tied to their employer, thus chilling labor rights, preventing mobility, and enabling employer lawbreaking
The many temporary migrant workers who are in debt after paying recruitment fees are anxious to earn enough to pay back what they owe and hopefully make a profit, and are thus unlikely to speak up at work when things go wrong on the job. But even those who aren’t caught in the debt trap are often subject to exploitation once they are working in the United States. Like unauthorized immigrants, temporary migrant workers have good reason to fear retaliation and deportation if they speak up about wage theft, workplace abuses, or other working conditions like substandard health and safety procedures on the job—not because they don’t have a valid immigration status, but because their visas are almost always tied to one employer that owns and controls their visa status. That visa status is what determines the worker’s right to remain in the country; if they lose their job, they lose their visa and become deportable. This arrangement results in a form of indentured servitude.119 Further, as noted in the previous section, employers can punish temporary migrant workers for speaking out by not rehiring them the following year or by telling recruiters in countries of origin that they shouldn’t be hired for other job opportunities in the United States (effectively blacklisting them).120
The specter of retaliation makes it understandably difficult for temporary migrant workers to complain to their employers and to government agencies about unpaid wages and substandard working conditions. Private lawsuits against employers who break the law are also an unrealistic avenue for enforcing rights, for two reasons: First, most temporary migrant workers are not eligible for federally funded legal services under U.S. law, and second, those who have been fired are unlikely to have a valid immigration status permitting them to stay in the United States long enough to pursue their claims in court. Because of the conditions created by tying workers to a single employer through their visa status, temporary work visa programs have been dubbed by some as “close to slavery” or “the new American slavery,” and government auditors have noted that increased protections are needed for temporary migrant workers.121
While temporary migrant workers generally cannot easily change jobs or employers, the terms and conditions of some nonimmigrant visas for college-educated workers actually do permit them to change employers—in particular the J-1, F-1 Optional Practical Training (OPT) program, H-1B, and TN visas allow workers to change employers—although the rules vary even among these visas. In the J-1 visa, which is managed by the State Department, there are sponsor organizations that partner with the State Department to manage oversight and compliance. Those private organizations act as middlemen between the J-1 workers and U.S. employers, and ultimately must sign off on a job change for a J-1 worker, rendering it difficult in practice. In the F-1/OPT context, universities play a key role and ultimately approve employment for OPT workers but exercise little oversight, sometimes resulting in abuses.122
It is important to stress that temporary migrant workers in these four visa programs that allow for some portability have nevertheless been subjected to substandard workplace conditions, and been the victims of fraud and even trafficking, which suggests that the ability to change employers, on its own, is not a panacea for protecting temporary migrant workers. Allowing temporary migrant workers to change employers is something that some proponents of expanded temporary work visa programs—like researchers from the Center for Global Development and the Cato Institute123—have proposed in lieu of additional labor standards enforcement. But the legal ability to change jobs does not alone provide protection from exploitation; while this is a pervasive assumption in basic economics, it is a generally incorrect assumption that is finally being called into question.124 The ability to change employers should be a basic fundamental freedom for workers, not an excuse to abandon labor standards enforcement.
Temporary migrant workers are often legally underpaid
There is abundant evidence that the laws and regulations governing major temporary work visa programs—such as H-2B and H-1B—permit employers to pay their temporary migrant workers much less than the local average wage for the jobs they fill.125 For example, in the H-1B visa program—which has a prevailing wage rule that is intended to protect local wage standards—60% of all H-1B jobs certified by the U.S. Department of Labor (DOL) in 2019 were certified at a wage that was below the local average wage for the specific occupation.126 And despite the wage rules in H-1B, there is evidence that wage theft of H-1B workers may be occurring on a massive scale.127
However, most work visa programs have no minimum or prevailing wage rules at all—perhaps that’s why some employers have believed they could get away with vastly underpaying their temporary migrant workers, as one Silicon Valley technology company in Fremont, California, did by paying less than $2 an hour to skilled migrant workers from India on L-1 visas who were working up to 122 hours per week installing computers.128
While employers are still required by law to pay temporary migrant workers at least the state or federal minimum wage, that’s often far less than the true market rate, or the local average wage, for the occupation in which they are employed. The company employing the L-1 workers in Fremont who were paid less than $2 an hour was cited for violations by DOL because California law required that they be paid no less than $8 an hour (the state minimum wage at the time), plus time-and-a-half for overtime. But the average wage in Fremont for the job they were doing—installing computers—was $20 per hour at the time according to DOL data, and if they were also configuring the computers for the company’s network, the going rate for their work would have been $44 per hour.129 In the end, the company was required to pay back wages of $40,000 plus a fine of $3,500 “because of the willful nature of the violations”—a slap on the wrist considering the egregiousness of the wage theft, and hardly a disincentive against future violations.130
Considering how the wage rules or lack thereof in these programs operate, and the situation workers are left in, perhaps it is no surprise there is evidence that temporary migrant workers in low-wage jobs earn approximately the same wages, on average, that unauthorized immigrant workers do for similar jobs, despite the fact that unauthorized workers have virtually no rights in practice.131 In other words, these temporary migrant workers do not have any financial incentive to work legally through visa programs since there is no wage premium to be gained for it—and, in fact, authorized temporary migrant workers can end up worse off economically than unauthorized workers because of the debts they incur through fees paid to recruiters, and considering the fact that they may have no family or social networks to rely on. This could ultimately result in incentivizing workers to migrate without authorization, rather than using available legal channels.
In essence, these visa programs operate in practice to create a labor market monopsony for employers—awarding employers greater leverage over their workers132—and growing research has shown that even modest amounts of employer monopsony power are utterly corrosive to workers’ ability to bargain for better wages.133
Oversight is lacking, leaving temporary migrant workers unprotected
There is very little oversight of temporary work visa programs by DOL. In fact, most of the programs have no rules in place at all to protect temporary migrant workers after they arrive in the United States. Where such rules are in place—namely in the H-1B, H-2A, and H-2B programs—enforcement is inadequate to protect workers, and companies that are frequent and extreme violators of the rules are often allowed to continue hiring through visa programs with impunity.134 Part of the problem lies with DOL’s weak legal mandate, but is also due to the reality of DOL being woefully underfunded and understaffed. In fact, funding for DOL’s Wage and Hour Division (WHD) and Occupational Safety and Health Administration (OSHA) has remained flat over the past decade, while the number of workers they are responsible for protecting has increased sharply.135 And as discussed earlier, the federal government appropriated twelve times more to enforce immigration laws as it did to enforce labor standards.136
Most temporary migrant workers cannot transition to a permanent immigrant status; in the few programs that offer a pathway, it is controlled by employers
None of the U.S. temporary work visa programs provide for an automatic path to lawful permanent residence—i.e., obtaining a “green card”—which would also allow them to eventually qualify for naturalization (citizenship) after a few years, nor do they allow for a quick and direct path for temporary migrant workers to apply for green cards themselves. As a result, many temporary migrant workers return to the United States every year for decades in a nonimmigrant status, often for six to nearly 12 months at a time—rendering them permanently temporary in many respects—which also impacts their ability to integrate into the United States and prevents them from earning the higher wages associated with permanent residence and citizenship.137
Only two temporary work visa programs allow for a relatively straightforward application process for green cards, the H-1B and L-1 visas. But in those programs, it is the employer who decides whether the worker should get a green card; the employer also controls the green card application and process. This creates an imbalance of power between temporary migrant workers and their employers that allows employers to exert undue influence over the lives of their workers with visas, and disincentivizes workers from speaking up about workplace abuses, as speaking up could jeopardize their ability to remain in the United States.
Even when employers decide to apply for green cards for the temporary migrant workers who are eligible, workers can end up in what’s known as the green card “backlog,” waiting years and even decades for a green card to become available to them. The Congressional Research Service has estimated that approximately 1 million temporary migrant workers are in the green card backlog.138 During their time in the backlog, workers can experience an employment relationship that is ripe for exploitation, because workers are unable to switch easily between jobs or employers by virtue of their prolonged temporary status.
Many temporary migrant workers are separated from their families while employed in the United States
While many temporary work visa programs technically allow migrant workers to bring their spouses and children, in most cases U.S. visa rules do not authorize spouses to work—making it difficult, if not impossible, for spouses and children to accompany workers because of the high cost of living and low pay in work visa programs. Taking into consideration that so many temporary migrant workers return every year for decades, workers and their family members can end up facing prolonged separation and trauma—children may grow up hardly knowing, or ever seeing, one or both of their parents.
The H-2A and H-2B visa programs: Wage and hour enforcement statistics show that workers are vulnerable in the workplace
While the preceding sections discussed issues that cut across all U.S. temporary work visa programs, because of their role in the food supply chain and their prominent role in the public debate around immigration and labor, the following section focuses on the need to better protect H-2A and H-2B workers.
H-2A and H-2B are two of many U.S. temporary work visa programs.139 The Immigration and Nationality Act of 1952 first created some of the current temporary work visas, including the H-2 visas for foreign nationals “coming temporarily to the United States to perform other temporary services or labor, if unemployed persons capable of performing such service or labor cannot be found in this country.”140 In 1986, the Immigration Reform and Control Act (IRCA) split the H-2 visa into two separate visas, the H-2A for temporary workers employed in agricultural occupations and H-2B for temporary workers in occupations outside of agriculture.141 H-2A is explicitly for temporary and seasonal jobs in agriculture, and in practice mostly used for crop farming, and the H-2B program is intended to be used when non-agricultural employers face labor shortages in seasonal jobs. The most common occupations in H-2B are landscaping, construction, forestry, seafood and meat processing, traveling carnivals, restaurants, and hospitality. The H-2A visas program has no annual numerical limit or “cap.” In H-2B however, legislation enacted subsequent to IRCA, the Immigration Act of 1990, established an annual numerical limit of 66,000 H-2B visas that could be issued annually, and which took effect in fiscal year 1992.142 This annual numerical limit of 66,000 visas is often referred to as the H-2B annual “cap,” but has been raised in all but one fiscal year since 2016 through congressional appropriations riders.
The size of the H-2A program has expanded rapidly over the past decade, as well as the size of the H-2B visa program, despite its annual cap of 66,000 per fiscal year.
As Figure N shows below—whether by the number of jobs certified by the U.S. Department of Labor (DOL) or the number of visas issued by the State Department—the size of the H-2A program has more than quadrupled since 2012. In 2012, DOL certified 85,248 jobs for H-2A, and in 2022, there were 371,619 certified jobs. In 2012, the State Department issued 65,345 H-2A visas, and in 2022, issued 298,336.
H-2A jobs certified and visas issued, 2005–2022, and petitions approved, 2015–2022
| Year | Jobs Certified | Visas Issued | Petitions Approved |
|---|---|---|---|
| 2005 | 48,336 | 31,892 | |
| 2006 | 59,110 | 37,149 | |
| 2007 | 76,814 | 50,791 | |
| 2008 | 82,099 | 64,404 | |
| 2009 | 86,014 | 60,112 | |
| 2010 | 79,011 | 55,921 | |
| 2011 | 77,246 | 55,384 | |
| 2012 | 85,248 | 65,345 | |
| 2013 | 98,821 | 74,192 | |
| 2014 | 116,689 | 89,274 | |
| 2015 | 139,832 | 108,144 | 154,262 |
| 2016 | 165,741 | 134,368 | 175,171 |
| 2017 | 200,049 | 161,583 | 215,079 |
| 2018 | 242,762 | 196,409 | 279,482 |
| 2019 | 257,667 | 204,801 | 302,422 |
| 2020 | 275,430 | 213,394 | 308,877 |
| 2021 | 317,619 | 257,898 | 339,314 |
| 2022 | 371,619 | 298,336 | 402,929 |
Notes: All references to a particular year should be understood to mean the U.S. government’s fiscal year (October 1–September 30).
Source: U.S. Department of Labor, Office of Foreign Labor Certification, OFLC Performance Data; U.S. Department of State, Bureau of Consular Affairs, “Nonimmigrant Visa Statistics”; U.S. Department of Homeland Security, United States Citizenship and Immigration Services, H-2A Employer Data Hub.
Because three separate agencies are involved in managing the H-2A visa program, it is difficult to know the exact number of H-2A workers employed in the United States: DOL reviews and adjudicates applications for job certifications, USCIS in the Department of Homeland Security reviews and adjudicates petitions, and State issues or denies visas. This leads to three separate data sources which offer a different picture of the size of the program (see the three lines on the chart in Figure N).
Figure O from Rural Migration News at the University of California, Davis, shows that over half of the H-2A jobs certified by DOL had worksites located in just five states: California, Florida, Georgia, North Carolina, and Washington.143 The share of H-2A jobs that these states accounted for rose from 34% in 2007 to 52% in 2021, meaning that much of the growth in the H-2A program has been accounted for by the growth in these five states in the southeast and west.
The top five states had 52% of H-2A jobs in Fiscal Year 2021; in California and Washington H-2A rose the fastest
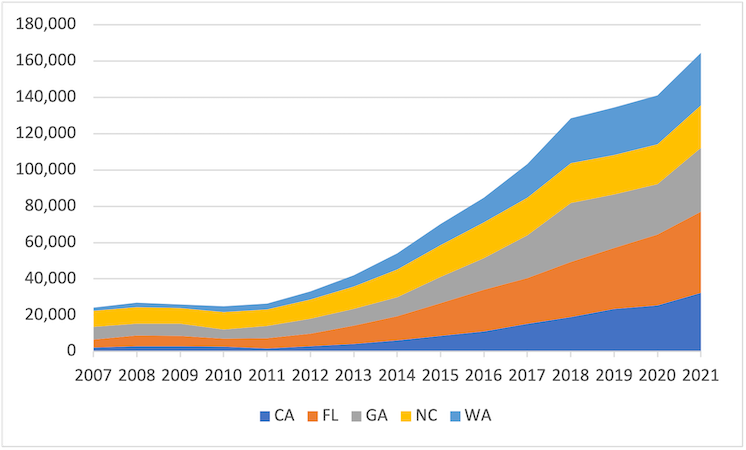
Note: Numbers represent approved job certifications for H-2A by the Office of Foreign Labor Certification in the Employment and Training Administration, U.S. Department of Labor, in five states: California, Florida, Georgia, North Carolina, and Washington.
Source: Figure reproduced with permission from author. Rural Migration News, "The H-2A Program in 2022," University of California, Davis, May 16, 2022.
In terms of the H-2B program, it has also recently grown to record levels. While, as noted above, the annual cap for the H-2B program has been set in law at 66,000 since 1992, in recent years the number of H-2B workers has been much higher, due mostly to congressionally authorized increases every year, along with extensions and exemption from the cap. The first temporary modification to the H-2B cap occurred during fiscal years 2005-2007, when Congress passed a law putting in place a temporary “returning worker exemption” during those years that allowed migrant workers who had been employed with an H-2B visa in any one of the previous three fiscal years to not be counted against the annual cap. As a result, the H-2B program reached its high point of 129,547 in fiscal year 2007.144 It should be noted that because of extensions and exemptions from the cap, the actual number of H-2B workers was likely higher in 2007, but the true number is unknown because those data on visa extensions are not publicly available.
New data from the USCIS H-2B Employer Data Hub that were first published in 2021 provide new insights into the current size of the H-2B program and the impact of the returning worker and supplemental H-2B visas that have been added since fiscal year 2016. As Figure P shows, the number of H-2B workers in 2022 was nearly 156,000, much more than double the annual cap of 66,000.
The H-2B visa program is more than double the size of the original annual cap and set to grow larger in 2023: H-2B workers employed in the United States according to approved USCIS petitions and visas issued by the State Department, FY 2015–22
| Year | New H-2B workers | H-2B extensions | New visas issued | New visas issued | H-2B statutory cap | H-2B cap + supplemental cap | H-2B cap + supplemental cap |
|---|---|---|---|---|---|---|---|
| 2015 | 70,180 | 6,190 | 69,684 | 66,000 | |||
| 2016 | 85,203 | 5,237 | 84,627 | 66,000 | |||
| 2017 | 84,037 | 7,352 | 83,600 | 66,000 | 81,000 | ||
| 2018 | 84,752 | 9,773 | 83,774 | 66,000 | 81,000 | ||
| 2019 | 99,011 | 11,359 | 97,623 | 66,000 | 96,000 | ||
| 2020 | 65,716 | 15,719 | 61,865 | 66,000 | |||
| 2021 | 97,129 | 19,555 | 95,053 | 95,053 | 66,000 | 88,000 | |
| 2022 | 126,426 | 29,223 | 124,644 | 66,000 | 121,000 |
Notes: “New H-2B workers” represents the number of new H-2B workers estimated by United States Citizenship and Immigration Services (USCIS). “H-2B extensions” represents USCIS petitions for H-2B workers approved for continuing employment (i.e., visa extensions or extensions of status), as reported in the USCIS H-2B Employer Data Hub. Data on continuing employment may overcount the number of individual H-2B workers because those data also include H-2B workers who changed employers or amended their terms of employment with the same employer. “New visas issued” is the number of H-2B visas issued by the State Department.
Source: EPI analysis of data from United States Citizenship and Immigration Services, U.S. Department of Homeland Security, H-2B Employer Data Hub, fiscal year 2015–2022 data files; Characteristics of H-2B Nonagricultural Temporary Workers reports for fiscal years 2015–2021, available at the USCIS Reports and Studies page; and U.S. Department of State, “Nonimmigrant Visa Statistics” (see PDF files for tables listed under “Nonimmigrant Worldwide Issuance and Refusal Data by Visa Category” and “Nonimmigrant Visas by Individual Class of Admission” for fiscal years 2015–2022).
Why does it matter that the H-2A and H-2B programs have grown in recent years? Because while the H-2A and H-2B programs continue to expand—with further growth expected, and the Biden administration making H-2 programs a central component of their Collaborative Migration Management Strategy for Central and North America—at the same time, data on labor standards enforcement from the Wage and Hour Division make clear that farmworkers in agriculture, including H-2A workers, and all workers in H-2B industries are not adequately protected in the workplace. As the program expansions continue, much more must be done to ensure that both temporary migrant workers and U.S. workers are paid and treated fairly.
The need for additional and improved enforcement in agriculture, where H-2A workers are employed, was already discussed above, thus I will now turn to relevant data on the H-2B program. This following section discusses some of the available data on wage and hour enforcement in the major H-2B industries.145
Wage theft is a massive problem in the major H-2B industries: Employers stole $1.8 billion from workers since 2000
As just noted, the data are clear that the H-2B program’s size is on the cusp of reaching new heights. Why does that matter? Because at the same time, data on labor standards enforcement from DOL’s WHD paint a picture of rampant wage theft and lawbreaking by employers in the industries that employ most H-2B workers. H-2B workers are being recruited into industries where they will be vulnerable, but no new measures have been implemented yet by the Biden administration to better protect them.
WHD publishes and annually updates tables with summary data on the outcomes of WHD enforcement actions in what it calls “industries with high prevalence of H-2B workers.” The seven industries that WHD lists in these data tables include landscaping services, janitorial services, hotels and motels, forestry, food services, construction, and amusement. Data on the top H-2B occupations (from DOL labor certifications and from the USCIS H-2B Employer Data Hub) show that the vast majority of H-2B jobs that are certified by DOL and approved by USCIS are within these broad industries.146
Table 4 lists the top H-2B occupations by number of approvals in the USCIS H-2B Employer Data Hub. The listed occupations generally correspond with the seven “high H-2B prevalence” industries listed by WHD in their data tables and accounted for 99.1% of all H-2B approvals in 2021. If we exclude occupation #8, “N/A”—which represents data observations in which the occupation field was missing—the remaining nine occupations still account for 95.7% of all H-2B approvals in 2021.147
Nearly all H-2B workers are employed in a small number of occupations: Top 10 H-2B occupations by number of USCIS-approved petitions, fiscal year 2021
| H-2B Rank | Major group SOC code | Occupation | Initial approval | Continuing approval | Total approvals | Share of total H-2B approvals |
|---|---|---|---|---|---|---|
| 1 | 37 | Building and Grounds Cleaning and Maintenance Occupations | 56,388 | 6,960 | 63,348 | 48.0% |
| 2 | 51 | Production Occupations | 13,087 | 2,674 | 15,761 | 11.9% |
| 3 | 45 | Farming, Fishing, and Forestry Occupations | 10,692 | 2,057 | 12,749 | 9.7% |
| 4 | 35 | Food Preparation and Serving Related Occupations | 6,744 | 3,262 | 10,006 | 7.6% |
| 5 | 39 | Personal Care and Service Occupations | 8,785 | 1,149 | 9,934 | 7.5% |
| 6 | 47 | Construction and Extraction Occupations | 7,270 | 1,052 | 8,322 | 6.3% |
| 7 | 53 | Transportation and Material-Moving Occupations | 4,512 | 576 | 5,088 | 3.9% |
| 8 | N/A | N/A | 3,191 | 1,424 | 4,615 | 3.5% |
| 9 | 49 | Installation, Maintenance, and Repair Occupations | 512 | 101 | 613 | 0.5% |
| 10 | 27 | Arts, Design, Entertainment, Sports, and Media Occupations | 520 | 22 | 542 | 0.4% |
| Totals for the top 10 | 111,701 | 19,277 | 130,978 | 99.1% | ||
| Totals for top 10 occupations excluding N/A | 108,510 | 17,853 | 126,363 | 95.7% | ||
| Total H-2B approvals, all occupations | 112,546 | 19,555 | 132,101 | 100% | ||
Note: SOC stands for Standard Occupational Classification, which is a system of job classification created by the U.S. Department of Labor, see https://www.bls.gov/oes/current/oes_stru.htm#47-0000. N/A stands for not available; these were individual records in the H-2B Employer Data Hub that had blank fields for the column listing the occupation in an H-2B petition.
Source: United States Citizenship and Immigration Services, U.S. Department of Homeland Security, H-2B Employer Data Hub, fiscal year 2021 data file.
The published WHD enforcement data include tables for individual fiscal years in four different categories.148 The first set of tables, “All Acts,” includes data on violations of all wage and hour laws enforced by WHD in the listed industries. The second set of tables, “H-2B,” summarizes employer violations of H-2B program laws and regulations. The next set, “FLSA,” summarizes employer violations of the Fair Labor Standards Act. The final set, “All Others,” summarizes violations of all laws that WHD enforces except for violations of FLSA or H-2B laws and regulations.
In the “All Acts” tables, the data fields listed by WHD in their enforcement data for the seven selected industries include:
- Cases: the number of cases investigated by WHD
- Cases with violation: the number of cases in which violations of the law were found
- EEs (employees) employed in violation: the number of employees involved in the cases in which violations were found
- EE’s ATP (employees’ agreed to pay): the number of employees who were found to be owed back wages as a result of the identified violations and to whom employers have agreed to pay the back wages owed
- BW ATP (back wages agreed to pay): the total amount of back wages that were assessed by WHD to be owed to workers and which employers have agreed to pay back to workers
- CMP assessed: the total amount of civil money penalties (CMPs) that were assessed to employers that committed violations. The assessment of CMPs is intended to deter future violations of wage and hour laws.
It is important to note that the violations and back wages owed that are detailed in these tables from WHD do not represent enforcement actions that involve only H-2B workers; they represent violations and back wages owed to any workers in the seven selected H-2B industries. These may include U.S. citizens, lawful permanent residents (i.e., green card holders), H-2B workers, or workers of any other immigration status, including unauthorized immigrant workers.
The WHD’s “All Acts” tables provide these data for 22 fiscal years, from 2000 to 2021. Table 5 sums the total numbers of listed cases and employees involved, along with the total amounts of back wages owed and civil money penalties across all 22 fiscal years, adjusting the back wages owed and CMPs assessed to constant 2021 dollars.
Table 5 shows that across the 2000–2021 period, there were over 225,227 cases investigated by WHD, and violations were found in 180,451 of those cases, or 80% of cases. That means that whenever WHD initiates an investigation into an employer in these seven major H-2B industries, there is an 80% chance—a very high likelihood—that WHD will find employer violations.
Employers have stolen $1.8 billion in wages over the last two decades from workers in industries that employ H-2B workers: Back wages and civil money penalties assessed for wage and hour violations in industries with a high prevalence of H-2B workers, by industry, fiscal years 2000–2021
| Industry | Cases | Cases with violations | Employees involved in violation | Employees owed back wages | Back wages assessed (2021$) | Average back wages owed per employee (2021$) | Civil money penalties assessed (2021$) |
|---|---|---|---|---|---|---|---|
| All seven industries | 225,227 | 180,451 | 1,835,805 | 1,666,195 | $1,792,259,236 | $1,076 | $114,791,387 |
| Landscaping services | 5,705 | 4,289 | 64,734 | 58,404 | $60,088,422 | $1,029 | $4,833,676 |
| Janitorial services | 11,660 | 9,391 | 105,604 | 96,279 | $96,808,594 | $1,006 | $3,289,109 |
| Hotels and motels | 22,469 | 18,501 | 150,452 | 140,864 | $86,691,426 | $615 | $8,430,597 |
| Forestry | 1,479 | 1,102 | 13,089 | 10,860 | $10,781,520 | $993 | $4,262,217 |
| Food services | 108,244 | 88,765 | 839,171 | 752,417 | $654,970,169 | $870 | $64,575,989 |
| Construction | 68,012 | 52,441 | 591,131 | 542,034 | $847,882,693 | $1,564 | $20,515,880 |
| Amusement | 7,658 | 5,962 | 71,624 | 65,337 | $35,036,411 | $536 | $8,883,919 |
Notes: Tables include all violations of laws enforced in the selected industries by the Wage and Hour Division of the U.S. Department of Labor. The violations and back wages owed do not represent enforcement actions by the Wage and Hour Division that involve only H-2B workers; they represent violations and back wages owed to any workers in the seven selected H-2B industries. These may include U.S. citizens, lawful permanent residents (i.e., green card holders), H-2B workers, or workers of any other immigration status, including unauthorized immigrant workers. Dollar amounts reported in this table have been adjusted for inflation to constant 2021 dollars using the CPI-U-RS. As a result, the dollar amounts presented here may differ from the amounts reported in the source data. Totals may not sum due to rounding.
Source: EPI analysis of U.S. Department of Labor, Wage and Hour Division, “Industries with High Prevalence of H-2B Workers” [data tables for fiscal years 2000–2021].
Table 5 also shows that 1.8 million workers were involved—i.e., were potential victims—in the cases that detected violations, and nearly 1.7 million of those workers were assessed by WHD to have actually been victims of wage theft—that is, their employers had failed to pay them the full wages to which they were entitled by law.
For those 1.7 million employees, WHD assessed a total of nearly $1.8 billion in back wages that were owed to them by their employers during the 22 fiscal years from 2000 through 2021. That’s an average of nearly $81.5 million stolen per year. Such a large dollar amount of stolen wages is particularly shocking when considering that most of the jobs in the seven major H-2B industries are associated with very low wages.149
It’s also important to remember that $1.8 billion represents only the extent of wage theft detected in the cases WHD investigated. We have no way of knowing the actual amount of wages stolen in these industries. We do know that workers—both U.S. and migrant workers—often hesitate to report wage and hour and labor violations for fear of retaliation.150 We also know that WHD has limited investigative capacity.151 For these reasons, we suspect the actual extent of wage theft is higher—perhaps significantly higher—than $1.8 billion.
In addition to the column headers available in the WHD tables, Table 5 includes an additional column (vis-à-vis DOL’s original tables) calculating the average back wages owed per employee who was assessed back wages. On average, each worker who was assessed back wages was owed $1,076 by their employer. Back wages owed to workers were highest in construction, an average of over $1,500 per worker. The second-highest amount of back wages owed per worker was in landscaping—the industry that every year accounts for nearly half of all H-2B jobs—at just over $1,000 per worker.
In terms of civil money penalties (CMPs), the total amount of CMPs assessed during 2000–2021 was nearly $115 million. The largest share, $64.6 million (representing more than half of the total penalties), was assessed in food services. Construction accounted for nearly 18% of the CMPs assessed, at $20.5 million.
The H-2A and H-2B visa programs: Studies and reports show thousands of migrant workers have been victims of human trafficking
Numerous reports published by news media outlets, researchers, advocates, and official government sources have explored the link between temporary work visa programs and human trafficking, finding that trafficking cases are common, especially among workers with H-2A and H-2B visas. This section references just a few of the major reports.
A recent report published by the nonprofit anti-trafficking organization Polaris, analyzed data collected by Polaris on their Trafficking Hotline that allows victims to call for help and information. The report, Labor Trafficking on Specific Temporary Work Visas: A Data Analysis 2018-2020, found that out of nearly 16,000 victims of human trafficking they identified through their Trafficking Hotline, more than half “were foreign nationals holding legal visas of some kind, including temporary work visas.”152 More specifically Polaris describes that “there were 9,811 victims of labor trafficking who were either U.S. citizens, legal permanent residents or foreign nationals whose status in the United States was identified to the Trafficking Hotline. A full 55.2 percent of these victims were foreign nationals on visas or with legal status as asylees or refugees.”153
A study on human trafficking in the United States published by the Urban Institute, a think tank, in 2014 found that the most common industries where workers were victimized were “agriculture, hospitality, domestic service in private residences, construction, and restaurants.” As noted earlier in this testimony, H-2A visas are used exclusively in agriculture, and some of the most common H-2B industries include hospitality, construction, and restaurants and the food industry. The Urban Institute also found that “The majority of victims (71 percent) entered the United States on a lawful visa,” and that “The most common temporary visas were H-2A visas…and H-2B visas.”154
The U.S. Government Accountability Office, a federal agency that “provides Congress, the heads of executive agencies, and the public with timely, fact-based, non-partisan information that can be used to improve government and save taxpayers billions of dollars,”155 published a report in 2015 (which was reissued in 2017), examining in part “how well federal departments and agencies protect H-2A and H-2B workers.”156 The title of report suggests what the GAO found, despite the agency’s caveats about how it was working with limited data: H-2A and H-2B Visa Programs: Increased Protections Needed for Foreign Workers. The GAO found that between 2009 and 2013, there were 186 H-2A and H-2B workers who were approved for T visas due to being victims of trafficking. GAO also noted that “According to [their] interviews with federal and NGO officials, the incidence of abuse may be underreported.”157
Another recent example is what has been referred to as Operation Blooming Onion in Georgia, which involved tens of thousands of workers, and where “24 people conspired for three years to smuggle Mexican and Central American workers and forced them to work in brutal conditions on farms located across the world, including the southern, middle and northern regions of Georgia,” which the acting U.S. Attorney for the Southern District of Georgia referred to as a case of “modern-day slavery.”158 In that case, H-2A workers who were allegedly trafficked “primarily labored on onion farms, digging with their bare hands, and paid only 20 cents for each bucket. The conspirators forced the workers, despite making very little, to pay for transportation, food, and housing.” The acting U.S. attorney also noted that the case likely involved “the misuse of the H-2A-program en-masse.” Furthermore, according to the indictment:
if a worker stepped out of line, the conspirators threatened them with guns, torture and deportation. The conspirators kept the workers in cramped, unsanitary quarters and fenced work camps with little or no food, limited plumbing and without safe water. The conspirators are accused of raping, kidnapping and threatening or attempting to kill some of the workers or their families, and in many cases, sold or traded the workers to other conspirators As a result of workplace conditions, at least two workers died, according to the indictment.159
The reports listed here are just a small sampling of the reports that have been made public over the years that involve temporary work visa programs,160 and serve as proof that much more must be done to protect migrant workers from trafficking in the H-2A and H-2B visa programs.
Recommended congressional action on H-2 visas
While there is a pressing need for the Biden administration to immediately take action to reform the H-2A and H-2B visa programs, reforms that are passed by Congress and signed into law by the president would endure for longer and not be as easily reversed by a future presidential administration. This section discusses some of the key legislative reforms that would improve the H-2 visa programs, and the final section discusses needed reforms to improve all U.S. temporary work visa programs more generally.
Congress should improve the H-2B program by passing the Seasonal Worker Solidarity Act
In terms of the H-2B visa program, Rep. Joaquin Castro (D-Texas) has proposed legislation to reform and improve the H-2B visa program. Rep. Castro’s Seasonal Worker Solidarity Act (SWSA) would, among other things, require that employers pay H-2B workers no less than the local average wage for the occupation, as well as eliminate loopholes that employers use to circumvent paying fair wages in the current H-2B program, improve the process for recruitment of U.S. workers, improve and enhance enforcement of labor standards, and provide H-2B workers with a quick path to permanent residence that they control on their own.161 In general, the SWSA is the best and most comprehensive reform bill on H-2B visas; it would convert an abusive and dysfunctional temporary work visa program into one that is fairer to all workers and provides a direct pathway to permanent residence and citizenship, allowing migrant workers to fully integrate into American life.
Congress should repeal and no longer pass legislative riders to expand and deregulate the H-2B program through annual appropriations bills
Another issue facing Congress with respect to H-2B are the legislative riders included in appropriations bills that fund the U.S. government. In each year since fiscal year 2017, Congress has given the executive branch the discretionary legal authority to roughly double the number of H-2B visas available, allowing them to add up to 64,716 supplemental visas each year, authority which the Biden administration used this year to increase the H-2B cap to 130,716. This authority was provided to DHS through appropriations legislation to fund the operation of the U.S. government. Those appropriations laws included language (known as a “rider”) giving the executive branch the legal authority to expand the H-2B program during the fiscal year that the appropriations bill corresponds to. The Democrats and Republicans in the congressional appropriations committees who included and supported the language to expand H-2B failed to specify the level of increase they wanted for the H-2B program—passing the buck instead to the executive branch, by directing DHS, in consultation with DOL, to determine how many additional H-2B visas are appropriate, if any. DHS has interpreted the statute to allow it to issue up to 64,716 supplemental visas.162 (In total it has been eight years since Congress first increased the size of the H-2B program through an appropriations rider. In fiscal year 2016, the first rider provided for a “returning worker” exemption—i.e., exempting H-2B workers from the cap if they were previously in H-2B status in the previous three fiscal years—rather than the discretionary authority to increase the cap by up to 64,716 that has persisted since.)163
A number of other changes to the H-2B program have been made through appropriations riders since 2015 as well, including riders to prevent DOL from enforcing key H-2B regulations that protect workers.164 For example, one rider prohibited DOL from enforcing rules against worker discrimination in the H-2B program (known as the rule on corresponding employment), as well as one requiring employers to guarantee that H-2B workers would be allowed to work for at least three-fourths of the workdays promised on their job contracts (known as the three-fourths guarantee). There were also riders that prohibited DOL from conducting audits and oversight of employers to ensure they conducted the required recruitment of U.S. workers, and a rider that permitted H-2B employers to set the wage rates for H-2B workers according to wage surveys that they provide, instead of paying wage rates that are higher according to data provided by DOL (the rider on employer-provided wage surveys). Together these riders allowed H-2B employers to treat their workers unfairly and underpay them with impunity. As of fiscal year 2022, the riders on preventing DOL enforcement of the corresponding employment and three-fourths guarantee rules were still in effect, as well as the rider permitting the broad use of employer-provided wage surveys to set H-2B wage rates.
This is not an ideal way to make immigration policy. The New York Times editorial board once alluded to this about H-2B, arguing that the program is so problematic that Congress should not expand it with budget riders,165 and there have been bipartisan statements from leaders in Congress—including in this Committee—arguing that the budget riders usurp the authority of the relevant committees of jurisdiction in Congress.166 Nevertheless, enough members of Congress have buckled to industry pressure and included the rider language in successive years. Congress should now repeal the H-2B riders, allowing DOL to enforce all worker protections in the H-2B regulations, and ending the ad hoc expansions of the H-2B cap.
Congress should pass legislation that legalizes the undocumented farm workforce and provides access to green cards for H-2A workers, and reject proposals to make the H-2A program available for year-round jobs through appropriations riders
The single most meaningful piece of legislation that Congress could pass to improve conditions for all farmworkers—migrants, U.S. workers, and H-2A workers, is a broad and quick pathway to citizenship for farmworkers who are unauthorized immigrants. Because it would immediately provide basic labor and employment rights to unauthorized immigrants, a broad legalization would thereby immediately raise standards for all farmworkers and empower workers to come forward and report lawbreaking employers, which in turn will raise wages, consistent with previous legalizations.
When it comes to H-2A workers, at present, they have no viable pathway to remain permanently in the United States, despite often returning to the United States year after year—sometimes for more than a decade—to work in temporary and seasonal jobs. H-2A reform legislation should be introduced and passed that would create new green cards that would be available to H-2A workers, who should be allowed to self-petition for them after 12 months of accrued employment in H-2A status. Such legislation would honor and reward the contributions of H-2A workers and allow them and their families to become a permanent part of American society and integrate fully.
In addition, Congress should avoid making the H-2A program available for year-round agricultural jobs through appropriations riders. Similar to how riders to omnibus appropriations bills have been used to expand and deregulate the H-2B program, there have been recent proposals in Congress to allow H-2A jobs—which currently must be of a temporary or seasonal nature—to become eligible for year-round agricultural occupations.
According to an analysis I published in 2019, there were just over 419,000 year-round jobs in agriculture at the time, mostly in greenhouse and nursery production (155,000) and animal production and aquaculture (264,000).167 Farm employers have been clamoring for years for Congress to allow them to hire temporary H-2A workers for many of these 419,000 permanent, year-round jobs, especially on dairies. Since they haven’t had the requisite support to pass legislation that would accomplish this, members of Congress have attempted multiple times to circumvent the regular legislative process by pushing to make the change through legislative riders on annual omnibus appropriations bills.168
However, using a problematic temporary work visa program where workers are virtually indentured to their employers in order to fill permanent, year-round jobs should give pause to all members of Congress—it makes no sense, unless the goal is to keep workers employed in permanent jobs from having equal rights and fair pay. If migrant workers are filling true labor shortages in permanent, year-round jobs, then those workers should always get permanent immigrant visas that put them on a path to citizenship.
Recommendations for reforming temporary work visa programs more broadly
The bargaining power of workers is undercut when more than 2 million temporary migrant workers—1.2% of the U.S. labor force—are underpaid by employers and cannot safely complain to DOL or sue employers that exploit them because their visa status is owned and controlled by their employer. To remedy this, a number of key reforms have been proposed and should be considered, both to protect workers and also to modernize the U.S. system for labor migration writ large. These reforms would help develop a strong evidence base for migration policymaking that is nimble enough to respond to the demands of a modern economy with needs that are constantly changing.
While many key improvements to temporary work visa programs including H-2A and H-2B can be accomplished by the executive branch through regulations—most notably by ensuring that migrant workers are paid fairly by improving prevailing wage rules in some visa programs and creating new wage rules in the programs that lack them—the reality remains that the most transformative and lasting solutions will require congressional action. An added benefit of these more durable solutions is that they will set a useful baseline of protections for temporary migrant workers, both in normal times and during emergencies like pandemics, and during both periods of high unemployment and tight labor markets. In addition, improving labor standards for temporary migrant workers will lift the floor for all workers, which will increase bargaining power and raise wages, including during times of high unemployment.
Congress should reform temporary work visa programs by passing laws to update, simplify, and standardize the rules for all of them, in ways that make them consistent with basic human and labor rights. The following sections briefly discuss the key reforms that are necessary.
Congress should regulate foreign labor recruiters to protect migrant workers
Congress could begin its reforms by requiring employers to recruit and offer jobs to qualified U.S. workers before being allowed to recruit workers abroad, ensuring transparency in the recruitment process abroad for potential migrant workers who may participate in visa programs, and requiring that employers be held accountable for the actions of labor recruiters abroad.
There is at least one example of legislation that could serve as a starting point for achieving the reforms necessary to ensure transparency and accountability in recruitment for migrants who are abroad, although it would need to be improved upon. The comprehensive immigration reform legislation that passed the Senate in 2013 contained a section on foreign labor recruitment, which, if it had become law, would have created a new program requiring foreign labor contractors who recruit migrant workers to register with DOL and to disclose certain information about recruited workers, employers, subcontractors, and job terms, and to post a bond.169 The provisions would have also prohibited discriminating or retaliating against workers, banned the charging of recruitment fees to workers, and implemented a new complaint and investigation process along with administrative fines and a private right of action, allowing either the government or an aggrieved person to bring a civil action to enforce the rights of migrant workers.
Congress should require that all temporary migrant workers are paid fairly according to U.S. wage standards
And next, in cases where employers hire migrant workers after proving they were unable to recruit U.S. workers at prevailing wages—in order to preserve U.S. wage standards and ensure that temporary migrant workers are paid a fair wage that is commensurate with the value of their labor—the law should require that all workers with temporary visas are paid no less than the local average or median wage for their job.
There are some key legislative proposals that would achieve this for particular visa programs. In terms of jobs that require at least a college degree, the H-1B and L-1 Visa Reform Act, a bipartisan proposal originally introduced by Sens. Richard Durbin (D-Ill.) and Chuck Grassley (R-Iowa), would reform the H-1B program by requiring employers to first recruit U.S. workers for open positions, and then require employers to pay H-1B workers at least the local median wage, and would provide DOL with additional authority to ensure compliance with the program.170 Employers would also be required to pay temporary migrant workers with L-1 visas the local median wage (the L-1 visa program currently has no wage rule). The bill is now co-sponsored by Democratic Sens. Richard Blumenthal of Connecticut, Sherrod Brown of Ohio, and Bernie Sanders of Vermont, and a bipartisan version was introduced last Congress in the House of Representatives, co-sponsored by Democratic Reps. Bill Pascrell of New Jersey and Ro Khanna of California.171
Another piece of legislation, proposed by Sens. Durbin (D-Ill.), Blumenthal (D-Conn.), Klobuchar (D-Minn.), Padilla (D-Calif.), Hirono (D-Hawaii), and Brown (D-Ohio), would facilitate the fair recruitment of recent foreign graduates of U.S. universities with degrees in the science, technology, engineering, and math (STEM) fields. The Keep STEM Talent Act would allow STEM graduates to obtain green cards—and bypass years of being indentured on temporary visas—if employers simply go through the DOL labor certification process and offer to pay the fair market wage.172
In terms of the H-2B visa program, Rep. Joaquin Castro’s aforementioned Seasonal Worker Solidarity Act (SWSA) would, among other things, require that employers pay H-2B workers no less than the local average wage for the occupation, as well as eliminate loopholes that employers use to circumvent paying fair wages in the current H-2B program.173
Congress should prohibit temporary migrant workers from being indentured to their employers through their visa status and allow workers to self-petition for permanent residence
Another priority for Congress would be to pass a law firmly establishing that temporary migrant workers will no longer be tied and indentured to their employers through their visa status. Congress should also limit the time that temporary migrant workers are in a temporary/nonimmigrant status by allowing them to self-petition for permanent residence after a short provisional period,174 but preferably no longer than 18 months. The aforementioned Seasonal Worker Solidarity Act, for example, would allow H-2B workers to change employers and to self-petition for permanent residence after accruing 18 months of work in H-2B status.
Congress should appropriate more funding to enforce labor standards and bar employers from hiring through visa programs if they violate labor and employment laws
Because of how perpetually underfunded it has been, Congress should appropriate much more funding to DOL to enforce this updated work visa system175 and strengthen the department’s mandates to conduct adequate oversight, including random audits of employers, and pass laws permanently banning any employer from hiring through temporary work visa programs if that employer has violated labor and employment laws. Investigative news reports have revealed that even when DOL sanctions an employer for labor violations committed against temporary migrant workers, the employers are often required to pay only nominal fines and are allowed to continue hiring new workers through visa programs.176
Congress should pass the POWER Act to protect workers of all immigration statuses from the threat of employer retaliation and deportation
Congress should also prioritize reintroduction and passage of the Protect Our Workers from Exploitation and Retaliation (POWER) Act, perhaps the single most important piece of legislation aimed at protecting workers of all immigration statuses from the threat of employer retaliation and deportation. The POWER Act was last introduced in March 2023 by Reps. Judy Chu (D-Calif.) and Rep. Bobby Scott (D-Va.) and is supported by various unions and migrant worker advocacy organizations.177 The POWER Act would expand access to humanitarian “U” visas for migrant workers who report workplace violations (U visas are currently available to victims of certain qualifying crimes who are cooperating in a related investigation or prosecution),178 increase the number of U visas available, and extend eligibility to more labor-related crimes.
The POWER Act would also strengthen the investigative powers of labor standards enforcement agencies. And it would permit postponing the deportation of migrant workers who file a bona fide workplace claim or are a material witness to one, so they can remain in the country to pursue the claim; they would also be eligible for employment authorization so they can work during that time.
Congress should improve transparency in temporary work visa programs to protect workers and aid anti-trafficking efforts
While the reforms discussed in the preceding sections would go a long way toward protecting temporary migrant workers, other systemic reforms are also urgently needed to more broadly protect labor standards and modernize the immigration system.
For example, there should be much more transparency in the system. Too little is known about how temporary work visa programs are being used, in part because data on visas are collected on paper forms and applications rather than electronically,179 and even most of the digitized information collected is not made public or requires lengthy and costly Freedom of Information Act requests to obtain. Migrant worker advocates have pressed for years for more and better government data and transparency in work visa programs to ensure that migrants are being paid fairly, and that the immigration system is not being co-opted in ways that allow employers to discriminate and segregate the workforce. More data would also serve as a tool that could aid the organizations and advocates who are fighting human trafficking.180 Bipartisan legislation has been introduced to achieve this, most recently the Visa Transparency Anti-Trafficking Act,181 but opposition by employers has caused it to stall.
Congress should create an independent commission on employment-based migration to make the system more flexible and data-driven and depoliticize the adjustment of numerical limits
Last but not least, temporary work visa programs and the U.S. labor migration system writ large must be reformed to be more flexible and data-driven. For example, most numerical limits (i.e., quotas or caps) for permanent and temporary work visas were set by law in 1990 and have not been changed since, despite vast fluctuations in economic conditions. A more rational system would have annual caps that adjust to changing conditions—increasing when necessary to alleviate proven labor shortages and decreasing during economic slowdowns and recessions.
The best proposal to do this is through the creation of an independent, permanent commission on employment-based migration, which would be a high-level body staffed by expert researchers with integrity and technical competence, and who are tasked with studying immigration and the labor market and providing timely and reliable data and analysis to policymakers and the public. The commission could work to develop much better measures of labor market shortages, assessment methodologies, and processes to efficiently adjust migrant worker flows to match employers’ needs while protecting U.S. labor standards.182
Adjusting annual visa caps requires congressional action, which can be contentious, influenced by lobbying and opaque political considerations rather than facts, and too slow to keep up with changing economic conditions. A commission would report regularly to Congress and the president, proposing new quotas on an annual or semi-annual basis, and issue public reports citing the evidence for its recommendations, which would be based on methodologies that are credible and transparent. The commission would consider the many trade-offs inherent in immigration policymaking in its recommendations, and Congress would ultimately decide which policies to adopt or reject. But basing quotas on evidence and data would have the effect of depoliticizing the process of setting numbers and provide an evidence base for decisions that can be inspected by all.
Models for such a commission already exist, both in the United States and abroad. In the United States, for example, it would be difficult to imagine Congress making decisions about trade policy without the advice of the International Trade Commission. Both immigration and trade are vital to the U.S. economy, but Congress cannot be expected to have the relevant expertise to make fully informed decisions about either. In the United Kingdom, the Migration Advisory Committee (MAC) is an independent governmental body that studies labor shortages and makes recommendations to Parliament about when to facilitate more migration and for which occupations. The MAC is staffed with notable economists and labor market experts who study what they call “top-down” labor market indicators, such as growth in wages, employment, and unemployment, and job vacancy data, but MAC staff also interview both employers and unions to get a sense of what’s happening on the ground—what the MAC calls “bottom-up” indicators—which serve to better inform the MAC when crafting its recommendations.183
A number of bipartisan groups and research institutes have called for an independent commission on employment-based migration or some version of it, including The Independent Task Force on Immigration and America’s Future (co-chaired by Lee Hamilton and Spencer Abraham), the Council on Foreign Relations’ Independent Task Force on U.S. Immigration Policy (co-chaired by Jeb Bush and Thomas McLarty III), the Brookings-Duke Immigration Policy Roundtable, the Brookings Institution, the Economic Policy Institute, and the Migration Policy Institute. Versions of a commission have been introduced multiple times in proposed legislation184 and should be considered again, either as a standalone proposal or as an integral component of a comprehensive immigration reform package.
Notes
1. Jennifer Sherer and Nina Mast, Child labor laws are under attack in states across the country: Amid increasing child labor violations, lawmakers must act to strengthen standards, Economic Policy Institute, March 14, 2023.
2. Bureau of Labor Statistics, “Foreign Born Workers: Labor Force Characteristics—2022,” U.S. Department of Labor, News Release, May 18, 2023.
3. Bureau of Labor Statistics, “Foreign Born Workers: Labor Force Characteristics—2022,” U.S. Department of Labor, News Release, May 18, 2023.
4. Bureau of Labor Statistics, “Foreign Born Workers: Labor Force Characteristics—2022,” U.S. Department of Labor, News Release, May 18, 2023.
5. Julia Gelatt, “Immigrant Workers: Vital to the U.S. COVID-19 Response, Disproportionately Vulnerable,” Fact Sheet, Migration Policy Institute, March 2020.
6. David Dyssegaard Kallick and Anthony Capote, Immigrants in the U.S. Economy: Overcoming Hurdles, Yet Still Facing Barriers, Immigration Research Initiative, May 1, 2023.
7. David Dyssegaard Kallick and Anthony Capote, Immigrants in the U.S. Economy: Overcoming Hurdles, Yet Still Facing Barriers, Immigration Research Initiative, May 1, 2023.
8. Abby Budiman, “Key Findings About U.S. Immigrants,” Fact Tank (Pew Research Center), Aug. 20, 2020.
9. Center for Migration Studies, “Estimates of Undocumented and Eligible-to-Naturalize Populations by State,” State and National Data Tool, accessed May 27, 2023.
10. Annette Bernhardt et al., Broken Laws, Unprotected Workers: Violations of Employment and Labor Laws in America’s Cities, Center for Urban Economic Development, National Employment Law Project, and UCLA Institute for Research on Labor and Employment, 2009.
11. Author’s analysis of EAD data from USCIS, from I-765 forms. The 1.8 million total includes EAD approvals for 2021 and 2022, because EADs are often valid for two years, or 18 months for TPS grantees, and include the EAD eligibility categories of A054, Granted Asylum Sec. 208; A124, Granted TPS; C085, Applicant for Asylum/Pending Asylum App; C11,Parolee Sec. 212.5/Public Interest; C19, Prima Facie Eligibility For TPS; and C33, Deferred Action for Childhood Arrivals.
12. Daniel Costa, Temporary Work Visa Programs and the Need for Reform: A Briefing on Program Frameworks, Policy Issues and Fixes, and the Impact of COVID-19, Economic Policy Institute, February 3, 2021.
13. Author’s analysis of Office of Foreign Labor Certification, “H-2B Temporary Non-Agricultural Program – Selected Statistics, Fiscal Year (FY 2022),” Employment and Training Administration, U.S. Department of Labor.
14. Migration that Works coalition, Shining A Light on Summer Work: A First Look at the Employers Using the J-1 Summer Work Travel Visa, July 30, 2019. (The Migration that Works coalition was formerly known as the International Labor Recruitment Working Group (ILRWG)).
15. Victor Salandini, “The political-economic dynamics of California’s farm labor market-a highly specific model of international factor flows,” Journal of Behavioral Economics, Volume 2, 1973, Pages 144-246.
16. See for example, Daniel Costa and Philip Martin, “OECD highlights temporary labor migration: Almost as many guestworkers as permanent immigrants,” Working Economics blog (Economic Policy Institute), December 4, 2019; Anna Boucher and Justin Gest, Crossroads: Comparative Immigration Regimes in a World of Demographic Change, Cambridge University Press, 2018.
17. See, for example, Sankar Mukhopadhyay and David Oxborrow, “The Value of an Employment-Based Green Card,” Demography 49 (February 2012): 219–237, https://doi.org/10.1007/s13524-011-0079-3; Manuel Pastor and Justin Scoggins, Citizen Gain: The Economic Benefits of Naturalization for Immigrants and the Economy, Center for the Study of Immigrant Integration, University of Southern California, December 2012; Heidi Shierholz, The effects of citizenship on family income and poverty, Economic Policy Institute, February 24, 2010.
18. The origin of the phrase is unknown but it has been used regularly in the context of economic and fiscal policy debates, including by Dr. Martin Luther King, Jr. See, for example, Jon Wiener, “Martin Luther King’s Final Year: An Interview with Tavis Smiley,” The Nation, January 18, 2016; Rev. Dr. William J. Barber II, “Every budget is a moral document,” Twitter, @RevDrBarber, April 27, 2017, 2:37 p.m.; Scott Wong, “Begich: Budget ‘a Moral Document’,” Politico, April 11, 2011; and Dylan Matthews, “Budgets Are Moral Documents, and Trump’s Is a Moral Failure,” Vox, March 16, 2017.
19. Doris Meissner, Donald M. Kerwin, Muzaffar Chishti, and Claire Bergeron, Immigration Enforcement in the United States: The Rise of a Formidable Machinery, Migration Policy Institute, January 2013; Julia Preston, “Huge Amounts Spent on Immigration, Study Finds,” New York Times, January 7, 2013.
20. Doris Meissner and Julia Gelatt, Eight Key U.S. Immigration Policy Issues: State of Play and Unanswered Questions, Migration Policy Institute, May 2019.
21. See U.S. Department of Justice, “Summary of Budget Authority by Appropriation, Fiscal Year 2020–2022;” U.S. Department of Homeland Security, U.S. Secret Service: Budget Overview, Fiscal Year 2023, Congressional Justification, U.S. Secret Service.
22. Author’s analysis of data on the size of the labor force and establishments from Bureau of Labor Statistics, U.S. Department of Labor, Quarterly Census of Employment and Wages (QCEW), accessed October 1, 2022. Data on the number of workers represent QCEW data on the total number of employees covered by unemployment insurance programs, which is used as a proxy for the number of workers covered by labor standards enforcement agencies.
23. Kate Hamaji et al., Unchecked Corporate Power: Forced Arbitration, the Enforcement Crisis, and How Workers Are Fighting Back, Economic Policy Institute, May 2019.
24. See Economic Policy Institute, “Unequal Power Project” and “Not So Free to Contract: The Law, Philosophy, and Economics of Unequal Workplace Power,” Journal of Law and Political Economy3, Issue 1, 2022.
25. The New York Times Editorial Board, “Trump’s War on Worker Rights,” New York Times, June 3, 2019.
26. Daniel Costa, Employers Increase Their Profits and Put Downward Pressure On Wages and Labor Standards by Exploiting Migrant Workers, Economic Policy Institute, August 27, 2019.
27. Annette Bernhardt et al., Broken Laws, Unprotected Workers: Violations of Employment and Labor Laws in America’s Cities, Center for Urban Economic Development, National Employment Law Project, and UCLA Institute for Research on Labor and Employment, 2009.
28. Jeffrey Passel and D’Vera Cohn, “Mexicans Decline to Less Than Half the U.S. Unauthorized Immigrant Population for the First Time,” Pew Research Center, June 12, 2019.
29. Daniel Costa, Temporary Work Visa Programs and the Need for Reform: A Briefing on Program Frameworks, Policy Issues and Fixes, and the Impact of COVID-19, Economic Policy Institute, February 3, 2021.
30. Daniel Costa, Temporary Work Visa Programs and the Need for Reform: A Briefing on Program Frameworks, Policy Issues and Fixes, and the Impact of COVID-19, Economic Policy Institute, February 3, 2021.
31. Daniel Costa, “The farmworker wage gap continued in 2020: Farmworkers and H-2A workers earned very low wages during the pandemic, even compared with other low-wage workers,” Working Economics blog (Economic Policy Institute ), July 20, 2021; Bureau of Labor Statistics, Injuries, Illnesses, and Fatalities, “Table 1. Incidence Rates of Nonfatal Occupational Injuries and Illnesses by Industry and Case Types, 2019” [online table]. Accessed October 2020.
32. Quarterly Census of Employment and Wages, QCEW Searchable Databases [databases], Bureau of Labor Statistics.
33. Quarterly Census of Employment and Wages, “Table A. Coverage Exclusions in 2021, for Selected Workers” [online table], Bureau of Labor Statistics.
34. National Agricultural Statistics Survey, 2017 Census of Agriculture, U.S. Department of Agriculture, issued April 2019.
35. Rural Migration News, “Hired Farm Work Force Reports, 1945–87,” University of California, Davis, July 10, 2020.
36. National Agricultural Workers Survey, Data Tables for 2019-2020, Employment and Training Administration, U.S. Department of Labor.
37. Annette Bernhardt, Ruth Milkman, et al., Broken Laws, Unprotected Workers: Violations of Employment and Labor Laws in America’s Cities, Center for Urban Economic Development, National Employment Law Project, and UCLA Institute for Research on Labor and Employment, September 2009; Lauren Apgar, Authorized Status, Limited Returns: The Labor Market Outcomes of Temporary Mexican Workers, Economic Policy Institute, May 21, 2015.
38. Wage and Hour Division, U.S. Department of Labor, Laws Administered and Enforced (last accessed July 17, 2020).
39. See for example, Daniel Costa and David Kallick, “Victory on overtime for New York farmworkers,” Working Economics blog (Economic Policy Institute), October 28, 2022.
40. Daniel Costa, Philip Martin, and Zachariah Rutledge, Federal labor standards enforcement in agriculture: Data reveal the biggest violators and raise new questions about how to improve and target efforts to protect farmworkers, Economic Policy Institute, December 15, 2020.
41. National Agricultural Statistics Service, 2017 Census of Agriculture, U.S. Department of Agriculture; and see discussion in Rural Migration News, “COA Farm Labor Expenditures 2017,” University of California, Davis, September 9, 2019.
42. Bureau of Labor Statistics, Quarterly Census of Employment and Wages, QCEW Searchable Databases [databases], Series Id: ENUUS00020511, Series Title: Number of Establishments in Private NAICS 11 Agriculture, forestry, fishing and hunting for All establishment sizes in U.S. TOTAL, NSA, NAICS 11 Agriculture, forestry, fishing and hunting, Owner: Private, All establishment sizes, U.S. Department of Labor, accessed May 2023.
43. This number is derived by taking the number of WHD inspections of agricultural employers in fiscal year 2022 (879) and dividing by the QCEW number of agricultural establishments in the United States. The QCEW data include workers hired directly by farmers and those brought to farms by labor contractors and other nonfarm employers; the 513,000 number reported in the COA includes only farms that hire workers directly; almost 196,000 farms, often many of the same farms that reported direct-hire labor expenses, reported expenses for contract labor. Also, it is important to note that since the QCEW’s number of agricultural establishments includes only those required to register and pay unemployment insurance taxes, it only represents only one-fifth of the farms with labor expenses in the COA, so the true probability that a farm will be investigated in any given year is likely less than 0.7%. Rural Migration News, “COA Farm Labor Expenditures 2017,” University of California, Davis, September 9, 2019.
44. Daniel Costa, Philip Martin, and Zachariah Rutledge, Federal Labor Standards Enforcement in Agriculture: Data Reveal the Biggest Violators and Raise New Questions About How to Improve and Target Efforts to Protect Farmworkers, Economic Policy Institute, December 2020.
45. Daniel Costa, Philip Martin, and Zachariah Rutledge, Federal Labor Standards Enforcement in Agriculture: Data Reveal the Biggest Violators and Raise New Questions About How to Improve and Target Efforts to Protect Farmworkers, Economic Policy Institute, December 2020.
46. For background on WHD’s mandate and the number of workers protected by laws WHD enforces, see Wage and Hour Division, “About the Wage and Hour Division,” fact sheet, U.S. Department of Labor.
47. Daniel Costa, Threatening migrants and shortchanging workers: Immigration is the government’s top federal law enforcement priority, while labor standards enforcement agencies are starved for funding and too understaffed to adequately protect workers, Economic Policy Institute, December 15, 2022.
48. To derive this estimate, the number of covered workers in 1973 and 2022 were divided by the number of WHD investigators in those years. The number of covered workers is derived from the annual averages reported for the total civilian labor force, Bureau of Labor Statistics, Labor Force Statistics from the Current Population Survey, Series Id: LNU01000000, Not Seasonally Adjusted, Series title: (Unadj) Civilian Labor Force Level, ages 16 and over [data tables], U.S. Department of Labor.
49. Rebecca Rainey, “Wage Division Enforcement Declines Again in Wake of Hiring Woes,” Bloomberg Law, December 28, 2022.
50. Rural Migration News, “California: FLC Employment Down and Wages Up in 2020,” University of California, Davis, July 16, 2021.
51. In our 2020 report, we analyzed the data in those tables for the 2000-19 period in more detail. See Daniel Costa, Philip Martin, and Zachariah Rutledge, Federal Labor Standards Enforcement in Agriculture: Data Reveal the Biggest Violators and Raise New Questions About How to Improve and Target Efforts to Protect Farmworkers, Economic Policy Institute, December 2020.
52. Wage and Hour Division, “Agriculture” [data tables], U.S. Department of Labor, accessed March 2023.
53. Theodoric Meyer, “An exit interview with Labor Secretary Marty Walsh,” Washington Post, March 3, 2023.
54. U.S. Department of Labor, FY 2024 Department of Labor Budget in Brief, accessed April 2023, citing budget tables for Wage and Hour Division.
55. See for example, Wage and Hour Division, “Fact Sheet #35: Joint Employment and Independent Contractors Under the Migrant and Seasonal Agricultural Worker Protection Act,” U.S. Department of Labor, revised January 2020.
56. See for example, Wage and Hour Division, “Fact Sheet #80: The Prohibition against Shipment of “Hot Goods” Under the Fair Labor Standards Act,” U.S. Department of Labor, October 2014.
57. David Weil, “Testimony of Dr. David Weil, Wage and Hour Administrator, Wage and Hour Division, U.S. Department of Labor, Before the Subcommittee on Horticulture, Research, Biotechnology, and Foreign Agriculture, Committee on Agriculture,” U.S. House of Representatives, July 30, 2014.
58. Philip Martin, The Prosperity Paradox: Fewer and More Vulnerable Farm Workers, Oxford University Press, January 9, 2021.
59. Authors’ rough estimate taking the reported 63% of non-H-2A crop farmworkers who are born in Mexico as reported in the National Agricultural Workers Survey combined with 93% of the 300,000 H-2A farmworkers who are Mexican nationals as reported by the State Department. See Amanda Gold, Wenson Fung, Susan Gabbard, and Daniel Carroll, Findings from the National Agricultural Workers Survey (NAWS) 2019–2020: A Demographic and Employment Profile of United States Farmworkers, prepared for the Employment and Training Administration, U.S. Department of Labor, January 2022; and Bureau of Consular Affairs, Nonimmigrant Visa Statistics [data tables], U.S. Department of State, last accessed May 2023.
60. Estimate of farmworkers born in Central America as reported in Amanda Gold, Wenson Fung, Susan Gabbard, and Daniel Carroll, Findings from the National Agricultural Workers Survey (NAWS) 2019–2020: A Demographic and Employment Profile of United States Farmworkers, prepared for the Employment and Training Administration, U.S. Department of Labor, January 2022.
61. See Department of Homeland Security, “DHS Announces Process Enhancements for Supporting Labor Enforcement Investigations,” Press Release, January 13, 2023; Daniel Costa, “The Department of Homeland Security took a positive step by clarifying and streamlining the process to protect migrant workers in labor disputes,” Working Economics blog (Economic Policy Institute), January 13, 2023.
62. Daniel Costa, Philip Martin, and Zachariah Rutledge, Federal Labor Standards Enforcement in Agriculture: Data Reveal the Biggest Violators and Raise New Questions About How to Improve and Target Efforts to Protect Farmworkers, Economic Policy Institute, December 2020.
63. Daniel Costa, Philip Martin, and Zachariah Rutledge, Federal labor standards enforcement in agriculture: Data reveal the biggest violators and raise new questions about how to improve and target efforts to protect farmworkers, Economic Policy Institute, December 15, 2020.
64. See for example, discussion of a similar proposal for a front-end screening process of employers in the H-2B visa program in Daniel Costa, As the H-2B visa program grows, the need for reforms that protect workers is greater than ever: Employers stole $1.8 billion from workers in the industries that employed most H-2B workers over the past two decades, Economic Policy Institute, August 18, 2022
65. See National Agricultural Statistics Service, “Surveys,” for more background and to access Farm Labor Reports, U.S. Department of Agriculture.
66. See Employment and Training Administration, “Adverse Effect Wage Rates,” U.S. Department of Labor, accessed May 27, 2023.
67. National Agricultural Statistics Service, Farm Labor [survey and report], United States Department of Agriculture, see various years.
68. Author’s analysis using U.S. Bureau of Labor Statistics “CPI Inflation Calculator,” adjusting the value of the 2021 average wage from November 2021 to the value in November 2022. November was used because the average annual farmworker wages are published in November of each year.
69. Economic Research Service, “Wages of Hired Farmworkers,” in Farm Labor, U.S. Department of Agriculture, last updated March 22, 2033.
70. Economic Research Service, “Wages of Hired Farmworkers,” in Farm Labor, U.S. Department of Agriculture, last updated March 22, 2033.
71. JBS International, Findings from the National Agricultural Workers Survey (NAWS) 2019-2020: A Demographic and Employment Profile of United States Farmworkers. Research Report No. 16. January 2022, Employment and Training Administration, U.S. Department of Labor.
72. Daniel Costa and Philip Martin, “How much would it cost consumers to give farmworkers a significant raise? A 40% increase in pay would cost just $25 per household,” Working Economics blog (Economic Policy Institute), October 15, 2020.
73. Veronica Nigh, “AEWR Methodology Change a Blow to Growers,” Market Intel, American Farm Bureau, March 30, 2023; American Hort, “Why You Can Expect Steep H-2A Wage Increases in 2022,” Greenhouse Grower, December 11, 2021.
74. Comments of Craig Regelbrugge in American Hort, “Why You Can Expect Steep H-2A Wage Increases in 2022,” Greenhouse Grower, December 11, 2021.
75. Author’s analysis of Adverse Effect Wage Rates for 2021 and 2022 for the listed states; AEWRs are from the Employment and Training Administration, U.S. Department of Labor. All values have been adjusted to constant 2022 dollars using the Consumer Price Index (CPI-U). Tables on file with the author, to be published in a forthcoming report.
76. 86 Fed. Reg. 68185.
77. 86 Fed. Reg. 68185, citing Economic Research Service, Farm Labor, U.S. Department of Agriculture, last modified Aug. 18, 2021, at footnote 70.
78. 86 Fed. Reg. 68185, citing 80 Fed. Reg 24146, 24158-24159 at footnote 73.
79. 8 U.S.C §1188.
80. Comment submitted to the proposed rule by Robert Roy, President and General Counsel for the National Council of Agricultural Employers, January 25, 2022.
81. Philip Martin, Brandon Hooker, Muhammad Akhtar, Marc Stockton, How many workers are employed in California agriculture? California Agriculture, Volume 71, number 1, pages 30-34, August 23, 2016.
82. Philip Martin and Daniel Costa, “Farmworker wages in California: Large gap between full-time equivalent and actual earnings,” Working Economics blog (Economic Policy Institute), March 21, 2017.
83. See for example Philip Martin, “The H-2A farm guestworker program is expanding rapidly: Here are the numbers you need to know,” Working Economics blog (Economic Policy Institute), April 13, 2017.
84. Katie Reilly, “‘I work 3 jobs and donate blood plasma to pay the bills.’ This is what it’s like to be a teacher in America,” Time, September 13, 2018.
85. Sylvia A. Allegretto and Lawrence Mishel, Teacher pay penalty dips but persists in 2019: Public school teachers earn about 20% less in weekly wages than nonteacher college graduates, Economic Policy Institute, September 17, 2020.
86. Employment and Training Association, Adverse Effect Wage Rate Methodology for the Temporary Employment of H-2A Nonimmigrants in Non-Range Occupations in the United States, U.S. Department of Labor, Final Rule, 88 Fed. Reg. 12670 (February 28, 2023).
87. See the Senate and House versions respectively on Congress.gov at S.J.Res. 25 and H.J.Res.59.
88. For more background, see Congressional Research Service, “The Congressional Review Act (CRA): A Brief Overview,” In Focus, updated February 27, 2023.
89. Some of these jobs arguably should not be certified by the Office of Foreign Labor Certification because they fall outside the scope of the H-2A program.
90. Employment and Training Association, Adverse Effect Wage Rate Methodology for the Temporary Employment of H-2A Nonimmigrants in Non-Range Occupations in the United States, U.S. Department of Labor, Final Rule, 88 Fed. Reg. 12670 (February 28, 2023).
91. Economic Research Service, “Farm Sector Income & Finances: Highlights from the Farm Income Forecast,” February 7, 2023.
92. Economic Research Service, “Production expenses by category, 2014-2023F” [data tables], accessed May 27, 2023.
93. The actual amount of the H-2A farmworker pay cut in 2023 estimated by DOL will be $14.57 million because the AEWR methodology will only be in place for half of the year, and 2024 will be $30.98 million, but the ten-year average of $38 million has been used in this example for consistency.
94. Economic Research Service, “Farm Sector Income & Finances: Highlights from the Farm Income Forecast,” February 7, 2023.
95. Donald J. Trump, “Proclamation on Declaring a National Emergency Concerning the Novel Coronavirus Disease (COVID-19) Outbreak,” (presidential proclamation), March 13, 2020.
96. For the most part, these terms are interchangeable, and no one term is definitive or has been agreed to.
97. See discussion of the average maximum allowed duration of stay of temporary visa holders across Organisation for Economic Co-operation and Development countries in Daniel Costa and Philip Martin, “OECD Highlights Temporary Labor Migration: Almost as Many Guestworkers as Permanent Immigrants,” Working Economics blog (Economic Policy Institute), Dec. 4, 2019.
98. Daniel Costa and Philip Martin, Temporary Labor Migration Programs: Governance, Migrant Worker Rights, and Recommendations for the U.N. Global Compact for Migration, Economic Policy Institute, Aug. 1, 2018.
99. Jill H. Wilson, Immigration: Nonimmigrant (Temporary) Admissions to the United States, Congressional Research Service, updated Sept. 10, 2019.
100. For example, cap-exempt H-1Bs are available if an employer is a university, a university-affiliated nonprofit entity, or a nonprofit research organization.
101. Abby Budiman, “Key Findings About U.S. Immigrants,” Fact Tank (Pew Research Center), Aug. 20, 2020.
102. Previous estimates include Costa and Rosenbaum, who estimated that approximately 1.4 million temporary migrant workers were employed in the United States in 2013 through temporary work visa programs, accounting for roughly 1% of the labor force at the time, and the Organisation for Economic Co-operation and Development, which estimated in 2019 that there were 1.6 million full-time-equivalent jobs filled by migrants with temporary visas in 2017, also accounting for 1% of the labor force. Daniel Costa and Jennifer Rosenbaum, Temporary Foreign Workers by the Numbers: New Estimates by Visa Classification, Economic Policy Institute, March 7, 2017; Organisation for Economic Co-operation and Development, International Migration Outlook 2019, Oct. 15, 2019.
103. See more extensive discussion in Daniel Costa, Temporary work visa programs and the need for reform: A briefing on program frameworks, policy issues and fixes, and the impact of COVID-19, Economic Policy Institute, February 3, 2021.
104. See more extensive discussion in Daniel Costa, Temporary work visa programs and the need for reform: A briefing on program frameworks, policy issues and fixes, and the impact of COVID-19, Economic Policy Institute, February 3, 2021.
105. See Daniel Costa and Jennifer Rosenbaum, Temporary Foreign Workers by the Numbers: New Estimates by Visa Classification, Economic Policy Institute, March 7, 2017. The updated methodology includes visa classifications that authorize employment but were not included in the previous estimate and uses additional data sources for B-1, E-2, H-1B, and J-1 visas.
106. The data in Figure A do not represent the total population of temporary migrant workers or those with EB green cards who are currently authorized to be employed or who were authorized to be employed at a particular point in time—they only represent new visas issued in each year.
107. For a more in-depth discussion of these data, see Daniel Costa, “Temporary Migrant Workers or Immigrants? The Question for U.S. Labor Migration,” Russell Sage Foundation Journal of the Social Sciences 6, no. 3 (2020), https://doi.org/10.7758/RSF.2020.6.3.02.
108. See for example, Walter Ewing, “The Biden Administration Let Over 200,000 Green Cards Go to Waste This Year,” Immigration Impact (American Immigration Council blog), October 5, 2021; Andrew Kreighbaum, “Immigration Agency Races to Issue 280,000 Available Green Cards,” Bloomberg Law, July 8, 2022.
109. See for example, Migration Policy Institute, “U.S. Refugee Admissions & Refugee Resettlement Ceilings, FY 1980-2023 YTD*” [data tool; accessed May 27, 2023].
110. Centro de los Derechos del Migrante, Recruitment Revealed: Fundamental Flaws in the H-2 Temporary Worker Program and Recommendations for Change, n.d., accessed December 10, 2020.
111. United Nations Office of the High Commissioner for Human Rights, “End of Visit Statement, United States of America (6–16 December 2016) by Maria Grazia Giammarinaro, UN Special Rapporteur in Trafficking in Persons, Especially Women and Children,” Washington, D.C., Dec. 19, 2016. See also United Nations Office of the High Commissioner for Human Rights, “Debt Bondage Remains the Most Prevalent Form of Forced Labour Worldwide—New UN Report” (press release), Sept. 15, 2016; United Nations Human Rights Council, Report of the Special Rapporteur on Contemporary Forms of Slavery, Including Its Causes and Consequences, Thirty-third session, Agenda item 3, Promotion and protection of all human rights, civil, political, economic, social and cultural rights, including the right to development, July 4, 2016, accessed via the United Nations Official Document System (to access this report, open the Official Document System and then click this link while you have the Official Document System open); United Nations Office on Drugs and Crime, The Role of Recruitment Fees and Abusive and Fraudulent Practices of Recruitment Agencies in Trafficking in Persons, 2015.
112. Michael Grabell, “Who Would Pay $26,000 to Work in a Chicken Plant?” ProPublica, Dec. 28, 2017.
113. Steven Greenhouse, “Low Pay and Broken Promises Greet Guest Workers,” New York Times, Feb. 28, 2007.
114. Liam Stack, “Indian Guest Workers Awarded $14 Million,” New York Times, Feb. 18, 2015; Jessica Garrison, Ken Bensinger, and Jeremy Singer-Vine, “The New American Slavery: Invited to the U.S., Foreign Workers Find a Nightmare,” BuzzFeed News, July 24, 2015; U.S. Department of Justice, “Miami Beach Sex Trafficker Sentenced to 30 Years in Prison for International Trafficking Scheme Targeting Foreign University Students” (press release), U.S. Attorney’s Office, Southern District of Florida, March 24, 2017; Holbrook Mohr, Mitch Weiss, and Mike Baker, “AP Impact: US Fails to Tackle Student Abuses,” Associated Press, Dec. 6, 2010; last updated Nov. 21, 2015.
115. Matt Smith, Jennifer Gollan, and Adithya Sambamurthy, “Job Brokers Steal Wages, Entrap Indian Tech Workers in US,” Reveal News, Oct. 27, 2014; Farah Stockman, “Teacher Trafficking: The Strange Saga of Filipino Workers, American Schools, and H-1B Visas,” Boston Globe, June 12, 2013; Tom McGhee, “Kizzy Kalu Lured Nurses to U.S. with Promises of High Pay, Prosecutors Say,” Denver Post, June 4, 2013.
116. See, for example, Mary Bauer and Meredith Stewart, Close to Slavery: Guestworker Programs in the United States, Southern Poverty Law Center, Feb. 19, 2013; International Labor Recruitment Working Group, The American Dream Up for Sale: A Blueprint for Ending International Labor Recruitment Abuse, February 2013.
117. See, for example, Justice in Motion, Visa Pages: U.S. Temporary Foreign Worker Visas, H-2A Agricultural Work Visa, updated November 2015; U.S. Citizenship and Immigration Services, “Buy American and Hire American: Putting American Workers First” (data resources), 2020.
118. See, for example, Jobofer.org.
119. See, for example, Christopher Lapinig, “How U.S. Immigration Law Enables Modern Slavery,” The Atlantic, June 7, 2017.
120. See, for example, Mary Bauer and Meredith Stewart, Close to Slavery: Guestworker Programs in the United States, Southern Poverty Law Center, Feb. 19, 2013.
121. Mary Bauer and Meredith Stewart, Close to Slavery: Guestworker Programs in the United States, Southern Poverty Law Center, Feb. 19, 2013; Jessica Garrison, Ken Bensinger, and Jeremy Singer-Vine, “The New American Slavery: Invited to the U.S., Foreign Workers Find a Nightmare,” BuzzFeed News, July 24, 2015; U.S. Government Accountability Office, H-2A and H-2B Visa Programs: Increased Protections Needed for Foreign Workers, GAO-15-154, reissued May 30, 2017.
122. Nikhil Swaminathan, “Inside the Growing Guest Worker Program Trapping Indian Students in Virtual Servitude,” Mother Jones, September/October 2017 issue.
123. Comments of Michael Clemens at “Shared Border, Shared Future: A Blueprint to Regulate US-Mexico Labor Mobility,” an event hosted by the Center for Global Development, Sept. 13, 2016; Alex Nowrasteh, How to Make Guest Worker Visas Work, Cato Institute, Jan. 31, 2013.
124. See for example the Economic Policy Institute’s Unequal Power project, started in 2020, and see also, Economic Policy Institute, “Ability to quit does not prevent employer exploitation,” virtual event on June 22, 2022.
125. Daniel Costa, The H-2B Temporary Foreign Worker Program: For Labor Shortages or Cheap, Temporary Labor?, Economic Policy Institute, Jan. 19, 2016; Ron Hira, “New Data Show How Firms Like Infosys and Tata Abuse the H-1B Program,” Working Economics blog (Economic Policy Institute), Feb. 19, 2015; Daniel Costa, “H-2B Crabpickers Are So Important to the Maryland Seafood Industry That They Get Paid $3 Less Per Hour Than the State or Local Average Wage,” Working Economics blog (Economic Policy Institute), May 26, 2017.
126. Daniel Costa and Ron Hira, H-1B Visas and Prevailing Wage Levels: A Majority of H-1B Employers—Including Major U.S. Tech Firms—Use the Program to Pay Migrant Workers Well Below Market Wages, Economic Policy Institute, May 4, 2020.
127. Daniel Costa and Ron Hira, New evidence of widespread wage theft in the H-1B visa program: Corporate document reveals how tech firms ignore the law and systematically rob migrant workers, Economic Policy Institute, December 9, 2021.
128. Monte Francis, “Fremont Tech Company Paid Workers $1.21 an Hour: U.S. Dept. of Labor,” NBC Bay Area, Oct. 22, 2014. See also George Avalos, “Workers Paid $1.21 an Hour to Install Fremont Tech Company’s Computers,” Mercury News, Oct. 22, 2014; updated Aug. 12, 2016. L-1 visa status confirmed in an email from George Avalos of Mercury News, Oct. 23, 2014.
129. Author’s analysis of historical data from Foreign Labor Certification Data Center, Online Wage Library, “7/2013 – 6/2014 FLC Wage Data,” https://flcdatacenter.com/Download.aspx, for Standard Occupational Classification codes 15-1142 and 49-2011, for region 36084, Oakland-Fremont-Hayward, CA Metropolitan Division (2013–2014).
130. U.S. Department of Labor, Wage and Hour Division, “US Department of Labor Investigation Finds Silicon Valley Technology Employer Owed More Than $40,000 to Foreign Workers” (press release no. 14-1717-SAN [SF-71]), Oct. 22, 2014, accessed Aug. 27, 2019.
131. Lauren A. Apgar, Authorized Status, Limited Returns: The Labor Market Outcomes of Temporary Mexican Workers, Economic Policy Institute, May 21, 2015.
132. Bivens and Shierholz broadly define “monopsony power” as “the leverage enjoyed by employers to set their workers’ pay.” See Josh Bivens and Heidi Shierholz, What Labor Market Changes Have Generated Inequality and Wage Suppression?: Employer Power Is Significant but Largely Constant, Whereas Workers’ Power Has Been Eroded by Policy Actions, Economic Policy Institute, Dec. 12, 2018.
133. Eric M. Gibbons et al., “Monopsony Power and Guest Worker Programs,” IZA Institute of Labor Economics, Discussion Paper no. 12096, January 2019.
134. Ken Bensinger, Jessica Garrison, and Jeremy Singer-Vine, “Employers Abuse Foreign Workers. U.S. Says, by All Means, Hire More,” BuzzFeed News, May 12, 2016.
135. Ihna Mangundayao, Celine McNicholas, and Margaret Poydock, “Worker protection agencies need more funding to enforce labor laws and protect workers,” Working Economics blog (Economic Policy Institute), July 29, 2021.
136. Daniel Costa, Threatening migrants and shortchanging workers: Immigration is the government’s top federal law enforcement priority, while labor standards enforcement agencies are starved for funding and too understaffed to adequately protect workers, Economic Policy Institute, December 15, 2022.
137. See, for example, Sankar Mukhopadhyay and David Oxborrow, “The Value of an Employment-Based Green Card,” Demography 49 (February 2012): 219–237, https://doi.org/10.1007/s13524-011-0079-3; Manuel Pastor and Justin Scoggins, Citizen Gain: The Economic Benefits of Naturalization for Immigrants and the Economy, Center for the Study of Immigrant Integration, University of Southern California, December 2012.
138. William Kandel, The Employment-Based Immigration Backlog, Congressional Research Service, R46291, March 26, 2020.
139. Daniel Costa, Temporary work visa programs and the need for reform: A briefing on program frameworks, policy issues and fixes, and the impact of COVID-19, Economic Policy Institute, February 3, 2021.
140. Immigration and Nationality Act of 1952, Section 101(a)(15)(h)(ii).
141. Immigration Reform and Control Act, Section 301(a).
142. Immigration Act of 1990, Section 205(g)(1)(B).
143. Rural Migration News, “The H-2A Program in 2022,” University of California, Davis, May 16, 2022.
144. Andorra Bruno, The H-2B Visa and the Statutory Cap, Congressional Research Service, R44306, updated February 28, 2020.
145. For a more complete discussion of the data cited here, see Daniel Costa, As the H-2B visa program grows, the need for reforms that protect workers is greater than ever: Employers stole $1.8 billion from workers in the industries that employed most H-2B workers over the past two decades, Economic Policy Institute, August 18, 2022.
146. Office of Foreign Labor Certification, “H-2B Temporary Non-Agricultural Program – Selected Statistics, Fiscal Year (FY) 2021 EOY,” Employment and Training Administration, U.S. Department of Labor; and USCIS, H-2B Employer Data Hub, U.S. Department of Homeland Security.
147. To the extent that the N/A occupations fall within the seven industries, the actual share could be as high as 99.1%.
148. Wage and Hour Division, “Industries with High Prevalence of H-2B Workers: FY2000–FY2021” [data tables], U.S. Department of Labor.
149. See, for example, Table 1 in Daniel Costa, “Wages Are Still Too Low in H-2B Occupations: Updated Wage Rules Could Ensure Labor Standards Are Protected and Migrants Are Paid Fairly,” Working Economics blog (Economic Policy Institute), March 18, 2021.
150. See, for example, Laura Huizar, Exposing Wage Theft Without Fear: States Must Protect Workers from Retaliation, National Employment Law Project, June 2019; and Susan Ferriss and Joe Yerardi, “As Guest Workers Increase, So Do concerns About Wage Cheating,” The Center for Public Integrity, March 2, 2022.
151. See, for example, Ihna Mangundayao, Celine McNicholas, and Margaret Poydock, “Worker Protection Agencies Need More Funding to Enforce Labor Laws and Protect Workers,” Working Economics blog (Economic Policy Institute), July 29, 2021; and section on WHD funding and enforcement in Daniel Costa, Philip Martin, and Zachariah Rutledge, Federal Labor Standards Enforcement in Agriculture: Data Reveal the Biggest Violators and Raise New Questions About How to Improve and Target Efforts to Protect Farmworkers, Economic Policy Institute, December 15, 2020.
152. Polaris, Labor Trafficking on Specific Temporary Work Visas: A Data Analysis 2018-2020, July 2022.
153. Polaris, Labor Trafficking on Specific Temporary Work Visas: A Data Analysis 2018-2020, July 2022.
154. Colleen Owens, Meredith Dank, et al., Understanding the Organization, Operation, and Victimization Process of Labor Trafficking in the United States, Urban Institute, October 2014.
155. U.S. Government Accountability Office, “What GAO Does.”
156. U.S. Government Accountability Office, H-2A and H-2B Visa Programs: Increased Protections Needed for Foreign Workers, GAO-15-154, reissued May 30, 2017.
157. U.S. Government Accountability Office, H-2A and H-2B Visa Programs: Increased Protections Needed for Foreign Workers, GAO-15-154, reissued May 30, 2017.
158. Drew Favakeh, “Operation Blooming Onion: Federal indictment reveals ‘modern-day-slavery’ in Georgia,” Savannah Morning News, December 1, 2021.
159. Drew Favakeh, “Operation Blooming Onion: Federal indictment reveals ‘modern-day-slavery’ in Georgia,” Savannah Morning News, December 1, 2021.
160. See also, for example, Liam Stack, “Indian Guest Workers Awarded $14 Million,” New York Times, Feb. 18, 2015; Jessica Garrison, Ken Bensinger, and Jeremy Singer-Vine, “The New American Slavery: Invited to the U.S., Foreign Workers Find a Nightmare,” BuzzFeed News, July 24, 2015; Meredith Stewart, Culture Shock: The Exploitation of J-1 Cultural Exchange Workers, Southern Poverty Law Center, 2013; Janie Chuang, The U.S. Au Pair Program: Labor Exploitation and the Myth of Cultural Exchange, Harvard Journal of Law and Gender (Vol. 36, 269-343, 2013); U.S. Department of Justice, “Miami Beach Sex Trafficker Sentenced to 30 Years in Prison for International Trafficking Scheme Targeting Foreign University Students” (press release), U.S. Attorney’s Office, Southern District of Florida, March 24, 2017; Holbrook Mohr, Mitch Weiss, and Mike Baker, “AP Impact: US Fails to Tackle Student Abuses,” Associated Press, Dec. 6, 2010; last updated Nov. 21, 2015.
161. Office of Rep. Joaquin Castro, “Congressman Castro introduces H-2B visa reform bill to strengthen protections for seasonal workers,” Press Release, April 22, 2022.
162. Andorra Bruno, The H-2B Visa and the Statutory Cap, Congressional Research Service, R44306, updated February 28, 2020.
163. . For a more detailed explanation, see Andorra Bruno, The H-2B Visa and the Statutory Cap, Congressional Research Service, R44306, updated February 28, 2020.
164. . Daniel Costa, “The substance and impact of the H-2B guestworker program appropriations riders some members of Congress are trying to renew,” Working Economics blog (Economic Policy Institute), June 17, 2016. For more background on employer-provided H-2B wage surveys and how they are used to pay H-2B workers lower wage rates, see Daniel Costa, “H-2B crabpickers are so important to the Maryland seafood industry that they get paid $3 less per hour than the state or local average wage,” Working Economics blog (Economic Policy Institute), May 26, 2017.
165. . New York Times Editorial Board, “Why Guest Workers Are Easily Exploited,” New York Times, July 1, 2016.
166. . See, for example, Senate Committee on the Judiciary, “Durbin, Grassley Criticize DHS Decision to Expand H-2B Visa Program Without Necessary Reforms,” Press Release, March 31, 2022, and Senators Chuck Grassley and Dianne Feinstein, “Grassley, Feinstein: Process To Change H-2B Program Lacked Transparency,” Press Release, May 1, 2017.
167. Daniel Costa, “The Farm Workforce Modernization Act allows employers to hire migrant farmworkers with H-2A temporary visas for year-round jobs: Impacts are unknown and other wage-setting formulas should be considered,” Working Economics blog (Economic Policy Institute).
168. See for example, Congresswoman Lucille Roybal-Allard, “Appropriations Committee Approves Fiscal Year 2020 Homeland Security Funding Bill,” Press Release, June 11, 2019.
169. See Subtitle F—Prevention of Trafficking in Persons and Abuses Involving Workers Recruited Abroad, in Border Security, Economic Opportunity, and Immigration Modernization Act, S. 744, 113th Cong. (2013). For a summary of the provisions, see Daniel Costa, Future Flows and Worker Rights in S. 744: A Guide to How the Senate Immigration Bill Would Modify Current Law, Economic Policy Institute, November 2013.
170. H-1B and L-1 Visa Reform Act of 2022, S. 3720, 117th Cong. (2021-22).
171. H-1B and L-1 Visa Reform Act of 2022, S. 3720, 117th Cong. (2021-22). See also Rep. Bill Pascrell, “Pascrell, Grassley, Durbin, Gosar, Khanna, Pallone, Gooden Lead Overhaul to H1-B, L-1 Visa Programs: Bipartisan, Bicameral Reforms Will Protect American Workers and Improve Fairness for Skilled Labor Applicants” (press release), May 22, 2020.
172. Sen. Richard Durbin, “Durbin, Colleagues Introduce Legislation To Retain International Graduates With Advanced STEM Degrees,” (press release), February 11, 2022.
173. Office of Rep. Joaquin Castro, “Congressman Castro introduces H-2B visa reform bill to strengthen protections for seasonal workers,” Press Release, April 22, 2022.
174. See, for example, Demetrios G. Papademetriou et al., Aligning Temporary Immigration Visas with U.S. Labor Market Needs: The Case for a New System of Provisional Visas, Migration Policy Institute, July 2009.
175. Daniel Costa, Threatening migrants and shortchanging workers: Immigration is the government’s top federal law enforcement priority, while labor standards enforcement agencies are starved for funding and too understaffed to adequately protect workers, Economic Policy Institute, December 15, 2022; Ihna Mangundayao, Celine McNicholas, and Margaret Poydock, “Worker protection agencies need more funding to enforce labor laws and protect workers,” Working Economics blog (Economic Policy Institute), July 29, 2021.
176. Ken Bensinger, Jessica Garrison, and Jeremy Singer-Vine, “Employers Abuse Foreign Workers. U.S. Says, by All Means, Hire More,” BuzzFeed News, May 12, 2016.
177. Rep Bobby Scott, “Reps. Chu, Scott Re-Introduce POWER Act to Create Safe, Just Workplaces for Every Worker in America,” Press Release, March 28, 2023.
178. National Immigration Law Center, “The POWER Act: Protect Our Workers from Exploitation and Retaliation Act,” last updated November 2019.
179. See discussion of truckloads of paper applications for temporary work visas arriving at USCIS, in Miriam Jordan, “Visa Applications Pour in by Truckload Before Door Slams Shut,” New York Times, April 3, 2017.
180. See, for example, Jeremy McLean, The Case for Transparency: Using Data to Combat Human Trafficking Under Temporary Foreign Worker Visas, Justice in Motion, September 2020.
181. S.3406 – Visa Transparency Anti-Trafficking Act of 2021, 117th Congress (2021-2022); H.R.7056 – Visa Transparency Anti-Trafficking Act of 2021; 117th Congress (2021-2022). For press releases on previous versions ov VTAT, see Rep. Lois Frankel, “Frankel, Deutch, Blumenthal, & Cruz Introduce Bipartisan, Bicameral Bill to Bring Transparency to Temporary Worker Visa Programs & Combat Human Trafficking” (press release), July 23, 2019; Visa Transparency Anti-Trafficking Act of 2019, H.R. 3881, 116th Cong. (2019); Visa Transparency Anti-Trafficking Act of 2019, S. 2224, 116th Cong. (2019).
182. See, for example, Ray Marshall and Ross Eisenbrey, “Commission Needed to Solve Immigration,” The Hill, June 10, 2010.
183. See, for example, Martin Ruhs and Philip Martin, “On Migration, the US Should Copy the UK,” Financial Times, Feb. 18, 2013; Daniel Costa and Philip Martin, Temporary Labor Migration Programs: Governance, Migrant Worker Rights, and Recommendations for the U.N. Global Compact for Migration, Economic Policy Institute, August 1, 2018.
184. See, for example, legislation coauthored and introduced by former Reps. Solomon Ortiz (D-Texas) and Luis Gutierrez (D-Ill.), which had 103 total cosponsors. See Section 501 in the Comprehensive Immigration Reform for America’s Security and Prosperity Act of 2009 (CIR ASAP), H.R. 4321, 111th Cong. (2009). CIR ASAP was later reintroduced in 2013 by Reps. Raul Grijalva (D-Ariz.) and Filemon Vela, Jr. (D-Texas), as the CIR ASAP Act of 2013, H.R. 3163, 113th Cong. (2013).