Full Report
From the end of World War II until the mid-1980s, the Midwest enjoyed relatively low inequality and high worker wages, in large part due to high rates of union membership. The Midwest led the country as a region ripe with high-quality union jobs and pathways into the middle class. Yet this leadership has been challenged by years of relentless attacks on unions, deindustrialization, and the failures of policymakers to prioritize working families’ economic security. In the wake of the Great Recession, austerity—at the federal level and in virtually every state—only exacerbated these dynamics. As a result, the Midwest has endured years of slow wage growth, slow job growth, public-sector employment shortfalls, and declines in unionization.
The federal government’s response to the COVID-19 pandemic was different. By providing strong fiscal relief at the scale of the problem, federal lawmakers protected the country from a protracted recession and provided regional policymakers with the resources to make transformative investments in support of working families.
However, as federal government relief efforts wind down, Midwestern policymakers must take full advantage of an improving economy and new federal resources made possible through recent legislation. They can use these resources to bolster public systems (e.g., education, health care) and rebuild the structures and programs that will create high-quality union jobs in infrastructure, manufacturing, and clean energy technologies.
The Midwest’s story as a place of opportunity for workers building the core products of the U.S. economy need not be lost to the past. Regional lawmakers have a historic opportunity to restore that character, advancing equity and economic opportunity for all who call the region home.
Key findings
- The Midwest has seen an increase in anti-worker policies. Most Midwestern states have implemented policies in the past 15 years that have worsened job quality and reduced economic security for working families, such as limiting worker rights and preempting local governments’ efforts to improve labor standards.
- Racial employment gaps persist. The Midwest remains the region with the nation’s lowest unemployment and highest employment-to-population ratio, but racial employment gaps remain significant.
- The Midwest has failed to recover lost public-sector jobs. As in the rest of the country, regional job growth exiting the pandemic has been strong, yet the Midwest’s public sector has still not recovered the jobs lost at the beginning of the COVID-19 pandemic.
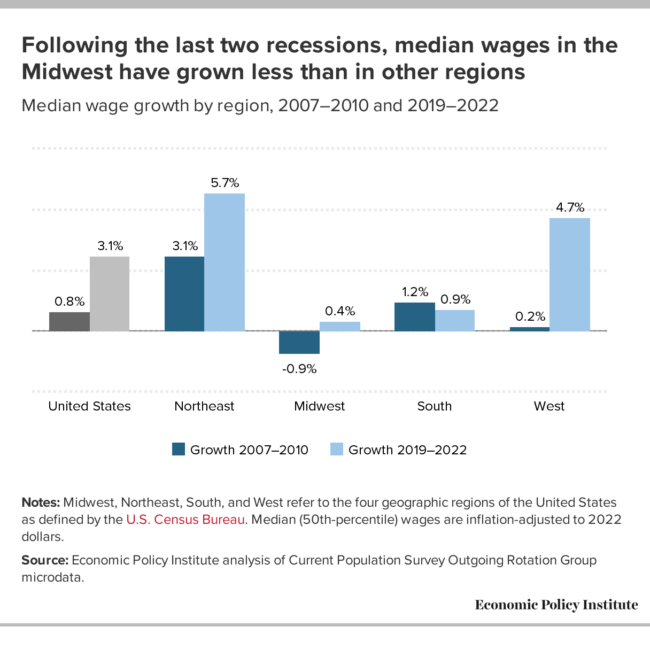
- Wage growth is slow. A significant bright spot of the current recovery nationally and in the Midwest has been the largely unprecedented improvement in wages for the economy’s lowest-paid workers. However, the state of typical worker wages in the Midwest is less encouraging. The Midwest has had the slowest wage growth of any region in the country both during the Great Recession and since the beginning of the pandemic. Between 2019 and 2022, real median wages increased only $0.08 (0.4%) in the Midwest, while the Northeast and West saw increases of more than a dollar (5.7% and 4.7%, respectively). Between 1979 and 2022, the Midwest’s relative median wage—the ratio of the regional median wage to the national median wage—has declined more than any other region’s.
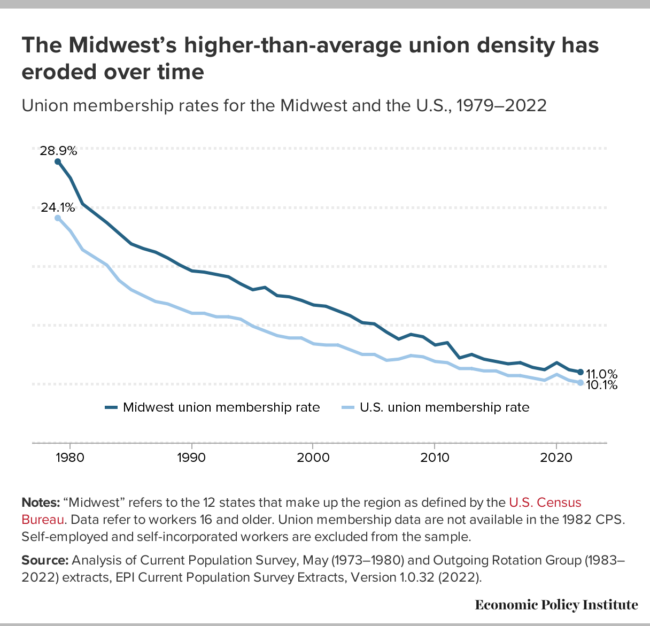
- Union density has declined. Union density has declined in the Midwest more than in any other region since 1979. Declining union density is a contributor to the region’s slow wage growth and growth in inequality. Once a union-dense region, the Midwest today has only one state that ranks in the top 10 for union membership.
- Midwesterners lack access to paid leave. The region lags the rest of the country in the share of private-sector workers with access to paid sick leave as an employee benefit. The Midwest has also been slower than other regions to pass legislation guaranteeing paid sick days to all workers.
- A strong policy response reduced poverty during the pandemic. A weak policy response in the wake of the Great Recession exacerbated poverty, but the strong policy response to the pandemic recession led to a significant drop in poverty rates (as captured by the supplemental poverty measure) in the Midwest and nationwide. Unfortunately, the sunsetting of pandemic relief programs means poverty rates have returned to their previous levels.
- The federal pandemic response shows these trends can be reversed. The federal government’s response to the pandemic demonstrates that, going forward, state policymakers have the opportunity to enact policies that will increase job quality and build racial equity.
Midwestern policymakers have an opportunity to change course to improve the lives of working families in the region
This report closely examines the economy of the Midwest as the nation recovers from the COVID-19 pandemic. The influx of federal funds from the CARES Act, the American Rescue Plan Act (ARPA), and other federal legislation blunted the worst economic effects from COVID, but those supports are now waning. Policymakers across the Midwest have choices to make, choices that will critically shape the economic trajectory for working families in the region going forward.
Midwestern policymakers enacted numerous anti-worker policies in the wake of the Great Recession
The 12 states of the Midwest region1 faced just such a moment of decision over a decade ago. The Midwest entered the Great Recession as a region with (on the whole) high workforce participation, strong public- and private-sector unions, and many dynamic local governments that were supporting strong labor standards and safe workplaces (Pabst 2011; McKinney 2021; Wolfe et al. 2021).
In the wake of the Great Recession, though, right-wing politicians took control in all Midwestern states except Illinois and Minnesota (Tope, Pickett, and Chiricos 2015) and began passing policies that had negative outcomes for workers, especially for Black and brown workers. The majority of Midwestern states embraced fiscal austerity, disinvested in public services, and rolled back workers’ rights. Further, they restricted local governments from (among other things) raising minimum wages, enacting paid leave, or setting high-road labor standards for publicly funded development projects. The predictable outcomes were an increase in inequality, wage stagnation, and worsening racial wage and employment gaps.
Table 1 notes some of the key policy decisions Midwestern states made from the Great Recession through the beginnings of the COVID-19 pandemic.
State policy changes impacting workers in Midwestern states, 2009–2022
| Anti-worker policy changes | Worker-friendly policy changes | |||||
|---|---|---|---|---|---|---|
| State | Passed RTW law | Limited public-sector collective bargaining rights | Preempted local pro-worker laws | Increased state minimum wage | Expanded Medicaid | Expanded collective bargaining rights |
| Illinois | ✓ | ✓ | ✓ | |||
| Indiana | ✓ | ✓ | ✓ | ✓ | ||
| Iowa | * | ✓ | ✓ | ✓ | ||
| Kansas | * | ✓ | ✓ | |||
| Michigan | ✓ | ✓ | ✓ | ✓ | ✓ | |
| Minnesota | ✓ | ✓ | ✓ | |||
| Missouri | ↩ | ✓ | ✓ | ✓ | ✓ | |
| Nebraska | * | ✓ | ✓ | |||
| North Dakota | * | ✓ | ✓ | |||
| Ohio | ↩ | ✓ | ✓ | |||
| South Dakota | * | ✓ | ✓ | ✓ | ||
| Wisconsin | ✓ | ✓ | ✓ | |||

Notes: “Passed RTW law” means the state enacted a so-called right-to-work law. South Dakota adopted Medicaid expansion in 2022, but it was not implemented until mid-2023.
✓ = adopted policy 2009–2022
* = already had policy prior to 2009
↩ = Legislation passed by legislators but overturned by a ballot measure
Sources: Sherer, Why ‘Right-to-Work’ Was Always Wrong for Michigan (EPI, 2023); Morrissey and Sherer, Unions Can Reduce the Public-Sector Pay Gap (EPI, 2022); Wolfe et al., Preempting Progress in the Heartland (EPI, 2021); Economic Policy Institute, Current Population Survey Extracts (2023); Kaiser Family Foundation, Status of State Medicaid Expansion Decisions: Interactive Map (2023); Sherer, Illinois Workers’ Rights Amendment Sets New Bar for State Worker Power Policy (EPI, 2022).
Anti-worker policy changes
RTW laws. So-called right-to-work (RTW) laws limit the power of private-sector unions. RTW laws have been shown to exacerbate income inequality, lower worker wages, and widen racial wage and employment gaps (Sherer 2023).
Five Midwestern states already had RTW laws on the books before the Great Recession; in the 2010s, Indiana, Michigan, and Wisconsin joined them. Missouri also enacted RTW in 2017, but Missouri’s voters overturned that decision in a 2018 ballot measure, with 67% of those voting opposed to RTW (Missouri Secretary of State 2018).
Restrictions on public-sector unions. In addition, eight Midwestern states passed legislation limiting the rights of public employees to organize and collectively bargain. The first of these was passed in a once pro-union state. In 1959, Wisconsin was the first state to grant public employees the right to collectively bargain (Lichtenstein 2002). The passage of Act 10 in March 2011 undermined those rights.
Wisconsin’s Act 10 prohibited negotiations over most workplace issues (such as hours of work, employee discipline, health insurance, and safety) and limited unions’ rights to collect union dues through payroll deduction. It also forced all unions to annually hold a recertification vote to maintain their status as a collective bargaining representative. The law further prevented public employers and unions from agreeing to worker raises above the Consumer Price Index without subjecting it to a voter referendum. The law’s clear purpose was to limit the power of workers, and it resulted in a significant decline in union membership in the state.
Preemption. A third policy enacted by most Midwestern state legislatures was the preemption of local labor standards. Preemption refers to state laws restricting the right of local governments (mostly cities and counties) to enact local ordinances on certain issues. Three particular local government actions were targeted by these preemption laws, which prohibited cities and counties from:
- Setting a minimum wage higher than that of the state. In Kansas City, Missouri, and Milwaukee, Wisconsin, preemption laws forced a reduction in the cities’ existing minimum wages.
- Enacting paid leave requirements for employers receiving public money.
- Setting standards for municipal contracts and procurement through mechanisms common elsewhere such as project labor agreements (PLA)—contracts used in the construction industry to set basic conditions for safety, pay, and benefits on municipal projects—and prevailing wage laws.
Worker-friendly policy changes
Minimum wage increases. There is strong evidence that higher minimum wages are an effective policy for raising the pay of low-wage workers (EPI 2023b). Six of the 12 Midwestern states passed laws to raise their minimum wages during this period. However, the minimum wage in five Midwestern states is still set at the federal level of $7.25.
Medicaid expansion. Medicaid expansion reduces a state’s uninsured rate (Guerra-Cardus and Lukens 2023) and is associated with lower mortality rates, especially among women and Black people (Lee, Dodge, and Terrault 2022). Ten Midwestern states have expanded Medicaid through the Affordable Care Act; two have not (KFF 2023).
Expansion of collective bargaining rights. Two states in the Midwest—Minnesota and Illinois—took steps during this period to strengthen workers’ rights. Minnesota banned noncompete clauses and captive audience meetings, among other measures, and Illinois enshrined collective bargaining rights in the state’s constitution.
Midwestern states should pursue pro-worker policies to build on post-pandemic progress
With the onset of the COVID-19 pandemic, the region’s economy was bolstered by significant investment from the federal government. This investment—through the CARES Act, the American Rescue Plan Act, and other legislation—provided relief at the scale of the problem.
When millions of jobs were lost in the initial months of the pandemic, most of the unemployed and their families were reasonably protected. Indeed, pandemic safety net programs kept millions out of poverty (Banerjee and Zipperer 2022). Supports for businesses and fiscal aid to state and local governments prevented more severe layoffs. With household income reasonably maintained by federal programs, strong consumer demand fueled a rapid recovery, with employers eager to rehire staff. This tight labor market gave low-wage workers leverage, leading to strong real wage growth for most workers and a job market that had largely recovered by the end of 2022.
Midwestern states now have an opportunity to build on this momentum and shift away from the policy choices that weakened worker power prior to the pandemic. Going back to the anti-union, anti-worker austerity of the 2010s will exacerbate inequality, suppress wages, and weaken public services. That is not the path the Midwest should take. Instead, the Midwest should take the high road. Policies to support collective bargaining, strengthen labor standards, and invest in public services will lead to better lives for working families across the region.
Subsequent sections of this report describe how the Midwest economy has performed coming out of the pandemic, and how that performance compares both with the period leading up to the outbreak of COVID-19 and with the period of economic recovery following the Great Recession. We first look at the recovery of jobs and at trends in unemployment rates and employment levels. Next, we look at wages and other measures of job quality. We then discuss poverty and inequality in the region. We close with a discussion of the role of unions and collective bargaining in strengthening job quality and the lives of working families.
Jobs and unemployment
The Midwest continues to face job deficits relative to other regions
As of May 2023, the Midwest has gained 151,700 jobs (+0.5%) since February 2020—the second-smallest gain of any region. The Northeast gained less than 3,000 jobs (+0.01%), while the South gained over 2.5 million jobs (+4.6%) and the West gained nearly 1.1 million jobs (+3.0%) (Economic Policy Institute analysis of BLS-CES various years).
While the raw numbers seem to imply the Midwest is doing better than the Northeast, the Midwest is in fact the only region facing a jobs deficit—the gap between the current level of jobs and the level of jobs expected under pre-recession employment rates when accounting for population growth. The region would need to add about 116,000 jobs to regain its February 2020 employment at its May 2023 population size.
Meanwhile, all other regions have added more jobs than we would expect had they not experienced a recession. The West has added almost 330,000 jobs above this counterfactual (employment levels if the pandemic recession had not occurred), while the South has added over 188,000 jobs and the Northeast has added almost 38,000 (see Figure A).
The Midwest is the only region facing a jobs deficit relative to pre-pandemic employment trends: Difference between pre-recession employment projections and actual employment in May 2023
| Region | Difference between actual employment and pre-pandemic projections |
|---|---|
| Midwest | -115,648 |
| South | 188,481 |
| Northeast | 37,811 |
| West | 327,605 |
Notes: Midwest, Northeast, South, and West refer to the four geographic regions of the United States as defined by the U.S. Census Bureau. Job deficit and surplus calculations are based on an estimation of the number of jobs that would exist if pre-pandemic employment levels were maintained under the current population size in each region (counterfactual employment). The deficit (or surplus) is the difference between counterfactual employment and the actual number of jobs in each region in May 2023.
Source: Economic Policy Institute analysis of Bureau of Labor Statistics Current Employment Statistics and Bureau of Labor Statistics Local Area Unemployment Statistics.
The Midwest’s unemployment rate is at a historic low, but racial disparities remain a concern
As a result of federal action to promote a strong jobs recovery from the COVID-19 pandemic recession, by 2022 all regions had achieved near-full or full recoveries to 2019 unemployment rates. The Midwest was no exception.
The region has enjoyed comparatively low unemployment rates over the medium term: The Midwest’s unemployment rate has been lower than the U.S. average for the past 13 years and has been the lowest of any region for seven of those years (see Appendix Figure A). As of May 2023, the Midwest’s unemployment rate—3.2%—was once again lower than any other region’s and has reached a historic low for the region (FRED 2023).
Within Midwestern states, unemployment remained highest in Illinois (4.1%) and Michigan (3.7%) as of May 2023. As shown in Table 2, all other Midwestern states had unemployment rates below the national average of 3.7% (BLS-LAUS various years).
The Midwest’s unemployment rate is the lowest of any region: Unemployment rate by region and Midwestern state, select months
| February 2020 | May 2023 | |
|---|---|---|
| United States | 3.5% | 3.7% |
| West | 4.0% | 4.0% |
| South | 3.5% | 3.3% |
| Northeast | 3.9% | 3.6% |
| Midwest | 3.6% | 3.2% |
| Illinois | 3.8% | 4.1% |
| Indiana | 3.4% | 3.1% |
| Iowa | 2.6% | 2.7% |
| Kansas | 3.1% | 2.9% |
| Michigan | 3.8% | 3.7% |
| Minnesota | 3.9% | 2.9% |
| Missouri | 3.3% | 2.5% |
| Nebraska | 3.0% | 1.9% |
| North Dakota | 2.2% | 2.1% |
| Ohio | 4.6% | 3.6% |
| South Dakota | 2.6% | 1.9% |
| Wisconsin | 3.0% | 2.4% |
Note: Midwest, Northeast, South, and West refer to the four geographic regions of the United States as defined by the U.S. Census Bureau.
Source: Economic Policy Institute analysis of U.S. Bureau of Labor Statistics Local Area Unemployment Statistics data.
Workers of all races and ethnicities fared better during the current economic recovery than after the Great Recession. Over the first three years of the post–Great Recession recovery (2007–2010), the unemployment rate increased by over 6 points for Black, Hispanic, and AAPI/AIAN/multiracial workers2 and nearly 4 points for white workers in the Midwest (see Figure B). After the Great Recession, these unemployment rates did not return to pre-recession rates until 2015—eight years later.
The Midwest’s unemployment rate has recovered relatively quickly following the pandemic recession, but racial disparities remain: Unemployment rate by race in the Midwest, 2007–2022
| Year | Black | Hispanic | White | AAPI / AIAN / multiracial |
|---|---|---|---|---|
| 2007 | 11.5% | 6.3% | 4.4% | 10.2% |
| 2008 | 13.4% | 7.6% | 5.1% | 11.3% |
| 2009 | 18.4% | 12.8% | 8.4% | 15.5% |
| 2010 | 18.6% | 12.4% | 8.2% | 17.2% |
| 2011 | 18.2% | 11.0% | 7.1% | 18.6% |
| 2012 | 15.9% | 9.5% | 6.2% | 13.6% |
| 2013 | 15.5% | 10.5% | 6.0% | 13.6% |
| 2014 | 14.0% | 7.7% | 4.7% | 13.2% |
| 2015 | 11.1% | 6.4% | 3.9% | 10.4% |
| 2016 | 10.6% | 5.9% | 3.8% | 12.2% |
| 2017 | 8.8% | 5.3% | 3.4% | 8.2% |
| 2018 | 7.2% | 4.4% | 3.2% | 6.6% |
| 2019 | 7.2% | 4.2% | 3.0% | 8.4% |
| 2020 | 14.0% | 10.7% | 6.3% | 12.8% |
| 2021 | 10.1% | 5.6% | 3.8% | 9.1% |
| 2022 | 7.2% | 4.5% | 2.8% | 7.6% |
| 2023 |
Notes: “Midwest” refers to the 12 states that make up the region as defined by the U.S. Census Bureau. AAPI stands for Asian American and Pacific Islander, and AIAN stands for American Indian and Alaska Native.
Source: Economic Policy Institute analysis of Current Population Survey microdata from the U.S. Census Bureau.
In contrast, between 2019, the year just prior to the pandemic, and 2022, the unemployment rate declined among white workers (0.2 percentage points) and AAPI/AIAN/multiracial workers (0.8 percentage points). The unemployment rate for Black workers stayed the same. Among Hispanic workers, it increased 0.3 points.
Throughout this period, though, severe disparities have persisted. The unemployment rate for Black workers and AAPI/AIAN/multiracial workers was more than 2.5 times the white unemployment rate in 2022. Reducing these disparities requires bold investments, including expanding workers’ rights and worker power, investing in the care economy and public sector, addressing the affordable housing crisis, and reducing barriers to employment for formerly incarcerated Midwesterners (Kamper 2022a).
Employment
The Midwest achieved a quick return to pre-pandemic employment and must resist austerity to sustain progress
Arguably the best measure of labor market health, the prime-age employment-to-population ratio or prime-age “EPOP” is the share of workers ages 25–54 who are currently employed. Whereas other measures—such as the unemployment rate and the labor force participation rate—can mask labor market weakness resulting from workers’ decisions to seek work or be skewed by demographic changes, the prime-age EPOP is a straightforward calculation of what share of the core working-age population has a job.
The Midwest is a region that works. As shown in Figure C, since the mid-1980s, the Midwest has consistently had the highest employment-to-population ratio of any region of the country, reaching a peak of 84.3% in 1999.
However, failure to restore the public sector in the wake of the Great Recession in most states has stalled employment growth, and racial and gender employment gaps persist. The post-2000 decline in the prime-age EPOP nationwide was a result of fiscal austerity, which sapped aggregate demand (spending by households, businesses, and governments) and prevented a full recovery of employment (Bivens 2014). In the Midwest, harmful trade policy exacerbated these dynamics by further reducing aggregate demand (Shields and Stettner 2020).
Fortunately, fiscal stimulus in the wake of the COVID-19 pandemic has quickened the recovery of the prime-age EPOP relative to the early aughts.
Figure C shows that despite the unprecedented job losses caused by the COVID-19 pandemic, in both the Midwest and other regions, the prime-age EPOP recovered significantly faster after the pandemic-induced recession than it did following the Great Recession. In the Midwest, the prime-age EPOP took 11 years following the Great Recession to recover to its 2007 levels, and all regions exhibited similar trends. In contrast, in all regions, the prime-age EPOP has nearly recovered to its 2019 rates within three years. In 2022, the Midwest prime-age EPOP of 82% remains the highest in the country (see Figure C). Nationwide, the June 2023 prime-age EPOP rate—80.9%—is approaching the all-time high of 81.9% reached in April 2000 (Irwin 2023).
The federal response during the pandemic hastened the region’s employment recovery. However, without policies to support high-road jobs, the Midwest risks further decline in job quality, weakening workforce participation, and continued growth in inequality.
Employment has recovered to pre-pandemic rates in all regions but is consistently highest in the Midwest: Prime-age employment-to-population ratio by region, 1979–2022
| United States | Northeast | Midwest | South | West | |
|---|---|---|---|---|---|
| 1979 | 74.7% | 73.0% | 75.4% | 74.8% | 75.4% |
| 1980 | 74.3% | 73.1% | 74.1% | 74.7% | 75.3% |
| 1981 | 74.7% | 73.7% | 74.7% | 75.1% | 75.3% |
| 1982 | 73.6% | 73.1% | 73.1% | 73.8% | 74.3% |
| 1983 | 73.8% | 73.3% | 73.5% | 74.0% | 74.3% |
| 1984 | 75.9% | 75.3% | 75.7% | 76.3% | 76.1% |
| 1985 | 76.7% | 76.3% | 76.5% | 77.1% | 76.9% |
| 1986 | 77.4% | 77.6% | 77.7% | 76.9% | 77.4% |
| 1987 | 78.4% | 78.8% | 78.8% | 78.0% | 78.2% |
| 1988 | 79.2% | 79.2% | 79.9% | 78.7% | 79.2% |
| 1989 | 79.9% | 79.7% | 80.9% | 79.4% | 79.8% |
| 1990 | 79.7% | 79.3% | 80.9% | 79.4% | 79.1% |
| 1991 | 78.6% | 77.7% | 80.3% | 78.6% | 77.8% |
| 1992 | 78.3% | 76.9% | 80.7% | 78.3% | 77.0% |
| 1993 | 78.6% | 77.5% | 81.0% | 78.6% | 76.9% |
| 1994 | 79.3% | 77.6% | 82.0% | 79.2% | 77.9% |
| 1995 | 79.8% | 78.2% | 82.9% | 79.6% | 78.2% |
| 1996 | 80.2% | 79.3% | 83.2% | 79.9% | 78.4% |
| 1997 | 80.9% | 80.1% | 83.9% | 80.3% | 79.3% |
| 1998 | 81.1% | 80.5% | 83.9% | 80.6% | 79.5% |
| 1999 | 81.4% | 80.9% | 84.3% | 81.0% | 79.7% |
| 2000 | 81.5% | 80.9% | 83.8% | 81.1% | 80.1% |
| 2001 | 80.5% | 80.2% | 82.9% | 79.9% | 79.4% |
| 2002 | 79.3% | 79.5% | 81.6% | 78.5% | 78.1% |
| 2003 | 78.8% | 78.8% | 81.0% | 78.2% | 77.6% |
| 2004 | 79.0% | 79.2% | 80.8% | 78.3% | 78.1% |
| 2005 | 79.3% | 79.4% | 81.1% | 78.9% | 78.4% |
| 2006 | 79.8% | 79.8% | 81.6% | 79.1% | 79.3% |
| 2007 | 79.9% | 79.9% | 81.4% | 79.3% | 79.5% |
| 2008 | 79.1% | 79.8% | 80.5% | 78.3% | 78.4% |
| 2009 | 75.8% | 77.0% | 77.0% | 75.1% | 74.8% |
| 2010 | 75.1% | 76.4% | 76.7% | 74.5% | 73.6% |
| 2011 | 75.1% | 76.0% | 77.1% | 74.6% | 73.5% |
| 2012 | 75.7% | 76.1% | 77.9% | 75.3% | 74.1% |
| 2013 | 75.9% | 76.4% | 78.0% | 75.1% | 74.8% |
| 2014 | 76.7% | 76.9% | 79.5% | 75.8% | 75.4% |
| 2015 | 77.2% | 78.0% | 80.3% | 76.0% | 76.0% |
| 2016 | 77.9% | 78.5% | 80.8% | 76.8% | 76.9% |
| 2017 | 78.6% | 79.3% | 80.9% | 77.6% | 77.8% |
| 2018 | 79.4% | 80.3% | 81.6% | 78.3% | 78.5% |
| 2019 | 80.0% | 80.7% | 82.0% | 79.0% | 79.3% |
| 2020 | 75.6% | 75.6% | 78.4% | 75.2% | 74.0% |
| 2021 | 77.6% | 77.7% | 80.0% | 77.0% | 76.4% |
| 2022 | 79.9% | 80.6% | 81.9% | 78.9% | 79.2% |
Notes: Midwest, Northeast, South, and West refer to the four geographic regions of the United States as defined by the U.S. Census Bureau. The prime-age employment-to-population ratio (EPOP) is the share of people ages 25–54 who are working.
Source: Economic Policy Institute analysis of Current Population Survey microdata from the U.S. Census Bureau.
Though the prime-age EPOP varies widely across states, all Midwestern states’ prime-age EPOPs recovered faster after the pandemic than after the Great Recession
Within the Midwest, the prime-age EPOP varies widely across different states but has exhibited similar trends since 2007. The prime-age EPOP is consistently highest in North Dakota, South Dakota, Iowa, Nebraska, and Minnesota, and lowest in Michigan, Ohio, Indiana, and Illinois.
In all Midwestern states, the prime-age EPOP fell during the Great Recession and faced an uneven recovery over the subsequent decade. During the pandemic recession, the prime-age EPOP fell more quickly and recovered more quickly than during the Great Recession, following a v-shaped pattern in most states.
Compared with 2007, the year prior to the Great Recession, and 2019, the year prior to the COVID-19 pandemic, four states exhibit prime-age EPOPs that are higher in 2022 than in both key previous years: Indiana, Illinois, Missouri, and Iowa. However, the other eight Midwestern states are faring worse on prime-age EPOP in 2022 relative to at least one of those years—or relative to both, as is the case in Ohio and Wisconsin. Wisconsin’s 2022 prime-age EPOP lags furthest behind 2007 levels, followed by slightly smaller gaps in Ohio, North Dakota, and South Dakota. South Dakota’s prime-age EPOP increased over its 2019 rate more than any other Midwestern state; the opposite is true for Wisconsin (see Figure D).
In seven Midwestern states, the prime-age EPOP has surpassed 2019 rates, while Ohio and Wisconsin trail their 2007 rates: Prime-age employment-to-population ratio by Midwestern state, select years
| 2007 | 2019 | 2022 | |
|---|---|---|---|
| United States | 79.9% | 80.0% | 79.9% |
| Michigan | 76.0% | 79.5% | 77.6% |
| Ohio | 80.9% | 80.2% | 80.1% |
| Indiana | 79.9% | 80.3% | 81.3% |
| Illinois | 80.6% | 80.8% | 81.7% |
| Wisconsin | 85.1% | 85.2% | 82.3% |
| Missouri | 81.8% | 82.0% | 83.1% |
| Kansas | 84.1% | 83.6% | 84.0% |
| Minnesota | 85.5% | 85.8% | 85.8% |
| Nebraska | 85.8% | 86.6% | 86.4% |
| Iowa | 86.0% | 86.5% | 86.9% |
| North Dakota | 87.7% | 85.7% | 87.0% |
| South Dakota | 88.0% | 85.2% | 87.6% |
Note: The prime-age employment-to-population ratio (EPOP) is the share of people ages 25–54 who are working.
Source: Economic Policy Institute analysis of Current Population Survey microdata from the U.S. Census Bureau.
Employment disparities by race and gender persist and, in some cases, have grown
Despite high employment rates overall and progress for Black workers, disparities remain in employment based on race/ethnicity and gender.
Employment rates by race/ethnicity
While the gaps between the white EPOP and the AAPI, Hispanic, and Black EPOPs have narrowed over the last 15 years, significant gaps remain, and the prime-age EPOP gap between white workers and AIAN/multiracial/other workers has grown (see Figure E). The Black prime-age EPOP (76.4% in 2022) is 7.1 percentage points lower than the white rate of 83.5%. The AIAN/multiracial/other prime-age EPOP (68.0%) is 15.5 points lower than the white rate.
The prime-age EPOP among white, Hispanic, and AIAN/multiracial/other workers has not recovered to 2019 levels. However, the prime-age EPOP among Black and AAPI workers has exceeded 2019 levels by 1.3 percentage points and 3.9 percentage points, respectively.
The recovery of the Black prime-age EPOP is an especially positive development given long-standing race-based disparities in labor market outcomes. The Black prime-age EPOP faced a slow recovery after the Great Recession but has reached an all-time high in the current recovery. This is likely the result of a tight labor market spurred by policy investments during the pandemic recession.
The Black-white prime-age EPOP gap has narrowed but Indigenous-white gap has widened: Prime-age employment-to-population ratio in the Midwest, by race/ethnicity, 2007–2022
| White | Black | Hispanic | AAPI | AIAN / multiracial / other | |
|---|---|---|---|---|---|
| 2007 | 83.2% | 72.0% | 77.5% | 77.2% | 72.5% |
| 2008 | 82.3% | 69.6% | 77.3% | 79.0% | 70.0% |
| 2009 | 79.3% | 63.5% | 71.9% | 79.6% | 64.8% |
| 2010 | 78.9% | 63.9% | 72.6% | 72.5% | 66.2% |
| 2011 | 79.6% | 62.9% | 72.9% | 74.2% | 61.8% |
| 2012 | 80.3% | 64.7% | 74.7% | 76.0% | 62.8% |
| 2013 | 80.4% | 65.9% | 74.0% | 75.4% | 64.6% |
| 2014 | 81.7% | 69.1% | 76.2% | 74.6% | 65.4% |
| 2015 | 82.5% | 70.3% | 77.2% | 76.0% | 64.9% |
| 2016 | 83.0% | 71.4% | 77.4% | 76.1% | 63.7% |
| 2017 | 83.0% | 71.5% | 78.6% | 78.4% | 65.4% |
| 2018 | 83.7% | 74.0% | 77.5% | 77.6% | 69.3% |
| 2019 | 83.9% | 75.1% | 79.0% | 78.5% | 68.7% |
| 2020 | 81.1% | 67.3% | 73.6% | 75.8% | 64.0% |
| 2021 | 82.2% | 70.3% | 77.3% | 79.0% | 64.7% |
| 2022 | 83.5% | 76.4% | 78.2% | 82.4% | 68.0% |
Notes: “Midwest” refers to the 12 states that make up the region as defined by the U.S. Census Bureau. AAPI stands for Asian American and Pacific Islander, AIAN stands for American Indian and Alaska Native, and other is other race.
Source: Economic Policy Institute analysis of Current Population Survey microdata from the U.S. Census Bureau.
Employment rates by gender
Little progress has been made to close the gap between the prime-age men’s and prime-age women’s rates of employment. The share of prime-age men in the Midwest with a job has consistently been at least 10 percentage points higher than that of women in the Midwest since 2007 (see Figure F).
A key reason for the gender gap in employment is our nation’s care economy crisis. Women bear the brunt of caregiving responsibilities, both paid and unpaid, both for children and other family members (Gould, Sawo, and Banerjee 2021). The lack of accessible and affordable care forces women to make impossible choices between unpaid care work at home and underpaid work in the formal economy. Investments in the care economy would create opportunities for high-quality jobs in care work and enable unpaid caregivers to enter the labor force.
Little progress has been made to close the large gender employment gap: Prime-age employment-to-population ratio in the Midwest by gender, 2007–2022
| Men | Women | |
|---|---|---|
| 2007 | 87.3% | 75.6% |
| 2008 | 85.8% | 75.2% |
| 2009 | 80.9% | 73.2% |
| 2010 | 81.0% | 72.4% |
| 2011 | 82.0% | 72.2% |
| 2012 | 83.4% | 72.5% |
| 2013 | 83.5% | 72.7% |
| 2014 | 84.9% | 74.3% |
| 2015 | 85.9% | 74.8% |
| 2016 | 86.3% | 75.4% |
| 2017 | 86.2% | 75.9% |
| 2018 | 87.0% | 76.3% |
| 2019 | 87.2% | 76.9% |
| 2020 | 83.1% | 73.7% |
| 2021 | 85.0% | 75.0% |
| 2022 | 87.1% | 76.8% |
Notes: “Midwest” refers to the 12 states that make up the region as defined by the U.S. Census Bureau. The prime-age employment-to-population ratio (EPOP) is the share of people ages 25–54 who are working.
Source: Economic Policy Institute analysis of Current Population Survey microdata from the U.S. Census Bureau.
Employment rates at the intersection of race/ethnicity and gender
When considering the intersection of race and gender on prime-age employment in the Midwest, there is a clear clustering of white, Hispanic, and AAPI prime-age men exhibiting high EPOP rates (88%–90% in 2022), as seen in Figure G. Meanwhile, AIAN, multiracial, and other race/ethnicity men and women—as well as Black, Hispanic, and AAPI prime-age women—are employed at much lower rates (65%–75%). The prime-age EPOP for white women falls in between these two clusters (79%). While the prime-age EPOP for Black men has historically been low relative to white women, Black men’s prime-age EPOP in 2022 was equal to that of white women.
The intersection of gender and race/ethnicity disparities in caregiving work plays a role in the low prime-age EPOP rates among AAPI, Black, and Hispanic women. Women of all race/ethnicity groups spend more time providing unpaid care work at home, with Hispanic women spending the most time caregiving across all demographic groups (Gallagher, Robbins, and Mason 2023).
The prime-age EPOP is high among white, Hispanic, and AAPI men but low for multiracial workers and Hispanic women: Prime-age employment-to-population ratio in the Midwest by race and gender, select years
| Race/ethnicity and gender combination | 2007 | 2010 | 2019 | 2022 |
|---|---|---|---|---|
| AAPI men | 89.2% | 83.6% | 89.3% | 89.6% |
| Hispanic men | 89.0% | 81.0% | 88.6% | 89.0% |
| White men | 88.8% | 83.0% | 88.7% | 88.1% |
| Black men | 73.5% | 63.9% | 76.5% | 78.8% |
| White women | 77.6% | 74.8% | 79.1% | 78.8% |
| AAPI women | 66.0% | 62.5% | 68.2% | 75.8% |
| Black women | 70.8% | 64.0% | 73.8% | 74.2% |
| AIAN / multiracial / other men | 78.1% | 68.9% | 74.5% | 71.5% |
| Hispanic women | 63.9% | 61.7% | 68.5% | 66.9% |
| AIAN / multiracial / other women | 65.8% | 63.8% | 63.3% | 64.5% |
Notes: “Midwest” refers to the 12 states that make up the region as defined by the U.S. Census Bureau. The prime-age employment-to-population ratio (EPOP) is the share of people ages 25–54 who are working. AAPI stands for Asian American and Pacific Islander, AIAN stands for American Indian and Alaska Native, and other is other race.
Source: Economic Policy Institute analysis of Current Population Survey microdata from the U.S. Census Bureau.
Employment by industry
The employment recovery has been successful overall but varies by industry, and state and local government shortfalls persist
The pandemic’s initial effects on Midwest employment varied dramatically across different industries. As was the case nationwide, industries that involved face-to-face interactions—restaurants, retail, travel—were hit particularly hard. From February to April 2020, Midwest employment in leisure and hospitality was nearly cut in half (-48.9%)—a drop that was second only to the Northeast. Notably, Midwest employment losses over the same period in government and manufacturing were larger than in any other region, with losses of nearly 7% and 15%, respectively (Economic Policy Institute analysis of BLS-CES various years).
That said, throughout the country, total nonfarm employment (which includes most public- and private-sector workers) has recovered much faster in the current recovery than after the Great Recession. In the lead-up to the Great Recession, Midwest nonfarm employment peaked in January 2008 and did not return to that level until November 2014—81 months (nearly seven years) later (see Figure H). In contrast, before the pandemic recession, nonfarm employment peaked in February 2020, declined sharply, and recovered to pre-pandemic levels by February 2023—a span of 35 months, or just shy of three years. Federal pandemic relief, including loans to businesses to hire employees and stimulus payments to households that allowed workers to return to the labor market, strongly curtailed the Midwest’s period of low employment and created the conditions necessary for a quick recovery.
Federal fiscal relief at the scale of the problem led to a faster recovery from the pandemic recession: Midwest private-sector employment change since business cycle peak, January 2008 and February 2020
| 2008 | 2020 | |
|---|---|---|
| 0 | 1 | 1 |
| 1 | 0.999736 | 0.992438 |
| 2 | 0.997298 | 0.850449 |
| 3 | 0.996439 | 0.869385 |
| 4 | 0.995977 | 0.903073 |
| 5 | 0.995395 | 0.91974 |
| 6 | 0.99296 | 0.929511 |
| 7 | 0.991627 | 0.934906 |
| 8 | 0.989758 | 0.941797 |
| 9 | 0.985996 | 0.940636 |
| 10 | 0.981225 | 0.938 |
| 11 | 0.975792 | 0.943654 |
| 12 | 0.965997 | 0.946007 |
| 13 | 0.96165 | 0.950777 |
| 14 | 0.955435 | 0.951821 |
| 15 | 0.948417 | 0.952471 |
| 16 | 0.945832 | 0.955125 |
| 17 | 0.941173 | 0.962834 |
| 18 | 0.938037 | 0.962205 |
| 19 | 0.9371 | 0.960734 |
| 20 | 0.936235 | 0.964095 |
| 21 | 0.935697 | 0.967339 |
| 22 | 0.935505 | 0.970071 |
| 23 | 0.934602 | 0.975981 |
| 24 | 0.934385 | 0.980528 |
| 25 | 0.934332 | 0.98252 |
| 26 | 0.935081 | 0.984563 |
| 27 | 0.938031 | 0.985628 |
| 28 | 0.940349 | 0.98667 |
| 29 | 0.939774 | 0.991611 |
| 30 | 0.939667 | 0.992742 |
| 31 | 0.940261 | 0.994009 |
| 32 | 0.940132 | 0.994872 |
| 33 | 0.943794 | 0.996822 |
| 34 | 0.944042 | 0.996362 |
| 35 | 0.944394 | 0.999353 |
| 36 | 0.94598 | 1.000954 |
| 37 | 0.946467 | |
| 38 | 0.948213 | |
| 39 | 0.950692 | |
| 40 | 0.950877 | |
| 41 | 0.95032 | |
| 42 | 0.953614 | |
| 43 | 0.954708 | |
| 44 | 0.956828 | |
| 45 | 0.956753 | |
| 46 | 0.957825 | |
| 47 | 0.959143 | |
| 48 | 0.961701 | |
| 49 | 0.963525 | |
| 50 | 0.966671 | |
| 51 | 0.966859 | |
| 52 | 0.967023 | |
| 53 | 0.96786 | |
| 54 | 0.967407 | |
| 55 | 0.968514 | |
| 56 | 0.970584 | |
| 57 | 0.97136 | |
| 58 | 0.972455 | |
| 59 | 0.973443 | |
| 60 | 0.974563 | |
| 61 | 0.977214 | |
| 62 | 0.977425 | |
| 63 | 0.975987 | |
| 64 | 0.978397 | |
| 65 | 0.979592 | |
| 66 | 0.97957 | |
| 67 | 0.982187 | |
| 68 | 0.983917 | |
| 69 | 0.984735 | |
| 70 | 0.986279 | |
| 71 | 0.987119 | |
| 72 | 0.986534 | |
| 73 | 0.988308 | |
| 74 | 0.989312 | |
| 75 | 0.991023 | |
| 76 | 0.993646 | |
| 77 | 0.995143 | |
| 78 | 0.995074 | |
| 79 | 0.99688 | |
| 80 | 0.997471 | |
| 81 | 0.999015 | |
| 82 | 1.00128 |
Note: “Midwest” refers to the 12 states that make up the region as defined by the U.S. Census Bureau.
Source: Economic Policy Institute analysis of Bureau of Labor Statistics Current Employment Statistics data.
The Midwest’s two largest industries by shares of overall employment are trade, transportation, and utilities and education and health. The five largest Midwest industries are listed in Figure I. (See Appendix Table 1 for employment levels in all industries in the Midwest.)
While total nonfarm employment in the region has now surpassed its pre-recession peak, not all industries have regained the jobs they lost. As shown in Figure I, state and local government faces a deficit of over 2.2% (nearly 100,000 jobs). Education and health faces a smaller but still substantial deficit of 0.3% (15,300 jobs). Trade, transportation, and utilities and professional business services have recovered (and exceeded) their pre-recession employment levels in the Midwest.
Smaller Midwest industries include construction, financial services, and leisure and hospitality. Construction has grown 5.0% since February 2020—the largest increase of any Midwest industry—and financial services has grown 0.6%. Meanwhile, leisure and hospitality remains 2.7% below February 2020 employment (Economic Policy Institute analysis of BLS-CES various years).
While the pandemic recovery has been uneven across industries, it has nevertheless been much faster than the recovery from the Great Recession. Figure J demonstrates this for three specific industries—manufacturing, leisure and hospitality, and state and local government. For example, after the pre–Great Recession business cycle peak, manufacturing still had not recovered 144 months later. After the pre-pandemic business cycle peak, manufacturing recovered within a span of 29 months.
The Midwest’s public sector faces large employment deficits compared with pre-pandemic levels: Employment change (in thousands) in the five largest Midwest industries, February 2020–May 2023
| Industry | Employment change in thousands (% change) |
|---|---|
| State and local government | -98 |
| Government (local, state, federal) | -89.7 |
| Education and health | -15.3 |
| Professional business services | 118.6 |
| Trade, transportation, and utilities | 158.3 |
Notes: “Midwest” refers to the 12 states that make up the region as defined by the U.S. Census Bureau. Employment deficits are calculated by subtracting February 2020 employment from May 2023 employment.
Source: Economic Policy Institute analysis of Bureau of Labor Statistics Current Employment Statistics data.
While overall employment recovered faster after the pandemic economic recession, not all industries have recovered evenly
: Employment change since January 2008 business cycle peak, select Midwest industries
| Manufacturing | Leisure & hospitality | State & local govt. | |
|---|---|---|---|
| 0 | 1 | 1 | 1 |
| 1 | 0.999535 | 0.998566 | 1.000615 |
| 2 | 0.991716 | 0.994946 | 1.000114 |
| 3 | 0.987759 | 0.99621 | 1.00155 |
| 4 | 0.984664 | 0.996722 | 1.002575 |
| 5 | 0.9862 | 0.995117 | 1.003122 |
| 6 | 0.97389 | 0.991771 | 1.003418 |
| 7 | 0.969003 | 0.991088 | 1.004831 |
| 8 | 0.965396 | 0.989312 | 1.006586 |
| 9 | 0.957647 | 0.987263 | 1.004649 |
| 10 | 0.947826 | 0.983575 | 1.006335 |
| 11 | 0.932933 | 0.982141 | 1.004854 |
| 12 | 0.899446 | 0.974799 | 1.005948 |
| 13 | 0.889509 | 0.971999 | 1.005629 |
| 14 | 0.874244 | 0.968482 | 1.005218 |
| 15 | 0.856907 | 0.96435 | 1.00335 |
| 16 | 0.837196 | 0.968243 | 1.006814 |
| 17 | 0.824095 | 0.964282 | 1.004991 |
| 18 | 0.821628 | 0.962199 | 1.001185 |
| 19 | 0.823885 | 0.960082 | 1.000182 |
| 20 | 0.824374 | 0.961004 | 0.998519 |
| 21 | 0.823164 | 0.956257 | 1.001117 |
| 22 | 0.821163 | 0.954004 | 1.000205 |
| 23 | 0.821093 | 0.953184 | 0.998997 |
| 24 | 0.821163 | 0.952296 | 0.999066 |
| 25 | 0.821512 | 0.952501 | 0.997767 |
| 26 | 0.822745 | 0.950828 | 0.996582 |
| 27 | 0.827539 | 0.955677 | 0.995967 |
| 28 | 0.83089 | 0.953867 | 0.993141 |
| 29 | 0.831797 | 0.954072 | 0.992503 |
| 30 | 0.836684 | 0.95636 | 0.985142 |
| 31 | 0.835358 | 0.958204 | 0.988469 |
| 32 | 0.839128 | 0.959672 | 0.986077 |
| 33 | 0.841501 | 0.96196 | 0.987808 |
| 34 | 0.842083 | 0.96237 | 0.986897 |
| 35 | 0.84455 | 0.961926 | 0.984755 |
| 36 | 0.847668 | 0.960355 | 0.98594 |
| 37 | 0.84967 | 0.959604 | 0.983342 |
| 38 | 0.853067 | 0.96237 | 0.983296 |
| 39 | 0.857605 | 0.964555 | 0.984527 |
| 40 | 0.859187 | 0.964077 | 0.982841 |
| 41 | 0.859816 | 0.964521 | 0.980676 |
| 42 | 0.86454 | 0.968038 | 0.980129 |
| 43 | 0.864516 | 0.972375 | 0.979514 |
| 44 | 0.866238 | 0.97357 | 0.979536 |
| 45 | 0.868193 | 0.973604 | 0.977531 |
| 46 | 0.869264 | 0.976404 | 0.976893 |
| 47 | 0.872266 | 0.975175 | 0.976939 |
| 48 | 0.875361 | 0.98057 | 0.977941 |
| 49 | 0.877618 | 0.985556 | 0.978306 |
| 50 | 0.881062 | 0.992112 | 0.980744 |
| 51 | 0.882435 | 0.991975 | 0.980608 |
| 52 | 0.884087 | 0.988936 | 0.982932 |
| 53 | 0.886438 | 0.992863 | 0.97924 |
| 54 | 0.890277 | 0.993 | 0.971948 |
| 55 | 0.887624 | 0.995834 | 0.976506 |
| 56 | 0.888206 | 0.996107 | 0.978488 |
| 57 | 0.888439 | 0.998532 | 0.978032 |
| 58 | 0.888323 | 1.000683 | 0.978807 |
| 59 | 0.888997 | 1.004337 | 0.976141 |
| 60 | 0.890138 | 1.007615 | 0.974819 |
| 61 | 0.891837 | 1.008639 | 0.977212 |
| 62 | 0.892884 | 1.009664 | 0.976118 |
| 63 | 0.892279 | 1.006522 | 0.975207 |
| 64 | 0.892767 | 1.012293 | 0.973543 |
| 65 | 0.893721 | 1.013693 | 0.971743 |
| 66 | 0.891464 | 1.016561 | 0.968689 |
| 67 | 0.894443 | 1.017142 | 0.9727 |
| 68 | 0.895956 | 1.01984 | 0.975526 |
| 69 | 0.89784 | 1.022742 | 0.975207 |
| 70 | 0.899656 | 1.022469 | 0.974888 |
| 71 | 0.899935 | 1.023527 | 0.974728 |
| 72 | 0.900261 | 1.024859 | 0.972267 |
| 73 | 0.904915 | 1.025405 | 0.974478 |
| 74 | 0.906009 | 1.025098 | 0.974933 |
| 75 | 0.908219 | 1.028615 | 0.975252 |
| 76 | 0.91036 | 1.032986 | 0.97589 |
| 77 | 0.912827 | 1.033737 | 0.97605 |
| 78 | 0.913385 | 1.03384 | 0.974478 |
| 79 | 0.91541 | 1.03524 | 0.976187 |
| 80 | 0.914945 | 1.035001 | 0.978101 |
| 81 | 0.917551 | 1.038108 | 0.977098 |
| 82 | 0.920227 | 1.038928 | 0.978693 |
| 83 | 0.922833 | 1.042411 | 0.976734 |
| 84 | 0.922205 | 1.043811 | 0.975868 |
| 85 | 0.92281 | 1.046372 | 0.977896 |
| 86 | 0.923136 | 1.046713 | 0.977235 |
| 87 | 0.922205 | 1.047601 | 0.97826 |
| 88 | 0.924835 | 1.056684 | 0.98022 |
| 89 | 0.924788 | 1.056718 | 0.979924 |
| 90 | 0.926068 | 1.058562 | 0.978032 |
| 91 | 0.925882 | 1.060099 | 0.976209 |
| 92 | 0.926883 | 1.066621 | 0.975776 |
| 93 | 0.925905 | 1.066792 | 0.976642 |
| 94 | 0.925882 | 1.069626 | 0.975116 |
| 95 | 0.926115 | 1.073792 | 0.977235 |
| 96 | 0.927697 | 1.073212 | 0.976437 |
| 97 | 0.925696 | 1.074748 | 0.978511 |
| 98 | 0.925393 | 1.076695 | 0.979217 |
| 99 | 0.926743 | 1.081134 | 0.980334 |
| 100 | 0.925277 | 1.079495 | 0.976802 |
| 101 | 0.924765 | 1.079426 | 0.978511 |
| 102 | 0.926673 | 1.083456 | 0.980243 |
| 103 | 0.925742 | 1.085026 | 0.980357 |
| 104 | 0.926324 | 1.087758 | 0.983365 |
| 105 | 0.925905 | 1.088236 | 0.980288 |
| 106 | 0.926743 | 1.091173 | 0.982795 |
| 107 | 0.92679 | 1.085983 | 0.979468 |
| 108 | 0.929093 | 1.091958 | 0.982112 |
| 109 | 0.92779 | 1.097012 | 0.982043 |
| 110 | 0.929 | 1.098651 | 0.9812 |
| 111 | 0.93021 | 1.097968 | 0.980813 |
| 112 | 0.93149 | 1.095715 | 0.980402 |
| 113 | 0.933631 | 1.099163 | 0.98398 |
| 114 | 0.931886 | 1.09749 | 0.982385 |
| 115 | 0.934632 | 1.100973 | 0.981792 |
| 116 | 0.935865 | 1.100905 | 0.984687 |
| 117 | 0.937704 | 1.102407 | 0.982772 |
| 118 | 0.940007 | 1.10292 | 0.982499 |
| 119 | 0.942125 | 1.102271 | 0.983752 |
| 120 | 0.942753 | 1.104968 | 0.981884 |
| 121 | 0.945918 | 1.10572 | 0.985849 |
| 122 | 0.947361 | 1.10811 | 0.985621 |
| 123 | 0.949013 | 1.099539 | 0.983502 |
| 124 | 0.949921 | 1.105617 | 0.984937 |
| 125 | 0.951713 | 1.107871 | 0.989153 |
| 126 | 0.95262 | 1.107973 | 0.986008 |
| 127 | 0.953737 | 1.110193 | 0.989312 |
| 128 | 0.95532 | 1.108383 | 0.986213 |
| 129 | 0.957275 | 1.110603 | 0.986418 |
| 130 | 0.958578 | 1.11009 | 0.988287 |
| 131 | 0.959578 | 1.113744 | 0.987877 |
| 132 | 0.959206 | 1.116886 | 0.984299 |
| 133 | 0.960579 | 1.115178 | 0.984595 |
| 134 | 0.959881 | 1.116066 | 0.987353 |
| 135 | 0.95902 | 1.114461 | 0.986715 |
| 136 | 0.958112 | 1.114598 | 0.986191 |
| 137 | 0.958112 | 1.115042 | 0.989495 |
| 138 | 0.955832 | 1.115861 | 0.988971 |
| 139 | 0.956088 | 1.114291 | 0.99068 |
| 140 | 0.954435 | 1.112412 | 0.987649 |
| 141 | 0.946267 | 1.118115 | 0.989404 |
| 142 | 0.951433 | 1.120369 | 0.989745 |
| 143 | 0.950061 | 1.124876 | 0.991728 |
| 144 | 0.948548 | 1.125525 | 0.99542 |
: Employment change since February 2020 business cycle peak, select Midwest industries
| Manufacturing | Leisure & hospitality | State & local govt. | |
|---|---|---|---|
| 0 | 1 | 1 | 1 |
| 1 | 0.997249 | 0.96537 | 0.997729 |
| 2 | 0.849501 | 0.513967 | 0.932844 |
| 3 | 0.874306 | 0.578622 | 0.907362 |
| 4 | 0.930596 | 0.689602 | 0.904427 |
| 5 | 0.93703 | 0.751591 | 0.924495 |
| 6 | 0.941525 | 0.76883 | 0.936101 |
| 7 | 0.946903 | 0.790674 | 0.931697 |
| 8 | 0.950292 | 0.805126 | 0.934106 |
| 9 | 0.951864 | 0.79328 | 0.934266 |
| 10 | 0.956629 | 0.74441 | 0.930665 |
| 11 | 0.959625 | 0.769254 | 0.93406 |
| 12 | 0.959109 | 0.80249 | 0.93305 |
| 13 | 0.963382 | 0.815094 | 0.936284 |
| 14 | 0.956776 | 0.826577 | 0.939908 |
| 15 | 0.955622 | 0.833485 | 0.941514 |
| 16 | 0.958618 | 0.849785 | 0.947913 |
| 17 | 0.963677 | 0.878446 | 0.95656 |
| 18 | 0.963407 | 0.881022 | 0.953876 |
| 19 | 0.965814 | 0.883355 | 0.951147 |
| 20 | 0.972494 | 0.894353 | 0.94805 |
| 21 | 0.973353 | 0.90838 | 0.947959 |
| 22 | 0.977037 | 0.908138 | 0.947706 |
| 23 | 0.980426 | 0.910441 | 0.953234 |
| 24 | 0.984552 | 0.916894 | 0.95172 |
| 25 | 0.98971 | 0.92062 | 0.952615 |
| 26 | 0.99332 | 0.922317 | 0.95305 |
| 27 | 0.993443 | 0.925983 | 0.954266 |
| 28 | 0.994843 | 0.929134 | 0.95656 |
| 29 | 1.000958 | 0.935194 | 0.962982 |
| 30 | 0.937648 | 0.964335 | |
| 31 | 0.939859 | 0.961216 | |
| 32 | 0.946949 | 0.963853 | |
| 33 | 0.955493 | 0.966651 | |
| 34 | 0.957038 | 0.964266 | |
| 35 | 0.962734 | 0.968968 | |
| 36 | 0.967915 | 0.971124 | |
| 37 | 0.969339 | 0.972477 | |
| 38 | 0.972126 | 0.973394 | |
| 39 | 0.973338 | 0.977523 |
Note: “Midwest” refers to the 12 states that make up the region as defined by the U.S. Census Bureau.
Source: Economic Policy Institute analysis of Bureau of Labor Statistics Current Employment Statistics data.
State and local government employment shortfalls in the Midwest and across the country pose harm to workers and communities
The continued weakness in state and local government hiring is a serious problem for the Midwest and the country more broadly. From the start of the pandemic through 2021, employment in state and local public education—which represents the lion’s share of state and local government losses—fell by nearly 5% overall (Cooper and Martinez Hickey 2022). The dire conditions faced by public schools, public health systems, unemployment insurance offices, and other public agencies during the pandemic made clear how critical these public services are, particularly in times of social and economic distress.
In periods of weakened consumer demand, government spending is the primary tool to boost economic growth. This includes spending to support public-sector employment. In the decade following the Great Recession, policymakers in the Midwest largely chose to defund, rather than invest in, public-sector employment. This choice resulted in sluggish overall job growth, persistent high unemployment rates, and real median wages that barely budged (and even declined in several years).
At least in some cases, policies that have eroded public-sector collective bargaining rights have reduced real wages enough that state and local governments are facing soaring job vacancy rates, as workers opt for better-paying jobs in the private sector. A prime example is Wisconsin (Gunn 2023). The passage of Act 10 in 2011, which reduced union rights and limited the ability of local governments to raise public-sector pay, reduced worker wages and household incomes (Cooper 2018). Not only does Wisconsin have 8.5% fewer state and local government jobs than it did before the beginning of the Great Recession, but it is also having trouble filling vacancies for the jobs it still has (BLS-LAUS various years).
In the current economy, the public-sector employment shortfall has not been as pronounced; however, the longer it persists, the more harm it causes both workers and communities. Cuts in public-sector employment are particularly harmful to Black workers and women, who are disproportionately employed in the sector. State and local government has historically been a key source of family-sustaining middle-class jobs, particularly for workers of color (Cooper and Wolfe 2020).
Moreover, a depleted public-sector workforce means that state and local governments are less able to provide essential goods and services, such as public education, unemployment insurance, and other social safety net protections. Within the Midwest, eight states have state and local government employment deficits that exceed the U.S. average: Missouri, Nebraska, Illinois, Michigan, Kansas, Minnesota, Wisconsin, and Ohio (see Figure K).
Eight Midwestern states’ losses in state and local government employment exceed the U.S. average: Percent change in state and local government employment between February 2020 and May 2023, Midwestern states and U.S.
| Percent change (Feb 2020–May 2023) | |
|---|---|
| Ohio | -3.9% |
| Wisconsin | -2.9% |
| Minnesota | -2.7% |
| Kansas | -2.6% |
| Michigan | -2.4% |
| Illinois | -2.3% |
| Nebraska | -2.0% |
| Missouri | -1.9% |
| United States | -1.4% |
| North Dakota | -1.2% |
| Iowa | -0.8% |
| Indiana | 0.4% |
| South Dakota | 0.4% |
Source: Economic Policy Institute analysis of Bureau of Labor Statistics Current Employment Statistics data.
Wages
Low-wage workers have seen historic gains, but median-wage workers are faring worse than in any other region
Policy decisions to not raise minimum wages in six Midwestern states, laws preempting local governments from passing their own minimum wage increases, and legislation weakening unions have had a predictably deleterious effect on wages in the region. No region has seen slower wage growth over the past 15 years.
A significant bright spot of the current recovery—nationwide and in the Midwest—has been the largely unprecedented improvement in wages for the economy’s lowest-paid workers (discussed below). However, the state of typical worker wages in the Midwest is less encouraging. The Midwest fared the worst of any region on the recovery of median wages (the wages of workers in the middle of the wage distribution) in the wake of both the Great Recession and the more recent pandemic recession (see Figure L). Between 2007 and 2010, real (inflation-adjusted) median wages fell across the Midwest, while other regions saw increases in their median wages. Median wages in the Midwest did not start increasing again until 2015.
The Midwest has fared similarly poorly on real median wage growth in the current economic recovery. Between 2019 and 2022, real median wages increased only $0.08 (0.4%) in the Midwest, while the Northeast and West saw increases of over a dollar (5.7% and 4.7%, respectively). Relative to 2007, median wages have grown only 5.8% as of 2022, slower than any other region.3
Following the last two recessions, median wages in the Midwest have grown less than in other regions: Median wage growth by region, 2007–2010 and 2019–2022
| Growth 2007–2010 | Growth 2019–2022 | |
|---|---|---|
| United States | 0.8% | 3.1% |
| Northeast | 3.1% | 5.7% |
| Midwest | -0.9% | 0.4% |
| South | 1.2% | 0.9% |
| West | 0.2% | 4.7% |
Notes: Midwest, Northeast, South, and West refer to the four geographic regions of the United States as defined by the U.S. Census Bureau. Median (50th-percentile) wages are inflation-adjusted to 2022 dollars.
Source: Economic Policy Institute analysis of Current Population Survey Outgoing Rotation Group microdata.
As a result of sluggish wage growth, wage levels in the Midwest lag almost every other region, faring only slightly better than the South—a region known for its low wages, limited worker protections, and hostility to unions (Henderson 2022). As seen in Figure M, in 2022 the median worker was paid $22.10 an hour in the Midwest, lower than the U.S. average of $22.88, and much lower than the median in the West ($24.01) and Northeast ($24.94).
Median wages in the Midwest have been below the U.S. average for the past 15 years: Median hourly wages by region, 1979–2022
| United States | Northeast | Midwest | South | West | |
|---|---|---|---|---|---|
| 1979 | $19.25 | $19.78 | $20.31 | $17.74 | $21.25 |
| 1980 | $19.11 | $19.52 | $19.96 | $17.18 | $20.91 |
| 1981 | $18.92 | $19.23 | $19.45 | $17.09 | $21.03 |
| 1982 | $18.84 | $19.60 | $19.42 | $17.29 | $21.12 |
| 1982 | $18.88 | $19.78 | $19.39 | $17.03 | $20.87 |
| 1984 | $18.96 | $20.07 | $19.18 | $16.97 | $20.87 |
| 1985 | $19.28 | $20.06 | $19.28 | $17.27 | $21.08 |
| 1986 | $19.42 | $20.75 | $19.29 | $17.86 | $21.55 |
| 1987 | $19.65 | $21.51 | $19.26 | $17.74 | $21.31 |
| 1988 | $19.36 | $21.66 | $19.12 | $17.76 | $21.20 |
| 1989 | $19.34 | $21.77 | $18.93 | $17.44 | $20.78 |
| 1990 | $19.30 | $21.79 | $18.98 | $17.40 | $20.39 |
| 1991 | $19.15 | $21.24 | $18.94 | $17.28 | $20.86 |
| 1992 | $19.34 | $21.38 | $18.64 | $17.45 | $20.56 |
| 1993 | $19.63 | $21.43 | $18.99 | $17.66 | $20.21 |
| 1994 | $19.42 | $21.47 | $18.91 | $17.56 | $20.05 |
| 1995 | $19.14 | $21.29 | $19.08 | $17.59 | $19.62 |
| 1996 | $18.83 | $21.26 | $18.88 | $17.65 | $19.71 |
| 1997 | $19.22 | $21.48 | $19.34 | $18.17 | $19.93 |
| 1998 | $19.90 | $21.74 | $20.04 | $18.25 | $20.65 |
| 1999 | $20.41 | $22.09 | $20.71 | $19.15 | $21.13 |
| 2000 | $20.52 | $22.15 | $20.69 | $19.00 | $21.07 |
| 2001 | $20.83 | $22.99 | $21.07 | $19.82 | $21.45 |
| 2002 | $21.16 | $23.06 | $21.25 | $19.76 | $21.43 |
| 2003 | $21.17 | $23.30 | $21.27 | $19.94 | $22.23 |
| 2004 | $21.42 | $23.21 | $21.46 | $20.11 | $21.99 |
| 2005 | $21.09 | $22.60 | $21.09 | $19.65 | $22.03 |
| 2006 | $21.17 | $22.79 | $21.01 | $20.08 | $21.84 |
| 2007 | $21.21 | $22.77 | $20.89 | $20.01 | $22.03 |
| 2008 | $21.05 | $22.82 | $20.54 | $20.23 | $22.31 |
| 2009 | $21.51 | $23.55 | $20.73 | $20.52 | $22.69 |
| 2010 | $21.38 | $23.49 | $20.70 | $20.24 | $22.09 |
| 2011 | $20.85 | $23.01 | $20.29 | $19.72 | $21.33 |
| 2012 | $20.59 | $22.55 | $20.26 | $19.74 | $21.43 |
| 2013 | $20.69 | $22.61 | $20.27 | $19.72 | $21.33 |
| 2014 | $20.71 | $22.67 | $20.28 | $19.72 | $21.06 |
| 2015 | $21.06 | $23.38 | $20.84 | $20.02 | $21.42 |
| 2016 | $21.43 | $23.48 | $20.95 | $20.53 | $22.05 |
| 2017 | $21.62 | $23.86 | $21.41 | $20.67 | $22.35 |
| 2018 | $21.98 | $23.49 | $21.61 | $20.90 | $22.56 |
| 2019 | $22.19 | $23.59 | $22.02 | $21.30 | $22.94 |
| 2020 | $23.70 | $26.14 | $22.84 | $22.65 | $24.63 |
| 2021 | $23.08 | $25.74 | $22.75 | $21.65 | $23.88 |
| 2022 | $22.88 | $24.94 | $22.10 | $21.50 | $24.01 |
Notes: Midwest, Northeast, South, and West refer to the four geographic regions of the United States as defined by the U.S. Census Bureau. Median (50th percentile) wages are inflation-adjusted to 2022 dollars.
Source: Economic Policy Institute analysis of Current Population Survey Outgoing Rotation Group microdata.
As shown in Figure N, the Midwest-to-U.S. median wage ratio—that is, the Midwest median wage relative to (divided by) the U.S. median wage—has been on a downward trajectory since 1979. Additionally, the relative median wage has declined more in the Midwest than in any other region—8.4% between 1979 and 2022.
In 1979, the typical worker in the Midwest earned 5.5% above the typical worker nationwide, bested only by the typical (median) worker in the West, who made 10.4% more than the national median worker. By 2007, after three decades of active hostility toward unions, trade policy that incentivized offshoring, and the erosion of various labor standards, the median worker in the Midwest was paid 1.5% less than the median worker nationwide.
Notably, this decline in the relative wages of typical Midwest workers persists today. In 2022, the median wage in the Midwest was 3.4% less than the national median—only slightly higher than the 6% lower median wage of workers in the South.
The Midwest-to-U.S. median wage ratio has declined more in the Midwest than in any other region: Relative median wage by region, select years
| South | West | Northeast | Midwest | |
|---|---|---|---|---|
| 1979 | 0.922 | 1.104 | 1.027 | 1.055 |
| 2007 | 0.943 | 1.039 | 1.074 | 0.985 |
| 2022 | 0.940 | 1.049 | 1.090 | 0.966 |
Notes: Midwest, Northeast, South, and West refer to the four geographic regions of the United States as defined by the U.S. Census Bureau. The relative median wage is the ratio of the regional median wage to the U.S. median wage, where 1 indicates that a region's median wage is identical to the national median. Median (50th percentile) wages are in nominal terms (are not adjusted for inflation).
Source: Economic Policy Institute analysis of Current Population Survey Outgoing Rotation Group microdata.
Half of Midwestern states experienced median wage growth since 2019, but 10 states’ median wages are still lower than the national median
Within the Midwest, there has been significant variability in median wage growth over the past two economic downturns, so it is useful to examine state-by-state dynamics.
While the country and the Midwest region overall fared better in the recovery from the pandemic recession than in the recovery from the Great Recession, Ohio, Iowa, South Dakota, and Missouri fared worse, and Wisconsin’s wage growth was flat (see Figure O).
Between 2007 and 2010, in the wake of the Great Recession, median wages grew most significantly in North Dakota, South Dakota, and Nebraska, largely due to the fracking boom of the early aughts and its ripple effects in neighboring states (Rusyn 2015). Yet these gains appear to have been short-lived in North Dakota and South Dakota, where median wages barely grew (North Dakota) or even declined (South Dakota) over the last three years. As demand for, and prices of, natural gas have flattened, the job market (and thus wage growth) for these states has cooled (Rickman and Wang 2018). In Nebraska, wages increased from 2019 to 2022. Nonetheless, wages in these three states remain below the national median of $22.88.
Minnesota and Illinois were the only Midwestern states with median wages above the national median in 2022, and they are the only two Midwestern states with median wages that are consistently above the national median. In Minnesota, wages have been an average of nearly two dollars ($1.87) higher than the U.S. median over the past 15 years. In Illinois, median wages have been an average of $0.64 above the national median (see Appendix Table 2).
Half of Midwestern states fared better on wage growth this recovery than in the recovery following the Great Recession, but half fared worse: Median wage growth in Midwestern states, 2007–2010 and 2019–2022
| 2007–2010 | 2019–2022 | |
|---|---|---|
| Kansas | 0.03% | 7.09% |
| Nebraska | 2.91% | 6.74% |
| Minnesota | 1.99% | 6.31% |
| Indiana | -2.17% | 5.89% |
| Michigan | -0.69% | 5.71% |
| United States | 0.79% | 3.41% |
| Illinois | 1.20% | 3.14% |
| North Dakota | 8.16% | 0.79% |
| Wisconsin | 1.95% | -0.01% |
| Iowa | 2.13% | -0.59% |
| Ohio | -0.91% | -1.40% |
| Missouri | 1.08% | -1.61% |
| South Dakota | 3.41% | -1.79% |
Note: Median wages are inflation-adjusted to 2022 dollars.
Source: Economic Policy Institute analysis of Current Population Survey Outgoing Rotation Group microdata.
Low-wage workers have seen strong gains in the current recovery, but 10th-percentile wages remain too low and the Midwest’s low-wage workforce remains large
Despite sluggish wage growth at the median, low-wage workers in the Midwest have seen large gains in the current recovery. The 10th-percentile wage—the value at which only 10% of workers are paid less and 90% of workers are paid more—has risen 8.6% since 2019. This is, by a wide margin, the fastest wage gain at the 10th percentile of any three-year business cycle since 1979 and an over-fivefold increase compared with the post–Great Recession recovery (see Figure P). These wage gains are largely the result of substantial federal spending bills passed in 2020 and 2021. These spending packages prevented a steep drop-off in economic demand, kept numerous businesses afloat, and fueled a tight job market, leading to an increase in wages for the lowest-paid workers across the whole country (Gould and deCourcy 2023).
The Midwest’s lowest-paid workers have seen strong gains over the current recovery: Real wage changes at the 10th percentile in the Midwest over five business cycles, 1979–2022
| Business cycle | 10th percentile |
|---|---|
| 1979–1982 | -12.04% |
| 1989–1992 | 4.49% |
| 2001–2004 | -1.17% |
| 2007–2010 | 1.55% |
| 2019–2022 | 8.56% |
Notes: “Midwest” refers to the 12 states that make up the region as defined by the U.S. Census Bureau. Tenth-percentile wages are inflation-adjusted to 2022 dollars.
Source: Economic Policy Institute analysis of Current Population Survey Outgoing Rotation Group microdata.
As shown in Figure Q, the “dot-com” bubble of the late 1990s and early 2000s was marked by a tight labor market and fast wage growth—at the time, the period of fastest wage growth since the 1950s. The bubble burst in 2000 and the U.S. economy entered a recession. However, wage growth at the 10th percentile continued to rise until 2002. This was due to composition effects (not for positive reasons): Low-wage workers disproportionately lose their jobs in economic downturns, so the resulting wage distribution skews upward.
In 2002, 10th-percentile wages in the Midwest were nearly identical to those in the Northeast and West (see Figure Q). However, in the decades that followed, the Midwest began to fall further behind the West and Northeast. This trend became particularly pronounced after 2010, when conservative lawmakers took power in many Midwestern states and began weakening—or failing to strengthen—labor standards.
As other regions more aggressively raised the minimum wage, Republican-controlled Midwestern states did not. Many instead adopted preemption laws preventing local jurisdictions from enacting higher minimum wages.
Every region, including the Midwest, has made significant progress on raising the wages of the lowest-paid workers over the past three decades. But despite gradual gains over time, the 10th-percentile wage—$12.45 in the Midwest in 2022—remains too low for workers to make ends meet in any part of the region (EPI 2022).
Despite significant gains, workers at the bottom of the Midwest’s pay distribution fare worse than the U.S. average: 10th-percentile hourly wages by region, 1979–2022
| Midwest | U.S. | South | West | Northeast | |
|---|---|---|---|---|---|
| 1979 | $11.16 | $11.16 | $11.01 | $11.39 | $11.27 |
| 1980 | $10.41 | $10.41 | $10.21 | $10.78 | $10.61 |
| 1981 | $10.25 | $10.25 | $10.04 | $10.66 | $10.44 |
| 1982 | $9.82 | $9.85 | $9.61 | $10.31 | $10.14 |
| 1983 | $9.41 | $9.53 | $9.30 | $9.97 | $9.83 |
| 1984 | $9.20 | $9.33 | $9.04 | $9.85 | $9.71 |
| 1985 | $8.97 | $9.21 | $8.92 | $9.80 | $9.78 |
| 1986 | $9.02 | $9.25 | $8.92 | $9.79 | $9.99 |
| 1987 | $8.90 | $9.24 | $8.82 | $9.64 | $10.03 |
| 1988 | $8.97 | $9.32 | $8.75 | $9.85 | $10.45 |
| 1989 | $9.03 | $9.25 | $8.77 | $9.89 | $10.53 |
| 1990 | $8.97 | $9.32 | $8.75 | $9.78 | $10.76 |
| 1991 | $9.31 | $9.48 | $9.08 | $10.04 | $10.46 |
| 1992 | $9.43 | $9.55 | $9.10 | $10.02 | $10.31 |
| 1993 | $9.58 | $9.70 | $9.12 | $9.84 | $10.18 |
| 1994 | $9.62 | $9.62 | $9.11 | $9.72 | $9.93 |
| 1995 | $9.56 | $9.53 | $9.35 | $9.54 | $9.83 |
| 1996 | $9.52 | $9.41 | $9.24 | $9.43 | $9.80 |
| 1997 | $9.87 | $9.68 | $9.45 | $9.70 | $10.07 |
| 1998 | $10.49 | $10.29 | $9.90 | $10.49 | $10.62 |
| 1999 | $10.61 | $10.48 | $10.31 | $10.50 | $10.59 |
| 2000 | $10.87 | $10.41 | $10.21 | $10.50 | $10.75 |
| 2001 | $10.97 | $10.74 | $10.26 | $10.84 | $11.35 |
| 2002 | $11.25 | $11.08 | $10.47 | $11.24 | $11.37 |
| 2003 | $11.05 | $11.02 | $10.46 | $11.18 | $11.20 |
| 2004 | $10.84 | $10.82 | $10.61 | $10.96 | $10.98 |
| 2005 | $10.57 | $10.56 | $10.38 | $10.71 | $10.93 |
| 2006 | $10.42 | $10.50 | $10.24 | $10.77 | $11.00 |
| 2007 | $10.58 | $10.68 | $10.30 | $11.18 | $11.18 |
| 2008 | $10.49 | $10.80 | $10.29 | $11.01 | $10.97 |
| 2009 | $10.80 | $10.90 | $10.46 | $11.28 | $11.06 |
| 2010 | $10.75 | $10.80 | $10.61 | $11.28 | $11.00 |
| 2011 | $10.47 | $10.52 | $10.35 | $10.97 | $10.95 |
| 2012 | $10.33 | $10.34 | $10.18 | $10.81 | $10.71 |
| 2013 | $10.33 | $10.41 | $10.13 | $10.81 | $10.74 |
| 2014 | $10.37 | $10.50 | $10.05 | $11.06 | $10.90 |
| 2015 | $10.96 | $11.00 | $10.42 | $11.20 | $11.14 |
| 2016 | $11.02 | $11.10 | $10.84 | $12.07 | $11.58 |
| 2017 | $11.34 | $11.56 | $10.78 | $12.00 | $11.89 |
| 2018 | $11.57 | $11.62 | $11.02 | $12.35 | $11.76 |
| 2019 | $11.47 | $11.53 | $11.33 | $12.78 | $12.48 |
| 2020 | $12.32 | $12.45 | $11.40 | $13.63 | $13.43 |
| 2021 | $12.45 | $12.65 | $11.45 | $13.88 | $13.39 |
| 2022 | $12.45 | $12.57 | $11.93 | $14.09 | $13.39 |
Note: Midwest, Northeast, South, and West refer to the four geographic regions of the United States as defined by the U.S. Census Bureau. Tenth-percentile wages are inflation-adjusted to 2022 dollars.
Source: Economic Policy Institute analysis of Current Population Survey Outgoing Rotation Group microdata.
Another way to evaluate the progress made in improving pay for low-wage workers is to look at the share of the workforce earning less than $15 per hour. As shown in Figure R, there have been steep declines nationwide in the share of workers earning less than $15 an hour in the years since 2015. During this time, the Midwest’s share has been nearly halved (28.1% in 2015, 14.7% in 2022). This shows good progress for low-wage workers overall.
Over the last two decades, the Midwest has persistently had the second-highest share of workers earning less than $15 of any region, with only the South having a higher share (20.2% in 2022). The 14.7% share of the Midwestern workforce paid less than $15 an hour in 2022 amounts to nearly 4.5 million workers throughout the region. In three states, over half a million of the state’s workers are paid less than $15 an hour: Ohio (835,000), Illinois (720,000), and Michigan (671,000) (EPI analysis of BLS-CPS various years). In Ohio, Iowa, and Kansas, that amounts to 1 in 6 workers (Figure S).
The Midwest has consistently employed the second-largest regional share of low-wage workers over the last two decades: Share of workers earning less than $15 an hour by region, 1994–2022
| Year | South | West | Northeast | Midwest |
|---|---|---|---|---|
| 1994 | 36.9% | 29.5% | 25.8% | 32.1% |
| 1995 | 36.3% | 30.4% | 25.2% | 31.8% |
| 1996 | 38.4% | 31.6% | 27.0% | 32.7% |
| 1997 | 36.4% | 31.6% | 26.6% | 31.2% |
| 1998 | 34.4% | 29.2% | 25.2% | 28.8% |
| 1999 | 31.7% | 26.3% | 23.2% | 25.9% |
| 2000 | 32.0% | 26.7% | 23.2% | 24.9% |
| 2001 | 31.7% | 26.0% | 22.0% | 25.2% |
| 2002 | 29.7% | 24.9% | 21.7% | 24.4% |
| 2003 | 29.8% | 24.1% | 20.5% | 24.2% |
| 2004 | 30.2% | 23.6% | 20.9% | 24.6% |
| 2005 | 28.7% | 23.0% | 20.5% | 24.3% |
| 2006 | 31.9% | 26.3% | 23.5% | 27.3% |
| 2007 | 31.2% | 25.1% | 23.2% | 28.2% |
| 2008 | 29.8% | 22.8% | 21.9% | 27.4% |
| 2009 | 29.5% | 23.7% | 21.1% | 26.7% |
| 2010 | 31.7% | 25.1% | 23.0% | 28.8% |
| 2011 | 31.8% | 26.1% | 22.7% | 28.8% |
| 2012 | 31.4% | 26.3% | 23.8% | 29.3% |
| 2013 | 31.5% | 26.4% | 23.3% | 28.1% |
| 2014 | 32.8% | 28.3% | 24.7% | 29.2% |
| 2015 | 31.2% | 26.6% | 22.7% | 28.1% |
| 2016 | 29.5% | 23.9% | 22.7% | 26.7% |
| 2017 | 29.1% | 23.6% | 20.8% | 25.7% |
| 2018 | 27.3% | 19.4% | 18.7% | 23.2% |
| 2019 | 26.0% | 17.5% | 17.4% | 22.2% |
| 2020 | 22.4% | 12.3% | 13.0% | 18.2% |
| 2021 | 22.0% | 9.7% | 11.5% | 16.6% |
| 2022 | 20.2% | 8.0% | 10.2% | 14.7% |
Note: Midwest, Northeast, South, and West refer to the four geographic regions of the United States as defined by the U.S. Census Bureau.
Source: Economic Policy Institute analysis of Current Population Survey Outgoing Rotation Group extracts, Version 1.0.40.
In Ohio, Iowa, and Kansas, one in six workers are paid less than $15 an hour: Share of workers earning less than $15 an hour in Midwestern states, 2022
| State | Share of workers earning less than $15 |
|---|---|
| Kansas | 17.7% |
| Iowa | 17.5% |
| Ohio | 16.8% |
| Missouri | 16.3% |
| Michigan | 16.0% |
| Indiana | 15.8% |
| Wisconsin | 14.3% |
| South Dakota | 14.0% |
| Nebraska | 13.6% |
| Illinois | 12.9% |
| North Dakota | 10.8% |
| Minnesota | 8.6% |
Source: EPI analysis of Current Population Survey Outgoing Rotation Group extracts, Version 1.0.40: Economic Policy Institute.
Safety net and worker protections
Federal legislation during the pandemic greatly expanded unemployment benefits and introduced limited but important paid leave benefits. This federal intervention ran counter to the pre-pandemic trend in most Midwestern states to weaken unemployment insurance protection and prevent local governments from enacting paid leave provisions. In the wake of the pandemic, some Midwestern states are following the federal government’s lead and strengthening the safety net. However, many more are adopting policies that mark a return to pre-pandemic austerity.
The Midwest lags other regions on paid sick leave, both as an employer benefit and as a legal right
A common statistic used to understand paid sick leave access is the share of private-sector workers who report receiving paid sick days as an employer-provided benefit. In the Midwest, 72% of private-sector workers report having access to paid sick leave.
It is important to remember that in most states employer-provided paid sick days are a benefit that can be rescinded at any time (not a right), that they vary across employers, and that access to this benefit is vastly unequal. While 93% of the highest-wage workers had access to paid sick days in 2019, only 30% of the lowest-paid workers were able to earn sick days (Gould 2020). The COVID-19 pandemic exposed these inequities and the urgent need to enact a national paid sick leave policy (Gould 2022).
In the absence of federal action on paid sick leave, many states have enacted their own laws mandating that employers provide paid sick leave to their workers. However, Midwestern states have largely failed to enact guaranteed paid sick leave (in some cases actively opposing such policies), and the region lags in access as a result.
While the Midwest (and all regions) have improved considerably on employer-provided paid sick leave access over the past 15 years, the Midwest (72%) lags the West (89%), Northeast (82%), and national average (77%) (see Figure T). Increasing access to paid sick leave since 2007 has taken a nonlinear trajectory. Between 2007 and 2015, limited progress was made in expanding access to paid sick leave, but access rates actually declined nationally and in many regions between 2012 and 2014. In 2015, the Obama administration called on states (White House 2015) to increase access to paid sick leave and later signed an executive order granting federal contract workers access to paid sick leave (DOL-WHD 2015). Rates of access increased in most Census Divisions through 2020 and have leveled off as of 2022.4
Paid sick leave access is highest in the West, home to California, Oregon, and Washington. California passed paid sick leave in 2014, followed by Oregon in 2015 and Washington in 2016. Most of the Northeast states—except Pennsylvania and New Hampshire—also have paid sick leave policies in place.
Unlike in the West and Northeast, state legislatures in the Midwest have largely failed to enact statewide measures guaranteeing access to paid sick leave. In the absence of statewide measures, localities have attempted to pass their own paid sick leave measures, but state legislatures have used preemption to block these measures from taking effect. The ability of Midwest localities to require employers to provide paid sick days has been preempted in six Midwest states: Wisconsin in 2011, followed by Indiana in 2013; Michigan, Iowa, and Missouri in 2015; and Ohio in 2016 (Wolfe et al. 2021).
Of the 12 states that make up the Midwest, only two have passed statewide paid sick leave laws—Michigan in 2018 and Minnesota in 2023. In the wake of the COVID-19 pandemic, Minnesota lawmakers enacted a law that mandates employers to provide workers with one hour of paid sick time for every 30 hours worked (six sick days per year for full-time workers). The law covers employers of all size and will benefit as many as 900,000 part-time and full-time workers in the state (Ferguson 2023). In contrast, Michigan’s paid sick leave law, as adopted, excludes a large share of the state’s workforce (Ruark 2018) and remains embroiled in legal challenges—as a result, the state effectively has no paid sick leave policy as of this publication (Miller 2023).
While paid sick leave is important for short-term absences, it is ill-suited for longer family and health-related absences. Access to paid family and medical leave (PFML) is critical for such circumstances; however, access to PFML is even less common than access to paid sick leave (Gould-Werth 2022). In the absence of a federal paid family and medical leave program, many states have implemented their own programs mandating paid time off for workers to care for a new child, care for a sick family member, or take care of their own serious illness. However, the Midwest has been similarly slow to enact paid family and medical leave or has actively preempted it. Minnesota is the only state in the region to have enacted such a program. Minnesota’s paid family and medical leave law was approved in May 2023 and will go into effect in 2026 (Weston Williamson 2023).
The Midwest has been slow to expand paid sick leave and lags most regions in access: Paid sick leave access by region, select years
| United States | Northeast | South | Midwest | West | |
|---|---|---|---|---|---|
| 2007 | 57% | 66% | 57% | 56% | 61% |
| 2015 | 61% | 66% | 61% | 58% | 60% |
| 2022 | 77% | 82% | 71% | 72% | 89% |
Notes: Midwest, Northeast, South, and West refer to the four geographic regions of the United States as defined by the U.S. Census Bureau. The chart reports the share of private-sector workers with access to paid sick leave in March of a given year. Census Region data are not available prior to 2014, so regional data has been imputed by applying the share of private-sector workers with paid sick leave access to the employed population of that division in March of the relevant year.
Sources: Bureau of Labor Statistics Current Employment Statistics and Bureau of Labor Statistics National Compensation Survey, “Employee Benefits in the United States.”
Midwestern lawmakers must strengthen unemployment insurance systems to support workers and sustain progress on its unemployment rate
Federal legislation passed during the first year of the pandemic both expanded eligibility for and the generosity of unemployment benefits. The quick jobs recovery, in the Midwest and elsewhere, served as a powerful refutation of the harmful argument that adequate unemployment benefits lead to people being “too lazy” to work (Martinez Hickey and Cooper 2021). A strong and robust unemployment insurance system is a vital tool in navigating economic downturns.
However, harmful legislation to reduce the generosity of unemployment benefits threatens to undo the Midwest’s progress on unemployment. While the standard unemployment benefit in most states is 26 weeks, four Midwestern states provide unemployment recipients with fewer than 26 weeks of benefits (CBPP 2023): Iowa and Kansas (16 weeks), Missouri and Michigan (20 weeks). In Missouri, 20 weeks of benefits are available only when the unemployment rate exceeds 9%. If the unemployment rate is below 6%, the maximum number of weeks is 13. The South is the only region where more states (7 states) provide fewer than 26 weeks of benefits. Two Midwestern states—Iowa and Wisconsin—are among the four states (the other two being Kentucky and Louisiana) that passed laws limiting unemployment benefits in 2022 (Gwyn 2022). The Iowa law cuts the number of weeks recipients can claim benefits from 26 to 16 and forces UI claimants to accept a job that pays lower wages than their previous job. The Wisconsin law would have reduced the number of weeks from 26 to 14, depending on the state’s unemployment rate, but Governor Tony Evers vetoed the legislation.
In 2023, Iowa lawmakers introduced another bill restricting access to UI by increasing the number of work searches claimants need to conduct in order to remain eligible for benefits, as well as lowering the weekly benefit rates for unemployed Iowans with three or more dependents (Iowa Legislature 2023). Missouri lawmakers introduced a bill that reduces the state’s maximum benefit duration further—from 20 weeks to eight weeks if the state unemployment rate is below 3.5% (Missouri Legislature 2023), even if unemployment exceeds this rate in some areas of the state (Missouri Budget Project 2023). Bills to restrict access to unemployment insurance were also introduced in Ohio (SB 116) and Wisconsin (SB 233). (See Ohio Legislature 2023; Wisconsin State Legislature 2023.) Each of these bills received lobbying support from the Opportunity Solutions Project, the lobbying arm of the Foundation for Government Accountability, a right-wing think tank working across the country to deregulate employment and shrink the public sector (Bogage and Paúl 2023).
However, not all Midwestern states are seeking to weaken their unemployment insurance systems; some are instead expanding unemployment benefits. In Minnesota, the state legislature recently passed a bill to extend eligibility of unemployment benefits to public school support staff during the summer months. Illinois passed a similar bill in 2020. These benefits are a lifeline to school employees, who are disproportionately women and workers of color, paid low wages, and—until recently—forced to go months without pay or unemployment benefits (Wolfe and Kamper 2021).
Instead of making unemployment insurance benefits less generous and more difficult for unemployed workers to access, the Midwest should follow the lead of states like Minnesota and Illinois. This would benefit both workers and the macroeconomy of the region.
Poverty
To assess economic well-being following the Great Recession, we rely on the official poverty measure (OPM) published by the U.S. Census Bureau. When looking at the recovery from the pandemic recession, we expand our analysis to also use the supplemental poverty measure (SPM), which became available in 2011 after the Great Recession.
The supplemental poverty measure helps capture an expanded picture of poverty in the wake of the pandemic recession
The U.S. Census Bureau publishes annual estimates of two measures of poverty each year: the official poverty measure and the supplemental poverty measure. The official poverty measure, developed in the 1960s, is calculated by comparing pretax income to a national poverty threshold that is adjusted by the size and composition of the family. This measure informs eligibility for many government programs and has often served as an instrument to assess economic well-being (Shrider and Creamer 2023). Until 2011, this was the only measure of poverty available from the U.S. Census Bureau in its annual poverty reports.
The official poverty measure has its limitations. For one, it can understate the material shortcomings individuals and families experience in their own communities. For example, the income needs of a family of four (with two adults and two children) in the lowest-cost-of-living county in the Midwest—Howell County, Missouri—are more than twice the official poverty line (EPI 2022; Shrider and Creamer 2023). Because the income needs of families exceed the low bar established by the official poverty line, progress in the official poverty rate may overstate actual progress in the economic well-being of individuals and families. The official poverty measure also understates the impact of policy. This is because it doesn’t reflect how noncash assistance, like benefits from the Supplemental Nutrition Assistance Program (SNAP), and tax credits, such as the Child Tax Credit, impact the economic well-being of individuals and families.
To address the limitations of the official poverty measure and to help complement it, the U.S. Census Bureau began to release annual estimates of the supplemental poverty measure in 2011 (U.S. Census Bureau 2022). Unlike the official poverty measure, the SPM factors geographic differences in housing costs and it accounts for major government benefits and credits that help families meet their basic needs.
A lot of these programs that help families avoid economic deprivation, like SNAP and the Child Tax Credit, were temporarily expanded during the pandemic and helped keep millions of Americans out of poverty (Banerjee and Zipperer 2022). By accounting for these transfers and for living and work expenses associated with child and medical care, the SPM provides a broader portrait of the factors that can shape the material well-being of individuals and families where they reside.
Poverty is the result of policy choices
Federal- and state-level policies can help lessen the impact that economic shocks and contractions have on the well-being of millions across the country and in the Midwest. A weak policy response to the Great Recession contributed to a large and prolonged increase in the official poverty rate in the Midwest in the years that followed.
In the wake of the pandemic recession, the official poverty rate rose only slightly. The more interesting narrative, though, is found in looking at the supplemental poverty rates. A strong policy response to the pandemic and its economic aftermath—including federal aid to state and local governments—meant that supplemental poverty rates actually declined in its wake. However, a return to the pre-pandemic status quo in 2022 led to a significant increase in supplemental poverty, as seen in recently released poverty data from the Census Bureau.
Official poverty grew and persisted after the Great Recession amid a weak policy response
Official poverty estimates in the Midwest have trended below—but tracked with—the national poverty rate since 2007 (see Figure U). The Great Recession and the weak policy response that followed (Bivens 2019) led to a relatively large increase in poverty in the Midwest, tracking with an increase nationwide. The share of individuals who struggle to make ends meet below the official poverty line increased by 2.5 percentage points nationally from 2007 to 2011, rising from 12.5% to 15%. In the Midwest, the poverty rate increased by 2.9 percentage points during the same period, rising from 11.1% in 2007 to 14% in 2011.
Weak policy response to the Great Recession kept poverty rates elevated nationally and in the Midwest: Official poverty rate, U.S. and Midwest, 2007–2021
| Year | United States | Midwest |
|---|---|---|
| 2021 | 11.6% | 10.4% |
| 2020 | 11.5% | 10.1% |
| 2019 | 10.5% | 9.7% |
| 2018 | 11.8% | 10.4% |
| 2017 | 12.3% | 11.3% |
| 2016 | 12.7% | 11.7% |
| 2015 | 13.5% | 11.7% |
| 2014 | 14.8% | 13.0% |
| 2013 | 14.5% | 12.9% |
| 2012 | 15.0% | 13.3% |
| 2011 | 15.0% | 14.0% |
| 2010 | 15.1% | 14.0% |
| 2009 | 14.3% | 13.3% |
| 2008 | 13.2% | 12.4% |
| 2007 | 12.5% | 11.1% |
Notes: The official poverty measure compares pretax cash income to a set of thresholds that vary by the size of the family and the ages of family members. These calculations do not account for the value of in-kind benefits or tax credits, nor do they consider regional differences in living costs or expenses. Midwest, Northeast, South, and West refer to the four geographic regions of the United States as defined by the U.S. Census Bureau.
Source: U.S. Census Bureau, Table 9. Poverty of People by Region [xlsx].
Some states in the Midwest were hit particularly hard by the Great Recession and the anemic policy response. Between 2009 and 2011, the average poverty rate in Indiana, Michigan, and Missouri was higher than the national average of 14.8% (see Table 3).
The misguided focus on austerity measures after the Great Recession prolonged the financial hardship of economically vulnerable Americans. Poverty was slow to recover from the Great Recession across the United States, but it was even slower to recover in the Midwest. At the national level, official poverty did not recover to its pre-recession rate until 2017, nearly a decade later. It took the region of the Midwest an additional year, until 2018, to recover its pre-recession rate (Figure U). Between 2015 and 2017, the majority of states in the region still had higher official poverty rates than a decade prior, between 2005 and 2007 (Table 3).
Poverty in the Midwest remained elevated long after the Great Recession: Three-year-average official poverty rates between 2005 and 2021 (U.S. and Midwestern states)
| 2005–2007 | 2007–2009 | 2009–2011 | 2011–2013 | 2013–2015 | 2015–2017 | 2017–2019 | 2019–2021 | |
|---|---|---|---|---|---|---|---|---|
| United States | 12.5% | 13.4% | 14.8% | 14.8% | 14.4% | 12.8% | 11.5% | 11.2% |
| Illinois | 10.7% | 11.8% | 13.8% | 13.4% | 12.7% | 11.3% | 10.4% | 9.3% |
| Indiana | 11.7% | 14.1% | 16.0% | 14.1% | 14.9% | 12.3% | 11.1% | 10.8% |
| Iowa | 10.2% | 9.7% | 10.5% | 10.5% | 11.3% | 9.7% | 8.7% | 9.5% |
| Kansas | 12.3% | 12.7% | 14.2% | 13.8% | 12.6% | 13.4% | 10.4% | 8.6% |
| Michigan | 12.0% | 12.6% | 14.9% | 14.4% | 13.4% | 12.2% | 10.7% | 11.0% |
| Minnesota | 8.5% | 10.1% | 10.6% | 10.7% | 9.0% | 8.6% | 7.4% | 7.0% |
| Missouri | 11.9% | 13.9% | 15.3% | 14.8% | 12.6% | 11.3% | 11.0% | 10.8% |
| Nebraska | 9.9% | 10.1% | 10.1% | 11.2% | 10.9% | 10.1% | 10.3% | 8.4% |
| North Dakota | 10.6% | 10.7% | 11.2% | 10.4% | 11.2% | 11.0% | 10.1% | 9.1% |
| Ohio | 12.4% | 13.3% | 14.6% | 14.7% | 14.7% | 13.3% | 12.4% | 12.2% |
| South Dakota | 10.6% | 12.2% | 14.1% | 12.5% | 13.3% | 12.9% | 10.6% | 10.2% |
| Wisconsin | 10.4% | 10.5% | 11.3% | 11.8% | 11.9% | 10.5% | 8.7% | 8.6% |
Note: The official poverty measure compares pretax cash income to a set of thresholds that vary by the size of the family and the ages of family members. These calculations do not account for the value of in-kind benefits or tax credits, nor do they consider regional differences in living costs or expenses.
Source: U.S. Census Bureau, Table 21. Percent of people in poverty by state, 3-year averages [xlsx].
Supplemental poverty declined quickly after the pandemic recession due to a bold policy response
Low-income Americans were able to weather the economic impact of the pandemic with more resilience than during and following the Great Recession. This was due in large part to the strong policy response of the federal government. This bold policy response included economic relief measures, such as stimulus payments; the temporary expansion of programs like unemployment insurance; the temporary expansion of refundable tax credits, such as the Earned Income Tax Credit (EITC) and Child Tax Credit (CTC); and increased federal assistance to state and local governments. In concrete terms, these policies prevented millions of Americans from falling below the supplemental poverty line.
Despite a larger contraction in economic activity and employment relative to the Great Recession, the COVID-19 pandemic recession led to only a relatively marginal increase in the official poverty rate. At the national level, the poverty rate rose by just over one percentage point from 10.5% in 2019 to about 11.6% in 2021. In the Midwest, the prevalence of poverty remained statistically unchanged, increasing by less than one percentage point from 9.7% in 2019 to 10.4% in 2021.
Due in large part to economic relief measures enacted in the wake of the pandemic, such as economic impact/stimulus payments and the expansion of the Child Tax Credit, the supplemental poverty rate was considerably lower than the official poverty rate at the national level and in the Midwest region between 2019 and 2021. During this three-year period, the official poverty rate stood at 11.2% at the national level and averaged about 9.6% for states in the Midwest. The supplemental poverty rate was lower than the official poverty rate by about 1.6 percentage points at the national level (9.6% vs. 11.2%) and by 2.9 percentage points for the Midwest region (6.7% vs. 9.6%) between 2019 and 2021.
During this three-year period, all states in the Midwest reflected a lower supplemental poverty rate than official poverty rate as economic relief measures enacted after the pandemic helped families avoid economic deprivation during a time of uncertainty (see Table 4). The state of Ohio recorded the highest share of individuals below the official and supplemental poverty lines between 2019 and 2021, at 12.2% and 8.1%, respectively.
Pandemic relief kept supplemental poverty rates below official poverty rates in all states in the Midwest: Supplemental and official poverty rates by state, 2019–2021 average
| Supplemental poverty rate | Official poverty rate | |
|---|---|---|
| United States | 9.6% | 11.2% |
| Illinois | 7.8% | 9.3% |
| Indiana | 7.4% | 10.8% |
| Iowa | 6.0% | 9.5% |
| Kansas | 6.0% | 8.6% |
| Michigan | 7.6% | 11.0% |
| Minnesota | 5.1% | 7.0% |
| Missouri | 7.5% | 10.8% |
| Nebraska | 6.2% | 8.4% |
| North Dakota | 7.1% | 9.1% |
| Ohio | 8.1% | 12.2% |
| South Dakota | 6.2% | 10.2% |
| Wisconsin | 5.4% | 8.6% |
Notes: The official poverty measure compares pretax cash income to a set of thresholds that vary by the size of the family and the ages of family members. These calculations do not account for the value of in-kind benefits or tax credits, nor do they consider regional differences in living costs or expenses. The supplemental poverty measure extends the official poverty measure by, among other things, accounting for government benefits, necessary expenses, and geographic variations in living costs.
Source: EPI analysis of Poverty in the United States: 2021.
Annual estimates of poverty at both the national and regional levels show that supplemental poverty fell between 2020 and 2021. During this period, the share of Americans below the supplemental poverty line declined nationally by about 1.4 percentage points, from 9.2% in 2020 to 7.8% in 2021. Similarly, the Midwest experienced a decline in supplemental poverty of about one percentage point during the same period, from 6.7% in 2020 to 5.6% in 2021. Both declines in poverty, in the Midwest and at the national level, during this period were statistically significant.
The impact of economic relief measures during the pandemic is reflected in the drop of the supplemental poverty rate in the region between 2020 and 2021. While the supplemental poverty rate in the Midwest declined during this period, the official poverty rate remained nearly unchanged, increasing from 10.1% in 2020 to 10.4% in 2021. In 2021 alone, the supplemental poverty rate for the Midwest region (5.6%) was just over half of the official poverty rate (10.4%), reflecting that more than 2.5 million Americans in the Midwest were kept out of poverty largely because of government support via transfers and social protection programs.5
The end of key economic relief measures that helped families weather the shock of the pandemic pushed millions into poverty in 2022 (Cid-Martinez and Zipperer 2023). The Midwest was not immune to the rise in poverty: The number of people in the region who fell below the poverty line increased by more than 2 million in 2022. This change reflected a rise in the supplemental poverty rate of more than 3 percentage points, from 5.6% in 2021 to 9.1% in 2022.
In 2023, state and local governments in the Midwest have an opportunity to use additional funds from the American Recue Plan to keep additional people from falling into poverty and to ensure that all families in the region are being reached by public policy (Kamper 2022b).
Unions and collective bargaining
The Midwest has historically been one of the centers of the American labor movement. The international workers’ holiday—May Day—started in Chicago in 1886, as part of a campaign in support of the eight-hour workday (Banerjee, Sherer, and Kamper 2022). The seminal moment in the labor upsurge of the 1930s was the Flint sit-down strike in Michigan (Guerrero 2017). The first statewide law for public-sector collective bargaining was passed in Wisconsin in 1959 (Nack 2019).
However, despite its history, the Midwest’s union strength has been declining precipitously. Anti-union policies enacted by many Midwestern states in the 2010s have contributed to increasing inequality and wage stagnation and have caused Midwestern unionization rates to fall faster than anywhere else in the country since the beginning of the Great Recession.
As a result of anti-union policies, the Midwest’s union density has declined over time, leading to growing inequality
Throughout the 1950s, 1960s, and 1970s, the Midwest had the highest union density of any region in the country. In 1979 it was nearly 30% and almost 5 percentage points higher than the national average.
However, union membership across the country has declined precipitously over the past 40 years, including in the Midwest. By 2022, the Midwest’s union membership rate had fallen to just 11%—less than a percentage point above the 10.1% union membership rate nationwide (see Figure V). In 1979, four Midwestern states (Illinois, Ohio, Michigan, and Wisconsin), were among the top 10 states in the country for union membership (Hirsch, MacPherson, and Vroman 2001). Today, as shown in Table 5, only Minnesota is in the top 10 (Unionstats.com 2023).
The Midwest’s higher-than-average union density has eroded over time: Union membership rates for the Midwest and the U.S., 1979–2022
| Year | Midwest union membership rate | U.S. union membership rate |
|---|---|---|
| 1979 | 28.9% | 24.1% |
| 1980 | 27.5% | 23.0% |
| 1981 | 25.3% | 21.4% |
| 1982 | ||
| 1983 | 23.7% | 20.1% |
| 1984 | 22.8% | 18.8% |
| 1985 | 21.9% | 18.0% |
| 1986 | 21.5% | 17.5% |
| 1987 | 21.2% | 17.0% |
| 1988 | 20.7% | 16.8% |
| 1989 | 20.1% | 16.4% |
| 1990 | 19.6% | 16.0% |
| 1991 | 19.5% | 16.0% |
| 1992 | 19.3% | 15.7% |
| 1993 | 19.1% | 15.7% |
| 1994 | 18.5% | 15.5% |
| 1995 | 18.0% | 14.9% |
| 1996 | 18.2% | 14.5% |
| 1997 | 17.5% | 14.1% |
| 1998 | 17.4% | 13.9% |
| 1999 | 17.1% | 13.9% |
| 2000 | 16.7% | 13.4% |
| 2001 | 16.6% | 13.3% |
| 2002 | 16.2% | 13.3% |
| 2003 | 15.8% | 12.9% |
| 2004 | 15.2% | 12.5% |
| 2005 | 15.1% | 12.5% |
| 2006 | 14.4% | 12.0% |
| 2007 | 13.8% | 12.1% |
| 2008 | 14.2% | 12.4% |
| 2009 | 14.0% | 12.3% |
| 2010 | 13.3% | 11.9% |
| 2011 | 13.5% | 11.8% |
| 2012 | 12.2% | 11.3% |
| 2013 | 12.5% | 11.3% |
| 2014 | 12.1% | 11.1% |
| 2015 | 11.9% | 11.1% |
| 2016 | 11.7% | 10.7% |
| 2017 | 11.8% | 10.7% |
| 2018 | 11.4% | 10.5% |
| 2019 | 11.2% | 10.3% |
| 2020 | 11.8% | 10.8% |
| 2021 | 11.2% | 10.3% |
| 2022 | 11.0% | 10.1% |
Notes: “Midwest” refers to the 12 states that make up the region as defined by the U.S. Census Bureau. Data refer to workers 16 and older. Union membership data are not available in the 1982 CPS. Self-employed and self-incorporated workers are excluded from the sample.
Source: Analysis of Current Population Survey, May (1973–1980) and Outgoing Rotation Group (1983–2022) extracts, EPI Current Population Survey Extracts, Version 1.0.32 (2022).
Once a union-dense region, the Midwest today has only one state in the top 10: Top 10 states for union membership, 1979 and 2022
| Rank | State | 1979 | State | 2022 |
|---|---|---|---|---|
| 1 | Michigan | 37.6% | Hawaii | 21.7% |
| 2 | New York | 35.0% | New York | 20.6% |
| 3 | Washington | 34.7% | Washington | 18.0% |
| 4 | Pennsylvania | 33.1% | Rhode Island | 16.2% |
| 5 | Ohio | 33.0% | California | 16.1% |
| 6 | Alaska | 30.7% | Alaska | 16.0% |
| 7 | West Virginia | 30.6% | Oregon | 15.5% |
| 8 | Oregon | 29.3% | New Jersey | 14.9% |
| 9 | Wisconsin | 29.3% | Minnesota | 14.3% |
| 10 | Illinois | 29.2% | Connecticut | 14.2% |
Notes: “Midwest” refers to the 12 states that make up the region as defined by the U.S. Census Bureau. Figures represent the percentage of each state’s nonagricultural wage and salary employees who are union members.
Sources: Data for 1979 are from Hirsch, MacPherson, and Vroman 2001. Data for 2022 are from Unionstats.com 2023.
Research shows that unions reduce income inequality across the economy (Banerjee et al. 2021), counteract racial and gender labor market inequities (EPI 2021), and reduce public-sector pay gaps (Morrissey and Sherer 2022). In decades when union density was higher, there was less income inequality (measured by looking at the share of income going to the top 10%) than there is today. As unionization rates have declined—particularly after 1979—income inequality has worsened. Though not the sole reason for the growth in inequality, the decline in workers’ ability to collectively negotiate for higher pay and other equity-minded policy changes has allowed businesses, corporate executives, and other wealthy interests to capture a larger share of the country’s income.
This national trend is also visible in the Midwest region, where declining unionization rates have been accompanied by a rising share of income accruing to the top 10%. Figure W shows that precipitous declines in the Midwest’s union membership rate since 1979—from 28.9% to 11.0%—were accompanied by a stark increase in income inequality, with the share of income going to the top 10% growing from one-third to nearly half of all income in the region in 2018.
Attacks on Midwesterners’ right to organize benefit the rich: Union membership and share of income going to the top 10%, Midwest and U.S., 1978–2022
| Midwest union membership rate | Midwest share of income going to the top 10% | U.S. union membership rate | U.S. share of income going to the top 10% | |
|---|---|---|---|---|
| 1978 | 27.0% | 32.7% | 23.0% | 34.0% |
| 1979 | 28.9% | 33.2% | 24.1% | 34.3% |
| 1980 | 27.5% | 33.9% | 23.0% | 33.9% |
| 1981 | 25.3% | 34.0% | 21.4% | 34.3% |
| 1982 | 34.1% | 34.6% | ||
| 1983 | 23.7% | 33.9% | 20.1% | 35.3% |
| 1984 | 22.8% | 34.4% | 18.8% | 36.5% |
| 1985 | 21.9% | 35.4% | 18.0% | 36.6% |
| 1986 | 21.5% | 37.8% | 17.5% | 36.3% |
| 1987 | 21.2% | 36.0% | 17.0% | 37.5% |
| 1988 | 20.7% | 38.2% | 16.8% | 39.3% |
| 1989 | 20.1% | 37.6% | 16.4% | 38.8% |
| 1990 | 19.6% | 37.0% | 16.0% | 38.8% |
| 1991 | 19.5% | 37.6% | 16.0% | 38.3% |
| 1992 | 19.3% | 38.4% | 15.7% | 39.4% |
| 1993 | 19.1% | 38.6% | 15.7% | 39.1% |
| 1994 | 18.5% | 38.5% | 15.5% | 39.2% |
| 1995 | 18.0% | 39.6% | 14.9% | 39.9% |
| 1996 | 18.2% | 40.1% | 14.5% | 40.8% |
| 1997 | 17.5% | 40.6% | 14.1% | 41.5% |
| 1998 | 17.4% | 41.5% | 13.9% | 41.9% |
| 1999 | 17.1% | 41.5% | 13.9% | 42.3% |
| 2000 | 16.7% | 41.2% | 13.4% | 42.8% |
| 2001 | 16.6% | 39.8% | 13.3% | 42.0% |
| 2002 | 16.2% | 40.4% | 13.3% | 41.5% |
| 2003 | 15.8% | 40.7% | 12.9% | 41.6% |
| 2004 | 15.2% | 41.5% | 12.5% | 42.4% |
| 2005 | 15.1% | 42.4% | 12.5% | 43.6% |
| 2006 | 14.4% | 43.8% | 12.0% | 44.3% |
| 2007 | 13.8% | 44.4% | 12.1% | 44.0% |
| 2008 | 14.2% | 43.7% | 12.4% | 43.6% |
| 2009 | 14.0% | 42.9% | 12.3% | 42.5% |
| 2010 | 13.3% | 44.3% | 11.9% | 43.9% |
| 2011 | 13.5% | 44.2% | 11.8% | 44.3% |
| 2012 | 12.2% | 46.2% | 11.3% | 45.6% |
| 2013 | 12.5% | 43.8% | 11.3% | 44.9% |
| 2014 | 12.1% | 44.8% | 11.1% | 45.6% |
| 2015 | 11.9% | 44.6% | 11.1% | 45.5% |
| 2016 | 11.7% | 45.2% | 10.7% | 45.3% |
| 2017 | 11.8% | 45.0% | 10.7% | 45.5% |
| 2018 | 11.4% | 45.8% | 10.5% | 45.8% |
| 2019 | 11.2% | 10.3% | 45.7% | |
| 2020 | 11.8% | 10.8% | 44.4% | |
| 2021 | 11.2% | 10.3% | 45.6% | |
| 2022 | 11.0% | 10.1% |
Notes: “Midwest” refers to the 12 states that make up the region as defined by the U.S. Census Bureau. Union data refer to workers 16 and older. Self-employed and self-incorporated workers are excluded from the sample. State and regional union membership data in 1981 are suppressed due to insufficient sample size. Union membership data are not available in the 1982 CPS. State income inequality data are not yet available beyond 2018, and national income inequality data are not yet available for 2022. Regional inequality measures for each year were constructed by weighting each state’s inequality measure by the state’s civilian noninstitutional population to calculate the state’s contribution to inequality, and then summing those contributions across all Midwestern states to create a weighted average.
Source: EPI analysis of Current Population Survey May Supplement (1978–1980) and Outgoing Rotation Group (1983–2022) extracts, Version 1.0.38, https://microdata.epi.org. Income inequality (share of income to top 10%) data are from the World Inequality Database.
Midwestern lawmakers must reverse anti-union policies to advance worker rights
There is nothing natural about the decline in unionization rates in the Midwest and across the country. Instead, this trend is the result of relentless attacks on unions by conservative lawmakers and their corporate allies seeking to maintain political control by undermining worker power (Lichtenstein 2002; Lafer 2017; Grumbach 2022). As a result of federal rulings eroding the rights of unions, the proliferation of so-called right-to-work laws at the state level, and increasingly aggressive anti-union tactics by employers, it has become increasingly difficult for workers to form and join unions—even though support for unions is at an all-time high (Mishel, Rhinehart, and Windham 2020).
But this trend can be reversed, and there is reason to believe the Midwest can lead the way. Over the course of the past decade, Midwest voters, when given the chance, have strongly supported workers’ rights to collective bargaining. In 2011, Ohioans voted 61–39 to overturn Ohio Senate Bill 5, which sought to weaken public-sector collective bargaining rights in a manner similar to Wisconsin’s Act 10 earlier that year (Fields 2011; Policy Matters Ohio 2011). In 2018, voters in Missouri overturned the state legislature’s passage of an RTW law by a 2:1 margin (Neuman 2018).
More recently, in November 2022, Illinois voters approved a constitutional amendment guaranteeing all workers organizing and collective bargaining rights (Sherer 2022). After Midwest voters elected Democratic trifectas in Minnesota and Michigan, Michigan became the first state in decades to repeal its harmful RTW statute. And recently passed industrial policy legislation—including the CHIPs and Science Act, the Infrastructure Investment and Jobs Act (IIJA), and the Inflation Reduction Act (IRA)—represent a historic opportunity to create well-paid union jobs in manufacturing, transportation, utilities, and other industries through project labor agreements, prevailing wage standards, and registered apprenticeship requirements.
Midwestern lawmakers must act to sustain pandemic recovery progress and work toward a more equitable future
The federal response to the Great Recession was marked by extreme austerity at the federal level, forcing states to address the recession’s impacts largely on their own. States diverged in their responses. For its part, the Midwest responded to the Great Recession with a shift toward austerity, and states in the region elected leaders (particularly governors) committed to that agenda. Midwestern states severely cut public employment, which hindered overall economic growth. Their mistake was to lean into austerity, prolonging economic recovery and ushering in a set of economic policies that harmed workers and their families.
Today, state policymakers face a different challenge and are on the verge of making a different mistake: failing to use historic federal investments to support workers through higher wages and benefits, boost public-sector employment, and address our broken care economy. As a result of significant federal pandemic stimulus funding and $350 billion allotted to states to spur economic recovery through the American Rescue Plan Act, the Midwest was able to avoid a prolonged and painful economic recession. On many indicators, the region has even exceeded pre-pandemic levels of economic health.
Yet states in the Midwest have yet to spend 60% of their ARPA fiscal recovery funds, leaving more than $33 billion on the table that could be used to address persistent poverty and inequality and buffer their states against future economic downturns (Treasury Department 2023). In addition, the passage of the Bipartisan Infrastructure Law, the CHIPs and Science Act, and the Inflation Reduction Act in the past two years offer substantial opportunities to create well-paid union jobs with billions of dollars in federal subsidies and investments, if policymakers embrace the opportunity (Hersh 2022).
It’s clear that austerity failed to promote economic recovery in the Midwest and around the country following the Great Recession. In the current economic recovery, Midwest policymakers have the opportunity to choose a different path. But as federal investments begin to phase out, time is running short. Midwest policymakers must act now to maximize the impact of federal relief funds by restoring the public sector, investing in workers, and building a care infrastructure that supports health and well-being for all who live there.
Appendix
The Midwest’s unemployment rate has been lower than the U.S. average for the past 13 years: Unemployment rate by region and for the U.S., 2007–2022
| Year | United States | Northeast | Midwest | South | West |
|---|---|---|---|---|---|
| 2007 | 4.6% | 4.4% | 5.1% | 4.3% | 4.7% |
| 2008 | 5.8% | 5.4% | 6.0% | 5.5% | 6.2% |
| 2009 | 9.3% | 8.3% | 9.5% | 9.0% | 10.2% |
| 2010 | 9.6% | 8.7% | 9.4% | 9.3% | 11.0% |
| 2011 | 8.9% | 8.2% | 8.4% | 8.8% | 10.3% |
| 2012 | 8.1% | 8.2% | 7.3% | 7.7% | 9.2% |
| 2013 | 7.4% | 7.5% | 7.2% | 7.0% | 8.0% |
| 2014 | 6.2% | 6.1% | 5.8% | 6.0% | 6.8% |
| 2015 | 5.3% | 5.2% | 4.8% | 5.3% | 5.7% |
| 2016 | 4.9% | 4.8% | 4.7% | 4.9% | 5.1% |
| 2017 | 4.4% | 4.5% | 4.1% | 4.3% | 4.5% |
| 2018 | 3.9% | 4.0% | 3.7% | 3.8% | 4.1% |
| 2019 | 3.7% | 3.7% | 3.6% | 3.5% | 3.9% |
| 2020 | 8.1% | 9.2% | 7.5% | 7.2% | 9.1% |
| 2021 | 5.3% | 6.4% | 4.6% | 4.8% | 6.2% |
| 2022 | 3.6% | 4.0% | 3.5% | 3.4% | 4.0% |
Note: Midwest, Northeast, South, and West refer to the four geographic regions of the United States as defined by the U.S. Census Bureau.
Source: Economic Policy Institute analysis of Current Population Survey microdata from the U.S. Census Bureau.
Midwest employment (in thousands) by industry, and industry shares of overall employment, February 2020 and May 2023
| Feb 2020 | May 2023 | ||||
|---|---|---|---|---|---|
| Industry | Employment | Industry share | Employment | Industry share | % change Feb 2020–May 2023 |
| Trade, transportation, and utilities | 6,192.0 | 18.6% | 6,350.3 | 18.5% | 2.6% |
| Education and health | 5,346.4 | 16.1% | 5,331.1 | 16.0% | -0.3% |
| Government (local, state, federal) | 4,810.8 | 14.5% | 4,721.1 | 14.1% | -1.9% |
| Professional business services | 4,274.4 | 12.9% | 4,393.0 | 13.2% | 2.8% |
| State and local government | 4,360.0 | 13.1% | 4,262.0 | 12.8% | -2.2% |
| Manufacturing | 4,071.8 | 12.3% | 4,086.6 | 12.2% | 0.4% |
| Leisure and hospitality | 3,300.6 | 9.9% | 3,212.6 | 9.6% | -2.7% |
| Financial | 1,941.8 | 5.8% | 1,952.9 | 5.8% | 0.6% |
| Construction | 1,426.8 | 4.3% | 1,498.4 | 4.5% | 5.0% |
Note: “Midwest” refers to the 12 states that make up the region as defined by the U.S. Census Bureau.
Source: EPI analysis of Bureau of Labor Statistics Current Employment Statistics data.
Real median wages in Midwestern states and the U.S., 2007–2022
| Year | United States | Indiana | Illinois | Michigan | Ohio | Wisconsin | Iowa | Nebraska | Kansas | North Dakota | Minnesota | South Dakota | Missouri |
|---|---|---|---|---|---|---|---|---|---|---|---|---|---|
| 2007 | $21.15 | $20.47 | $21.26 | $21.25 | $20.40 | $21.12 | $19.61 | $18.70 | $19.81 | $18.29 | $22.55 | $18.07 | $19.92 |
| 2008 | $20.99 | $20.55 | $21.06 | $20.86 | $20.27 | $20.55 | $19.78 | $19.10 | $19.70 | $18.07 | $22.82 | $18.20 | $19.74 |
| 2009 | $21.45 | $20.62 | $21.33 | $21.79 | $20.40 | $21.04 | $20.21 | $19.58 | $19.40 | $19.32 | $23.41 | $18.44 | $20.41 |
| 2010 | $21.32 | $20.03 | $21.52 | $21.10 | $20.22 | $21.53 | $20.03 | $19.25 | $19.81 | $19.78 | $23.00 | $18.68 | $20.13 |
| 2011 | $20.80 | $19.58 | $21.01 | $20.24 | $19.61 | $20.46 | $19.57 | $18.98 | $19.65 | $19.51 | $22.30 | $18.42 | $20.12 |
| 2012 | $20.53 | $19.28 | $21.34 | $19.77 | $19.28 | $20.19 | $19.38 | $19.06 | $19.83 | $20.54 | $22.74 | $18.39 | $19.93 |
| 2013 | $20.63 | $19.54 | $21.35 | $20.04 | $19.45 | $20.92 | $19.51 | $18.92 | $19.51 | $21.44 | $22.70 | $18.28 | $19.98 |
| 2014 | $20.65 | $19.23 | $21.02 | $20.28 | $19.66 | $20.97 | $19.35 | $19.25 | $19.50 | $20.35 | $22.91 | $18.65 | $19.97 |
| 2015 | $21.00 | $20.08 | $21.52 | $20.90 | $20.08 | $20.70 | $19.85 | $19.80 | $20.10 | $20.98 | $22.44 | $19.24 | $20.02 |
| 2016 | $21.36 | $19.56 | $22.42 | $20.71 | $20.72 | $21.39 | $19.03 | $19.83 | $19.85 | $21.83 | $23.55 | $20.17 | $20.34 |
| 2017 | $21.55 | $19.91 | $22.18 | $20.94 | $20.53 | $21.46 | $20.26 | $20.44 | $20.31 | $21.82 | $23.79 | $19.76 | $20.71 |
| 2018 | $21.91 | $20.14 | $22.85 | $21.28 | $21.05 | $21.09 | $20.89 | $19.76 | $20.38 | $22.00 | $23.90 | $20.23 | $21.08 |
| 2019 | $22.12 | $20.63 | $23.02 | $21.37 | $21.82 | $22.02 | $20.67 | $20.50 | $20.43 | $22.27 | $23.28 | $21.39 | $21.86 |
| 2020 | $23.65 | $22.12 | $24.80 | $23.75 | $22.60 | $22.88 | $22.30 | $22.58 | $20.83 | $23.33 | $24.99 | $21.54 | $21.86 |
| 2021 | $23.06 | $21.63 | $24.81 | $22.78 | $21.78 | $23.27 | $21.51 | $21.69 | $21.72 | $22.38 | $25.80 | $21.48 | $21.51 |
| 2022 | $22.88 | $21.84 | $23.74 | $22.59 | $21.51 | $22.02 | $20.55 | $21.88 | $21.88 | $22.45 | $24.75 | $21.01 | $21.51 |
Note: Median (50th-percentile) wages are inflation-adjusted to 2022 dollars.
Source: Economic Policy Institute analysis of Current Population Survey Outgoing Rotation Group microdata.
Notes
1. In this report, Midwest, Northeast, South, and West refer to the four geographic regions of the United States as defined by the U.S. Census Bureau. The 12 states of the Midwest region are Illinois, Indiana, Iowa, Kansas, Michigan, Minnesota, Missouri, Nebraska, North Dakota, Ohio, South Dakota, and Wisconsin.
2. AAPI stands for Asian American and Pacific Islander, and AIAN stands for American Indian and Alaska Native.
3. Economic Policy Institute analysis of Current Population Survey Outgoing Rotation Group microdata.
4. Census Divisions, as defined by the U.S. Census Bureau, are geographic entities between the state and Census Region level. The West Census Region comprises the Pacific and Mountain Census Divisions. The Midwest comprises the West North Central and East North Central Census Divisions. The South Census Region comprises the West South Central, East South Central, and South Atlantic Census Divisions. The Northeast Census Region comprises the Middle Atlantic and New England Census Divisions.
5. Estimate is based on the difference between the lower bound confidence interval for the official poverty measure and the upper bound confidence interval for the supplemental poverty measure.
References
Banerjee, Asha, Margaret Poydock, Celine McNicholas, Ihna Mangundayao, and Ali Sait. 2021. Unions Are Not Only Good for Workers, They’re Good for Communities and for Democracy. Economic Policy Institute, December 2021.
Banerjee, Asha, Jennifer Sherer, and Dave Kamper. 2022. “Much Has Changed Since the First May Day, but Building Worker Power and Combating Racism and Xenophobia Remain Just as Important” (blog post). Working Economics Blog (Economic Policy Institute), April 29, 2022.
Banerjee, Asha, and Ben Zipperer. 2022. “Pandemic Safety Net Programs Kept Millions out of Poverty in 2021, New Census Data Show” (blog post). Working Economics Blog (Economic Policy Institute), April 29, 2022.
Bivens, Josh. 2014. Nowhere Close: The Long March from Here to Full Employment. Economic Policy Institute, March 2014.
Bivens, Josh. 2019. What Should We Know About the Next Recession? Economic Policy Institute, April 2019.
Bogage, Jacob, and María Luisa Paúl. 2023. “The Conservative Campaign to Rewrite Child Labor Laws.” Washington Post, May 1, 2023.
Bureau of Labor Statistics, Current Employment Statistics (BLS-CES). Various years. “State Employment and Unemployment.” Accessed June 2023.
Bureau of Labor Statistics, Current Population Survey (BLS-CPS). Various years. Public data series accessed through the CPS Databases and through series reports. Accessed June 2023.
Bureau of Labor Statistics, Local Area Unemployment Statistics (BLS-LAUS). Various years. Data from the LAUS are available through the LAUS database and through series reports. Accessed June 2023.
Bureau of Labor Statistics, National Compensation Survey (BLS-NCS). Various years. Employee Benefits in the United States. Accessed June 2023.
Center on Budget and Policy Priorities (CBPP). 2023. Policy Basics: How Many Weeks of Unemployment Compensation Are Available? Updated July 2023.
Cid-Martinez, Ismael, and Ben Zipperer. 2023. “The End of Key U.S. Public Assistance Measures Pushed Millions of People into Poverty in 2022.” Working Economics Blog (Economic Policy Institute), September 12, 2023.
Cooper, David. 2018. As Wisconsin’s and Minnesota’s Lawmakers Took Divergent Paths, So Did Their Economies. Economic Policy Institute, May 2018.
Cooper, David, and Sebastian Martinez Hickey. 2022. Raising Pay in Public K–12 Schools Is Critical to Solving Staffing Shortages. Economic Policy Institute, February 2022.
Cooper, David, and Julia Wolfe. 2020. “Cuts to the State and Local Public Sector Will Disproportionately Harm Women and Black Workers.” Working Economics Blog (Economic Policy Institute), July 9, 2020.
Department of Labor, Wage and Hour Division (DOL-WHD). 2015. Fact Sheet: Final Rule to Implement Executive Order 13706, Establishing Paid Sick Leave for Federal Contractors. September 2016.
Economic Policy Institute (EPI). 2021. Unions Help Reduce Disparities and Strengthen Our Democracy (fact sheet). April 23, 2021.
Economic Policy Institute (EPI). 2022. Family Budget Calculator. March 2022.
Economic Policy Institute (EPI). 2023a. Current Population Survey Extracts, Version 1.0.40. https://microdata.epi.org.
Economic Policy Institute (EPI). 2023b. Minimum Wage Tracker. Economic Policy Institute website, updated July 1, 2023.
Federal Reserve Economic Data (FRED). 2023. “Unemployment Rate in Midwest Census Region.” Federal Reserve Bank of St. Louis. Updated August 21, 2023.
Ferguson, Dana. 2023. “MN House Passes Paid Sick and Safe Time Bill.” MPR News (Minnesota Public Radio), February 17, 2023.
Fields, Reginald. 2011. “Ohio Voters Overwhelmingly Reject Issue 2, Dealing a Blow to Gov. John Kasich.” Cleveland Plain Dealer, November 9, 2011.
Gould, Elise. 2020. “Lack of Paid Sick Days and Large Numbers of Uninsured Increase Risks of Spreading the Coronavirus.” Working Economics Blog (Economic Policy Institute), February 28, 2020.
Gould, Elise. 2022. “Over 60% of Low-Wage Workers Still Don’t Have Access to Paid Sick Days on the Job.” Working Economics Blog (Economic Policy Institute), September 23, 2022.
Gould, Elise, and Katherine deCourcy. 2023. Low-Wage Workers Have Seen Historically Fast Real Wage Growth in the Pandemic Business Cycle. Economic Policy Institute, March 2023.
Gould, Elise, Marokey Sawo, and Asha Banerjee. 2021. “Care Workers Are Deeply Undervalued and Underpaid: Estimating Fair and Equitable Wages in the Care Sectors.” Working Economics Blog (Economic Policy Institute), July 16, 2021.
Gould-Werth, Alix. 2022. Paid Sick Time and Paid Family and Medical Leave Support Workers in Different Ways and Are Both Good for the Broader U.S. Economy. Washington Center for Equitable Growth, January 2022.
Grumbach, Jake. 2022. Laboratories Against Democracy: How National Parties Transformed State Politics. Princeton, N.J.: Princeton Univ. Press.
Guerra-Cardus, Laura, and Gideon Lukens. 2023. Last 11 States Should Expand Medicaid to Maximize Coverage and Protect Against Funding Drop as Continuous Coverage Ends. Center on Budget and Policy Priorities, January 2023.
Guerrero, Julian. 2017. “The Flint Militants.” Jacobin, October 13, 2017.
Gunn, Erik. 2023. “Soaring State Job Turnover, Vacancy Rates Deepen Trend That Started with Act 10.” Wisconsin Examiner, June 7, 2023.
Gwyn, Nick. 2022. State Cuts Continue to Unravel Basic Support for Unemployed Workers. Center on Budget and Policy Priorities, June 2022.
Henderson, Kaitlyn. 2022. Best and Worst States to Work in America 2022. Oxfam America, August 2022.
Hersh, Adam. 2022. “American Rescue, Infrastructure, and Inflation-Reduction Acts Are Big Steps in Right Direction.” Testimony before the House Committee on Transportation and Infrastructure for the hearing, “Investing in Our Nation’s Transportation Infrastructure and Workers: Why It Matters,” Washington, D.C., September 29, 2022.
Hirsch, Barry, David MacPherson, and Wayne Vroman. 2001. “Estimates of Union Density by State.” Monthly Labor Review 124, no. 7 (July 2001).
Iowa Legislature. 2023. “Senate File 481: An Act Concerning Unemployment Benefits and Including Effective Date Provisions.” Introduced March 2023.
Irwin, Neil. 2023. “June Jobs Report: Prime-Age Employment Is Highest Since 2001.” Axios, July 7, 2023.
Kaiser Family Foundation (KFF). 2023. “Status of State Medicaid Expansion Decisions: Interactive Map.” July 3, 2023.
Kamper, Dave. 2022a. “Putting Minnesota’s Record-Low Unemployment Numbers in Context.” Working Economics Blog (Economic Policy Institute), July 27, 2022.
Kamper, Dave. 2022b. “State and Local Governments Have Made Transformative Investments with American Rescue Plan Recovery Funds in 2022: A Tighter Focus on Working Families and Children Will Have the Greatest Impact Going Forward.” Working Economics Blog (Economic Policy Institute), July 6, 2022.
Lafer, Gordon. 2017. The One-Percent Solution: How Corporations Are Remaking America One State at a Time. Ithaca, N.Y.: Cornell Univ. Press.
Lee, Brian P., Jennifer L. Dodge, and Norah A. Terrault. 2022. “Medicaid Expansion and Variability in Mortality in the USA: A National, Observational Cohort Study.” Lancet Public Health 7, no. 1: e48–55. https://doi.org/10.1016/S2468-2667(21)00252-8.
Lichtenstein, Nelson. 2002. State of The Union: A Century of American Labor. Princeton, N.J.: Princeton Univ. Press.
Martinez Hickey, Sebastian, and David Cooper. 2021. “Cutting Unemployment Insurance Benefits Did Not Boost Job Growth: July State Jobs Data Show a Widespread Recovery.” Working Economics Blog (Economic Policy Institute), August 24, 2021.
McKinney, Roger. 2021. “Columbia Public Schools Vows to Defend COVID-19 Mask Requirement Against AG’s Lawsuit.” Columbia Daily Tribune, August 24, 2021.
Miller, Matthew. 2023. “Michigan Supreme Court Will Rule on Tactic That Weakened Minimum Wage, Sick Leave Initiatives.” Michigan Live, June 21, 2023.
Mishel, Lawrence, Lynn Rhinehart, and Lane Windham. 2020. Explaining the Erosion of Private-Sector Unions. Economic Policy Institute, 2020.
Missouri Budget Project. 2023. Tying Unemployment Assistance to the State Unemployment Rate Would Weaken Protections, Slow Down Economic Recovery in the Future. February 2023.
Missouri Legislature. 2023. “SB 21: Modifies the Duration of Unemployment Benefits Based on the Unemployment Rate.” Passed February 2023.
Missouri Secretary of State. 2018. “Official Election Results.” Announced by the Board of State Canvassers on Monday, August 27, 2018.
Morrissey, Monique, and Jennifer Sherer. 2022. Unions Can Reduce the Public-Sector Pay Gap: Collective Bargaining Rights and Local Government Workers. Economic Policy Institute, March 2022.
Nack, David. 2019. “Wisconsin Public Worker Unions Post Act 10.” School for Workers News (University of Wisconsin-Madison), September 19, 2019.
Neuman, Scott. 2018. “Missouri Blocks Right-To-Work Law.” NPR News (National Public Radio), August 8, 2018.
Ohio Legislature: 135th General Assembly. 2023. “Senate Bill 116: Revise Ohio’s Unemployment Compensation Law.” Introduced April 6, 2023.
Pabst, Georgia. 2011. “Walker Signs Law Pre-empting Sick Day Ordinance.” Milwaukee Journal Sentinel, May 5, 2011.
Policy Matters Ohio. 2011. Benefits of Bargaining: How Public Worker Negotiations Improve Ohio Communities. Policy Matters Ohio, 2011.
Rickman, Dan, and Hongbo Wang. 2018. “What Goes Up Must Come Down? A Case Study of the Recent Oil and Gas Employment Cycle in Louisiana, North Dakota, and Oklahoma.” MPRA Paper no. 87252, June 2018.
Ruark, Peter. 2018. “‘Shame Duck’ Tradition Is Alive and Well in Michigan.” Blog: Factually Speaking (Michigan League for Public Policy), November 30, 2018.
Rusyn, Eugene. 2015. “A Look at the Complexity of Fracking in North Dakota.” Yale Center for Environmental Law and Policy, October 2015.
Sherer, Jennifer. 2022. Illinois Workers’ Rights Amendment Sets New Bar for State Worker Power Policy. Economic Policy Institute, December 2022.
Sherer, Jennifer. 2023. Why ‘Right-to-Work’ Was Always Wrong for Michigan. Economic Policy Institute, March 2023.
Shields, Michael, and Andrew Stettner. 2020. Promises Unfulfilled: Manufacturing in the Midwest. Policy Matters Ohio, September 2020.
Shrider, Emily A., and John Creamer. 2023. Poverty in the United States: 2022. U.S. Census Bureau, September 2023.
Tope, Daniel, Justin Pickett, and Ted Chiricos. 2015. “Anti-Minority Attitudes and Tea Party Movement Membership.” Social Science Research 51 (May 2015): 322–337. https://doi.org/10.1016/j.ssresearch.2014.09.006.
Treasury Department. 2023. “April 2023 Quarterly and Annual Reporting: Data Through March 31, 2023” (downloadable XLS file). Accessed July 20, 2023.
Unionstats.com. 2023. Union Membership, Coverage, and Earnings from the CPS. Unionstats.com website, accessed July 21, 2023.
U.S. Census Bureau. 2022. Measuring America: How the U.S. Census Bureau Measures Poverty. June 2022.
U.S. Census Bureau. Various years. “Table 9. Poverty of People by Region.” In Historical Poverty Tables: People and Families—1959 to 2022, accessed August 2023.
U.S. Census Bureau. Various years. “Table 21. Percent of People in Poverty by State.” In Historical Poverty Tables: People and Families—1959 to 2022, accessed August 2023.
Weston Williamson, Molly. 2023. Fast Facts About Minnesota’s New Paid Leave Law. Center for American Progress, May 2023.
White House. 2015. “Remarks by the President in State of the Union Address.” Office of the Press Secretary, January 20, 2015.
Wisconsin State Legislature. 2023. “Senate Bill 233: […] Relating to: The Amount of Benefits Received Under the Unemployment Insurance Law.” Introduced April 14, 2023.
Wolfe, Julia, and Dave Kamper. 2021. “Illinois Extended Unemployment Benefits to School Workers in the Summer, and Minnesota Should Follow Suit.” Working Economics Blog (Economic Policy Institute), May 12, 2021.
Wolfe, Julia, Sebastian Martinez Hickey, Dave Kamper, and David Cooper. 2021. Preempting Progress in the Heartland: State Lawmakers in the Midwest Prevent Shared Prosperity and Racial, Gender, and Immigrant Justice by Interfering in Local Policymaking. Economic Policy Institute, October 2021.