May 7, 2009 — EPI Jobs Picture preview
Seven million jobs needed to return to pre-recession employment levels
by Lawrence Mishel and Heidi Shierholz
Before this recession runs its course, it will have become the longest and deepest economic downturn since the Great Depression. Tomorrow, the Bureau of Labor Statistics will release its April employment report, detailing how the labor market fared during the 16th month of the recession. Today, the latest labor market data available are for March 2009, 15 months into the recession that officially began in December 2007. In order to see how this recession stacks up against previous post-war recessions, we compare labor market indicators at the start of recessions to their values 15 months later. This document will be updated tomorrow to reflect the new April data.
While the current unemployment rate — 8.5% in March — is not at an historical high, it has increased much more rapidly during this recession than in other post-war recessions. Table 1 shows the unemployment rate at the start of each recession over the last 50 years along with the unemployment rate 15 months later. The unemployment rate increased 3.6 percentage points in the first 15 months of the current recession, a far steeper increase than any of the previous recessions. In particular, during the first fifteen months of the deep recession of 1981/1982, the unemployment rate increased only 3.2 percentage points. In other words, while the unemployment rate was higher during the early 1980s than it is today, it was also much higher going into the recession. U.S. workers in the early 1980s saw a smaller increase in unemployment than what workers are experiencing today. Figure A shows this graphically; the unemployment rate at the onset of the current recession was at a lower level lower than both the 1981 and 1990 recessions. But it has increased much more dramatically.
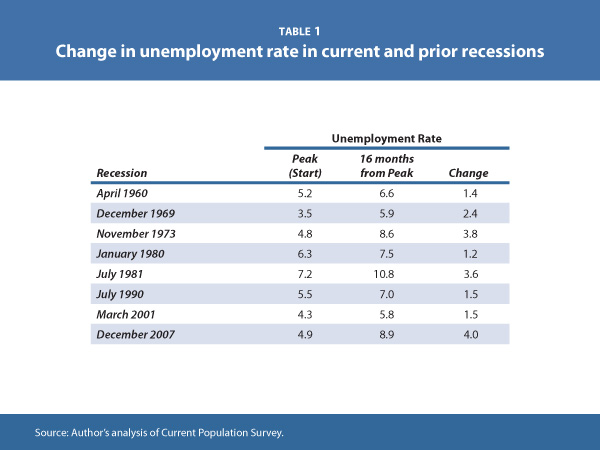
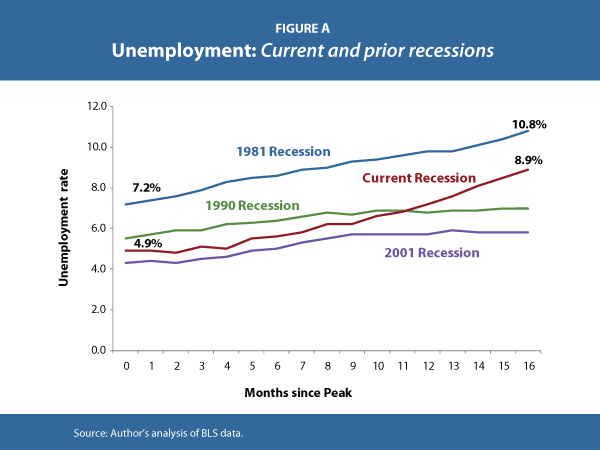
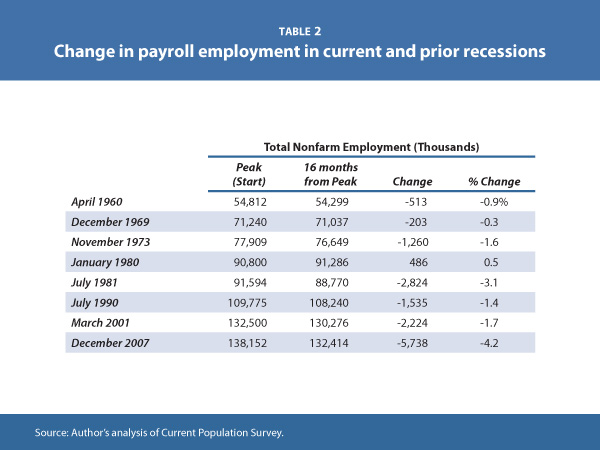
Table 2 shows total nonfarm employment at the start of each recession over the last 50 years along with employment 15 months later. Employment has decreased much more during this recession — 3.7% — than in prior recessions. In particular, during the first fifteen months of the recession of 1981/1982, employment declined by only 2.9%. Figure B shows this graphically; employment loss during the first eight months of this recession was relatively mild compared to previous recessions but then it fell off a cliff and now far surpasses the employment loss of the early 1980s.
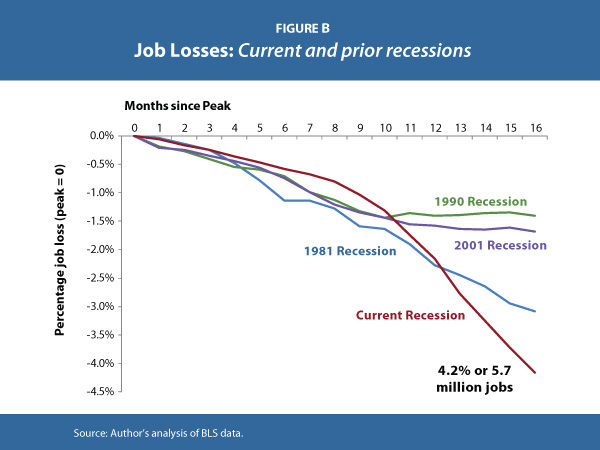
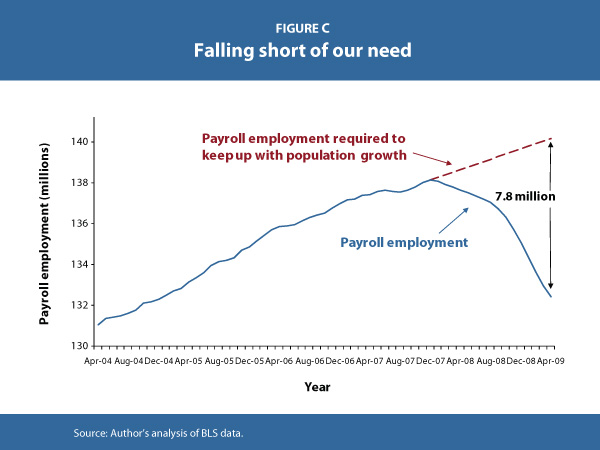
Furthermore, while the labor market has shed 5.1 million jobs since the start of the recession, it is important to keep in mind that in those 15 months, the population has continued to grow. Just to keep up with population growth, the economy must add approximately 127,000 jobs every month, which means 1.9 million jobs, should have been added over this period. In other words, the economy is now 7 million jobs below what is needed to maintain pre-recession employment levels.
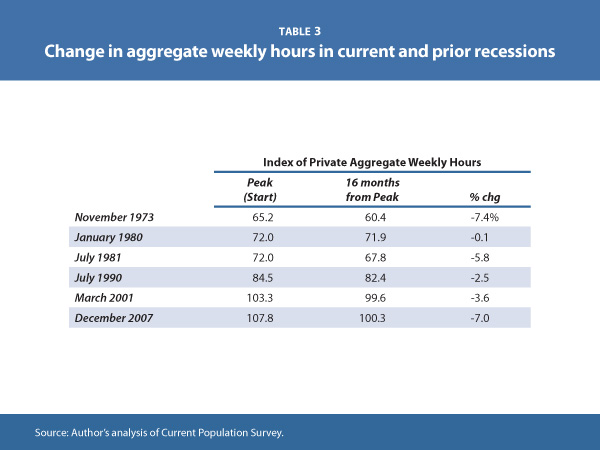
Total hours worked in the economy is a more comprehensive measure of labor market weakness than employment because it captures both job loss and reductions in hours for workers who keep their jobs. Table 3 shows an index of aggregate weekly hours of production and nonsupervisory workers on private nonfarm payrolls at the start of each recession over the last forty years along with its value 15 months later. Again, aggregate hours during the current recession are falling at a faster rate than in previous recessions; over the course of this recession, aggregate hours have fallen 6.4%, whereas in the first 15 months of the recession of 1981/1982, aggregate hours fell by 5.7%.
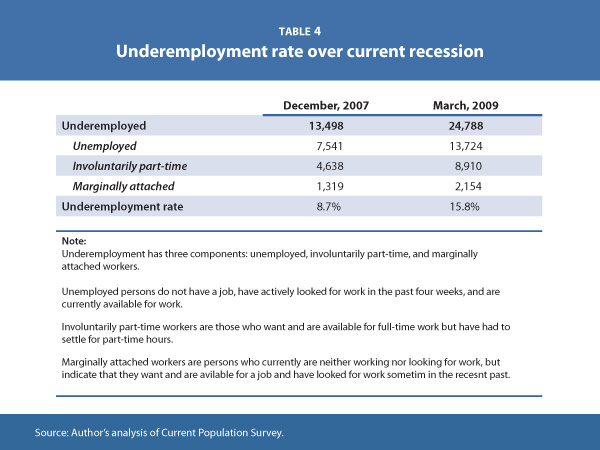
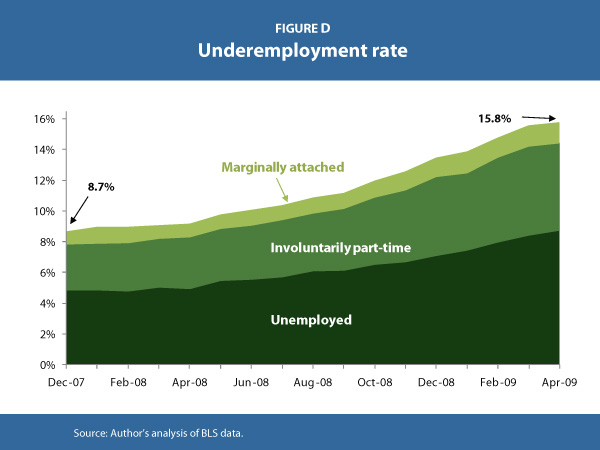
Underemployment is a more comprehensive measure of labor market slack that includes not just the unemployed, but also “involuntarily” part-time workers (workers who want full-time work but can’t get the hours) and marginally-attached workers (jobless workers who want a job but are not actively seeking work and are therefore not counted as officially unemployed). Underemployment data as currently measured are only available since the mid-1990s, so it is not possible to compare the current recession to the recession of 1981 on this measure. Table 4 shows underemployment over the current recession. In particular, the number of involuntarily part-time workers has nearly doubled since the start of the recession, from 4.6 million to 9.0 million. Over this time, the underemployment rate has increased from 8.7% to 15.6%, so that now 24.4 million people — one out of every six US workers — are either unemployed or underemployed. Figure D shows the components of underemployment over the course of the recession; the sharp increase in involuntarily part-time workers is apparent.
In March, nearly one out of every four unemployed workers had been unemployed for more than six months. One of the reasons jobless workers are getting stuck in unemployment for long periods is the dramatic reduction in job openings since the start of the recession. There were 4.3 million job openings in December 2007 but only 3.0 million job openings in February 2009 (the latest data available). In February, there were 12.5 million unemployed workers, which translates to more than four unemployed workers per job opening. By comparison, at the start of the recession, there were 1.7 unemployed workers per job opening, less than half of the current figure.
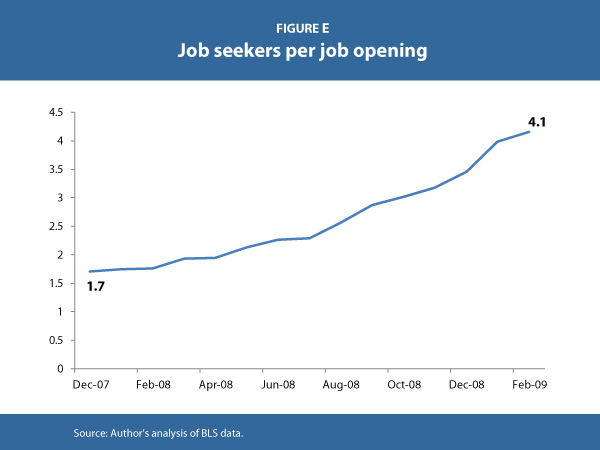
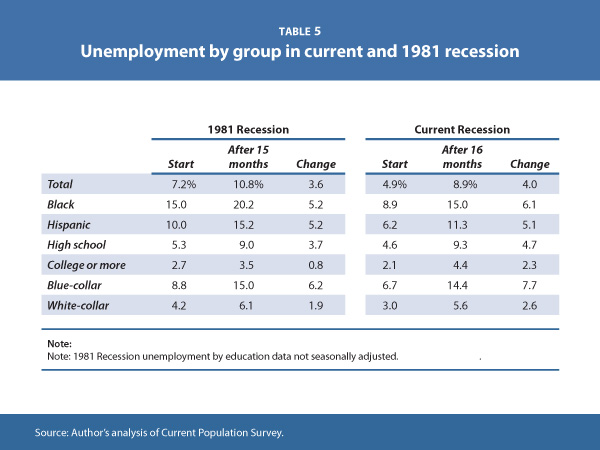
Table 5 compares unemployment for various demographic subgroups over the recession of 1981/1982 and over the current recession. In almost all categories, the increase in unemployment over the current recession has been steeper. A key factor to note is that while unemployment rates and increases are much larger in all recessions for workers with lower levels of schooling and for blue-collar workers, the current recession has seen bigger increases in unemployment among white collar and college-educated workers than earlier recessions. The depth and severity of this recession means that workers who have historically been relatively sheltered from economic downturns are also experiencing adverse labor market outcomes. College-educated workers have seen their unemployment rate more than double over this recession, while in the first 15 months of the recession of 1981/1982 unemployment for people with a college degree increased by only half of a percentage point.
Check back tomorrow to read further analysis in EPI’s Jobs Picture.