The U.S. Census Bureau reported that the annual U.S. trade deficit in goods and services increased from $476.4 billion in 2013 to $505.0 billion in 2014, an increase of $28.6 billion (6.0 percent). This reflected a $6.5 billion (2.9 percent) increase in the services trade surplus and a $35.2 billion (5.0 percent) increase in the goods trade deficit.
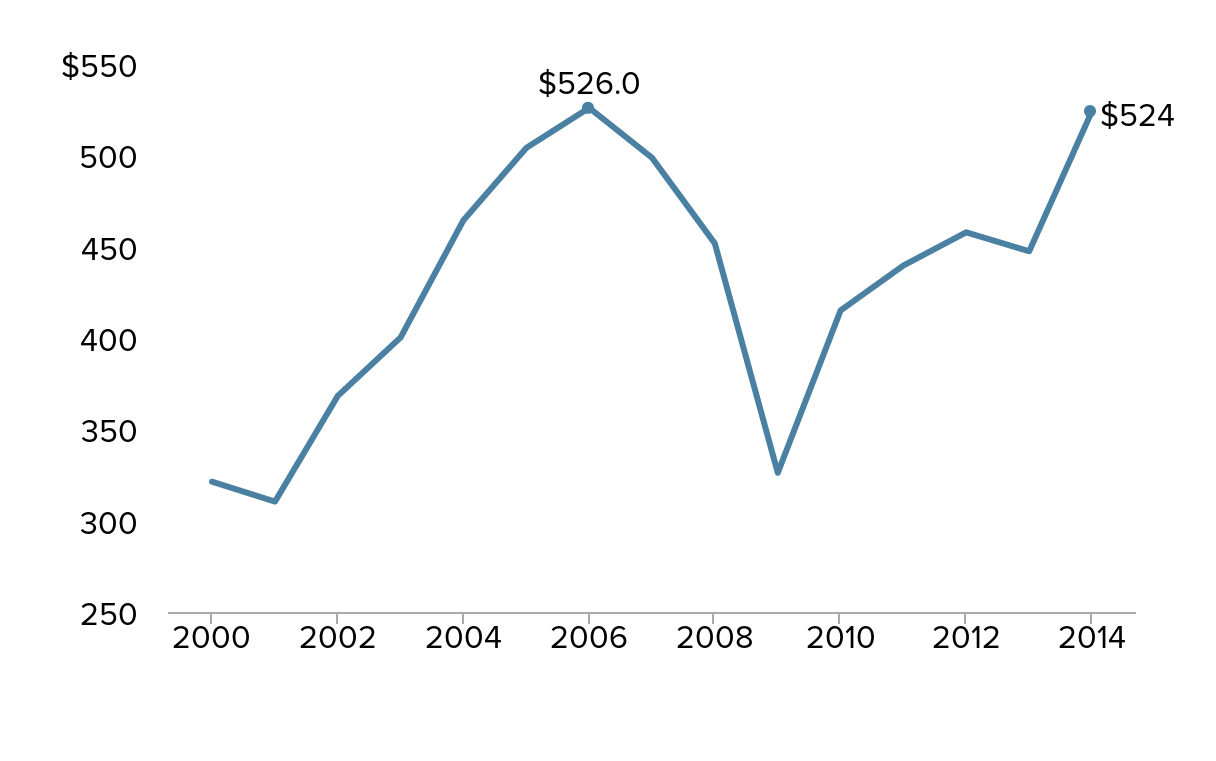
However, the small increase in the goods trade deficit masked important structural shifts in U.S. goods trade. Although the U.S. goods trade deficit in petroleum goods declined by $43.7 billion (18.8 percent), the U.S. trade deficit in nonpetroleum goods increased by $77.5 billion (17.0 percent). The increased trade deficit in nonpetroleum goods is largely explained by the increase in the U.S. trade deficit in manufactured products, shown in Figure A.
U.S. manufacturing goods trade deficit,* 2000–2014 (billions of nominal dollars)
| Year | U.S. manufacturing trade deficit (billions of nominal dollars) |
|---|---|
| 2000 | $321.346 |
| 2001 | 310.436 |
| 2002 | 368.311 |
| 2003 | 400.294 |
| 2004 | 464.444 |
| 2005 | 504.103 |
| 2006 | 526.003 |
| 2007 | 498.68 |
| 2008 | 451.794 |
| 2009 | 326.209 |
| 2010 | 415.094 |
| 2011 | 439.682 |
| 2012 | 457.855 |
| 2013 | 447.472 |
| 2014 | 524.222 |

* Includes manufacturing re-exports, reported on a Census basis.
Source: Author's analysis of U.S. Census Bureau, U.S. international Trade in Goods and Services (FT900), various years
The U.S. trade deficit in manufactured products increased to $524.2 billion in 2014, an increase of $76.8 billion (17.2 percent) from 2013. This was nearly an all-time high, as shown in the figure. Growing trade deficits in manufactured products have been a primary driver in the displacement of U.S. manufacturing jobs since 2000. Trade deficits in manufactured products, which have increased over the past five years, remain a substantial threat to the recovery of U.S. manufacturing employment and production.
Growing U.S. goods trade deficits reflect reduced demand for U.S.-made goods, especially manufactured products, which make up more than 85 percent of U.S. goods exports. China, and the members of the proposed Trans-Pacific Partnership (TPP), were important contributors to the growing U.S. trade deficit in manufactured goods in 2014. (In addition to the U.S., the TPP includes Australia, Brunei Darussalam, Canada, Chile, Japan, Malaysia, Mexico, New Zealand, Peru, Singapore, and Vietnam.)
The U.S. goods trade deficit with China increased by $23.9 billion (7.5 percent) in 2014, to $342.6 billion and the U.S. trade deficit with the 11 TPP partners increased by $1.4 billion (0.9 percent) to 155.0 billion (which includes re-exports).
The U.S. dollar gained 13.3 percent against other major currencies between December 2013 and January 2014 (according to the Board of Governors of the Federal Reserve System) as a result of currency manipulation by Japan and the slowdown in Europe. Dollar appreciation reduces the competitiveness of U.S. exports and increases the U.S. goods trade deficit.
U.S. trade and investment deals such as the North American Free Trade Agreement and the U.S.-Korea Free Trade Agreement, and China’s membership in the World Trade Organization, have resulted in growing U.S. trade deficits and job losses and downward pressure on U.S. wages. Several members of the proposed TPP are well known currency manipulators, including Malaysia, Singapore, and Japan. In fact, Japan is the world’s second largest currency manipulator, behind China. The United States should not sign a trade and investment deal with these countries that does not include strong prohibitions on currency manipulation.