Measuring the job shortfall since February 2020: Actual and counterfactual employment, January 2019–December 2024
| date | Actual nonfarm payroll employment | Employment if it had continued growing at the pre-recession level | Employment if it had grown with population growth since February 2020 |
|---|---|---|---|
| Sep-2019 | 151.4 | NA | NA |
| Oct-2019 | 151.5 | NA | NA |
| Nov-2019 | 151.7 | NA | NA |
| Dec-2019 | 151.8 | NA | NA |
| Jan-2020 | 152.0 | NA | NA |
| Feb-2020 | 152.3 | 152.3 | 152.3 |
| Mar-2020 | 150.9 | 152.5 | 152.4 |
| Apr-2020 | 130.4 | 152.7 | 152.5 |
| May-2020 | 133.0 | 152.9 | 152.6 |
| Jun-2020 | 137.7 | 153.1 | 152.7 |
| Jul-2020 | 139.2 | 153.2 | 152.8 |
| Aug-2020 | 140.8 | 153.4 | 152.9 |
| Sep-2020 | 141.8 | 153.6 | 153.0 |
| Oct-2020 | 142.5 | 153.8 | 153.1 |
| Nov-2020 | 142.8 | 154.0 | 153.2 |
| Dec-2020 | 142.5 | 154.2 | 153.3 |
| Jan-2021 | 142.9 | 154.4 | 153.4 |
| Feb-2021 | 143.4 | 154.6 | 153.5 |
| Mar-2021 | 144.3 | 154.7 | 153.6 |
| Apr-2021 | 144.6 | 154.9 | 153.7 |
| May-2021 | 145.0 | 155.1 | 153.8 |
| Jun-2021 | 145.8 | 155.3 | 153.9 |
| Jul-2021 | 146.8 | 155.5 | 154.0 |
| Aug-2021 | 147.2 | 155.7 | 154.1 |
| Sep-2021 | 147.7 | 155.9 | 154.2 |
| Oct-2021 | 148.6 | 156.0 | 154.3 |
| Nov-2021 | 149.2 | 156.2 | 154.4 |
| Dec-2021 | 149.8 | 156.4 | 154.5 |
| Jan-2022 | 150.0 | 156.6 | 154.6 |
| Feb-2022 | 150.9 | 156.8 | 154.7 |
| Mar-2022 | 151.4 | 157.0 | 154.8 |
| Apr-2022 | 151.6 | 157.2 | 154.9 |
| May-2022 | 151.9 | 157.4 | 155.0 |
| Jun-2022 | 152.3 | 157.5 | 155.1 |
| Jul-2022 | 153.0 | 157.7 | 155.2 |
| Aug-2022 | 153.3 | 157.9 | 155.3 |
| Sep-2022 | 153.5 | 158.1 | 155.4 |
| Oct-2022 | 153.9 | 158.3 | 155.5 |
| Nov-2022 | 154.2 | 158.5 | 155.6 |
| Dec-2022 | 154.3 | 158.7 | 155.7 |
| Jan-2023 | 154.8 | 158.8 | 155.8 |
| Feb-2023 | 155.1 | 159.0 | 155.9 |
| Mar-2023 | 155.2 | 159.2 | 156.0 |
| Apr-2023 | 155.5 | 159.4 | 156.1 |
| May-2023 | 155.8 | 159.6 | 156.2 |
| Jun-2023 | 156.0 | 159.8 | 156.3 |
| Jul-2023 | 156.2 | 160.0 | 156.4 |
| Aug-2023 | 156.4 | 160.2 | 156.5 |
| Sep-2023 | 156.7 | 160.3 | 156.6 |
| Oct-2023 | 156.8 | 160.5 | 156.7 |
| Nov-2023 | 157.0 | 160.7 | 156.8 |
| Dec-2023 | 157.3 | 160.9 | 156.9 |
| Jan-2024 | 157.5 | 161.1 | 157.0 |
| Feb-2024 | 157.8 | 161.3 | 157.1 |
| Mar-2024 | 158.1 | 161.5 | 157.2 |
| Apr-2024 | 158.2 | 161.7 | 157.3 |
| May-2024 | 158.4 | 161.8 | 157.4 |
| Jun-2024 | 158.5 | 162.0 | 157.6 |
| Jul-2024 | 158.7 | 162.2 | 157.7 |
| Aug-2024 | 158.8 | 162.4 | 157.8 |
| Sep-2024 | 159.0 | 162.6 | 157.9 |
| Oct-2024 | 159.1 | 162.8 | 158.0 |
| Nov-2024 | 159.3 | 163.0 | 158.1 |
| Dec-2024 | 159.5 | 163.1 | 158.2 |
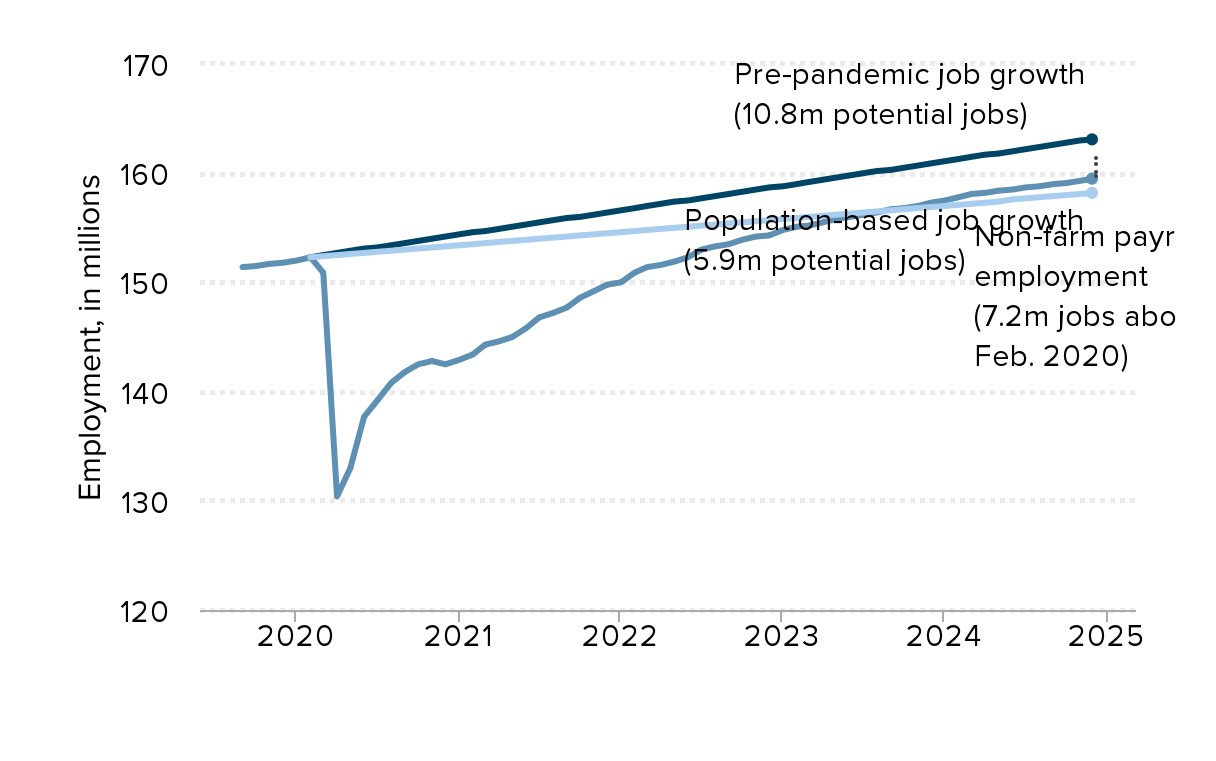
Source: EPI analysis of Bureau of Labor Statistics Current Population Survey public data series.
Employment change by industry (thousands) between June 2023 and July 2023
| Industry | Employment change, one month |
|---|---|
| Education and health services | 100 |
| Other services | 20 |
| Construction | 19 |
| Financial activities | 19 |
| Wholesale trade | 17.9 |
| Leisure and hospitality | 17 |
| Government | 15 |
| Retail services | 8.5 |
| Mining and logging | 1 |
| Utilities | -0.2 |
| Manufacturing | -2 |
| Professional and business services | -8 |
| Transportation and warehousing | -8.4 |
| Information | -12 |
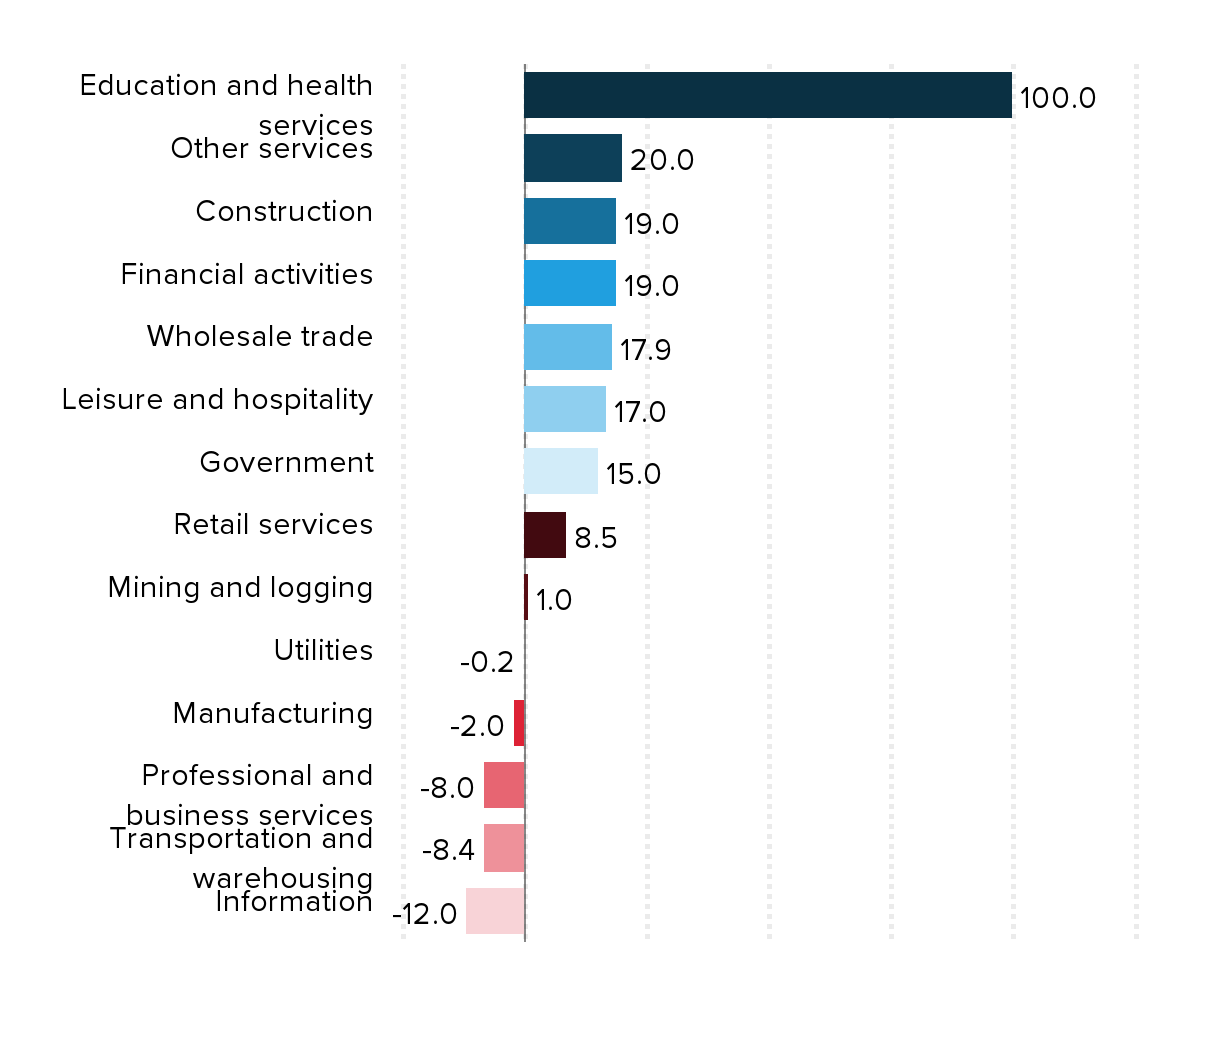
Source: Bureau of Labor Statistics' (BLS) Current Employment Statistics, Establishment Survey (CES) public data series.
Unemployment rates for Black, Hispanic, and white workers, January 2019–May 2022
| Month | Black | White | Hispanic |
|---|---|---|---|
| 2019-01-01 | 6.9% | 3.5% | 4.7% |
| 2019-02-01 | 7.0% | 3.2% | 4.3% |
| 2019-03-01 | 6.5% | 3.3% | 4.5% |
| 2019-04-01 | 6.6% | 3.2% | 4.1% |
| 2019-05-01 | 6.1% | 3.3% | 4.2% |
| 2019-06-01 | 6.0% | 3.3% | 4.3% |
| 2019-07-01 | 5.6% | 3.3% | 4.4% |
| 2019-08-01 | 5.2% | 3.4% | 4.2% |
| 2019-09-01 | 5.4% | 3.2% | 4.0% |
| 2019-10-01 | 5.6% | 3.3% | 4.2% |
| 2019-11-01 | 5.7% | 3.3% | 4.3% |
| 2019-12-01 | 6.2% | 3.1% | 4.3% |
| 2020-01-01 | 6.1% | 3.0% | 4.3% |
| 2020-02-01 | 6.0% | 3.0% | 4.4% |
| 2020-03-01 | 6.8% | 3.9% | 5.9% |
| 2020-04-01 | 16.7% | 14.1% | 18.8% |
| 2020-05-01 | 16.7% | 12.3% | 17.6% |
| 2020-06-01 | 15.3% | 10.1% | 14.5% |
| 2020-07-01 | 14.4% | 9.2% | 12.8% |
| 2020-08-01 | 12.8% | 7.4% | 10.6% |
| 2020-09-01 | 12.0% | 7.0% | 10.4% |
| 2020-10-01 | 10.8% | 6.0% | 8.9% |
| 2020-11-01 | 10.3% | 5.9% | 8.6% |
| 2020-12-01 | 9.9% | 6.0% | 9.4% |
| 2021-01-01 | 9.2% | 5.7% | 8.6% |
| 2021-02-01 | 9.9% | 5.6% | 8.4% |
| 2021-03-01 | 9.6% | 5.4% | 7.7% |
| 2021-04-01 | 9.7% | 5.3% | 7.7% |
| 2021-05-01 | 9.1% | 5.1% | 7.1% |
| 2021-06-01 | 9.2% | 5.2% | 7.2% |
| 2021-07-01 | 8.2% | 4.8% | 6.4% |
| 2021-08-01 | 8.7% | 4.5% | 6.2% |
| 2021-09-01 | 7.8% | 4.2% | 6.1% |
| 2021-10-01 | 7.8% | 3.9% | 5.7% |
| 2021-11-01 | 6.5% | 3.7% | 5.2% |
| 2021-12-01 | 7.1% | 3.2% | 4.9% |
| 2022-01-01 | 6.9% | 3.4% | 4.9% |
| 2022-02-01 | 6.6% | 3.3% | 4.4% |
| 2022-03-01 | 6.2% | 3.2% | 4.2% |
| 2022-04-01 | 5.9% | 3.2% | 4.1% |
| 2022-05-01 | 6.2% | 3.2% | 4.3% |
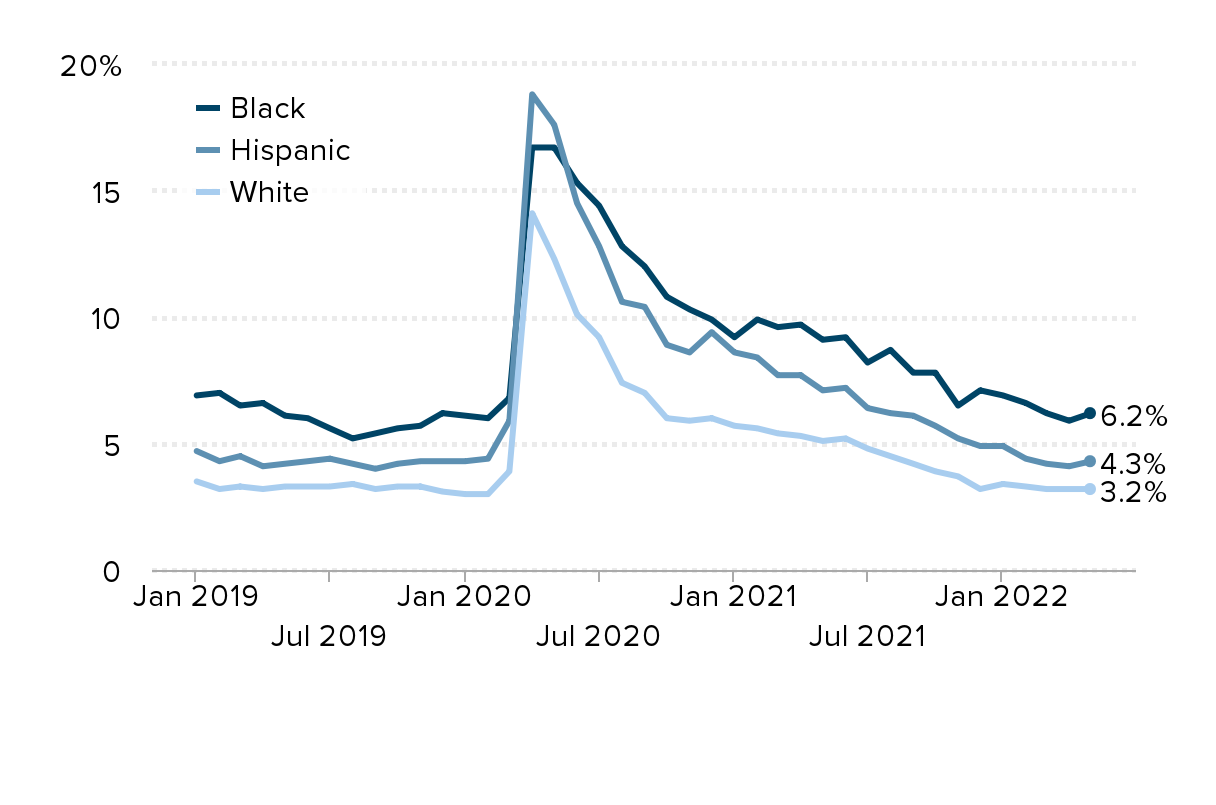
Source: Seasonally adjusted Federal Reserve Economic Data.
Labor force participation rates for Black, Hispanic, and white workers, January 2019–May 2022
| Month | Black | White | Hispanic |
|---|---|---|---|
| 2019-01-01 | 63.0% | 63.0% | 67.2% |
| 2019-02-01 | 62.6% | 63.0% | 66.5% |
| 2019-03-01 | 62.0% | 63.0% | 66.8% |
| 2019-04-01 | 62.4% | 62.8% | 66.0% |
| 2019-05-01 | 62.5% | 62.9% | 66.3% |
| 2019-06-01 | 61.8% | 62.9% | 66.4% |
| 2019-07-01 | 62.6% | 63.0% | 66.5% |
| 2019-08-01 | 62.1% | 63.1% | 66.7% |
| 2019-09-01 | 62.4% | 63.2% | 67.1% |
| 2019-10-01 | 62.4% | 63.2% | 67.2% |
| 2019-11-01 | 62.2% | 63.2% | 67.3% |
| 2019-12-01 | 63.1% | 63.2% | 67.1% |
| 2020-01-01 | 62.8% | 63.3% | 67.8% |
| 2020-02-01 | 63.2% | 63.3% | 68.0% |
| 2020-03-01 | 61.8% | 62.6% | 66.9% |
| 2020-04-01 | 58.5% | 60.3% | 63.3% |
| 2020-05-01 | 59.7% | 61.0% | 64.2% |
| 2020-06-01 | 59.9% | 61.6% | 65.5% |
| 2020-07-01 | 60.2% | 61.5% | 64.7% |
| 2020-08-01 | 60.1% | 61.8% | 65.4% |
| 2020-09-01 | 59.8% | 61.6% | 64.9% |
| 2020-10-01 | 60.2% | 61.8% | 65.6% |
| 2020-11-01 | 60.4% | 61.5% | 65.4% |
| 2020-12-01 | 59.9% | 61.6% | 65.3% |
| 2021-01-01 | 60.3% | 61.4% | 65.0% |
| 2021-02-01 | 60.1% | 61.4% | 65.4% |
| 2021-03-01 | 60.7% | 61.4% | 65.4% |
| 2021-04-01 | 61.2% | 61.5% | 65.2% |
| 2021-05-01 | 61.0% | 61.4% | 65.1% |
| 2021-06-01 | 61.5% | 61.4% | 65.4% |
| 2021-07-01 | 60.8% | 61.6% | 65.6% |
| 2021-08-01 | 61.5% | 61.5% | 65.5% |
| 2021-09-01 | 61.3% | 61.5% | 65.6% |
| 2021-10-01 | 61.0% | 61.5% | 65.7% |
| 2021-11-01 | 60.7% | 61.7% | 66.3% |
| 2021-12-01 | 60.8% | 61.7% | 66.0% |
| 2022-01-01 | 62.0% | 62.0% | 66.4% |
| 2022-02-01 | 62.2% | 62.2% | 66.6% |
| 2022-03-01 | 62.1% | 62.3% | 66.4% |
| 2022-04-01 | 62.3% | 61.9% | 66.1% |
| 2022-05-01 | 63.0% | 61.9% | 66.5% |
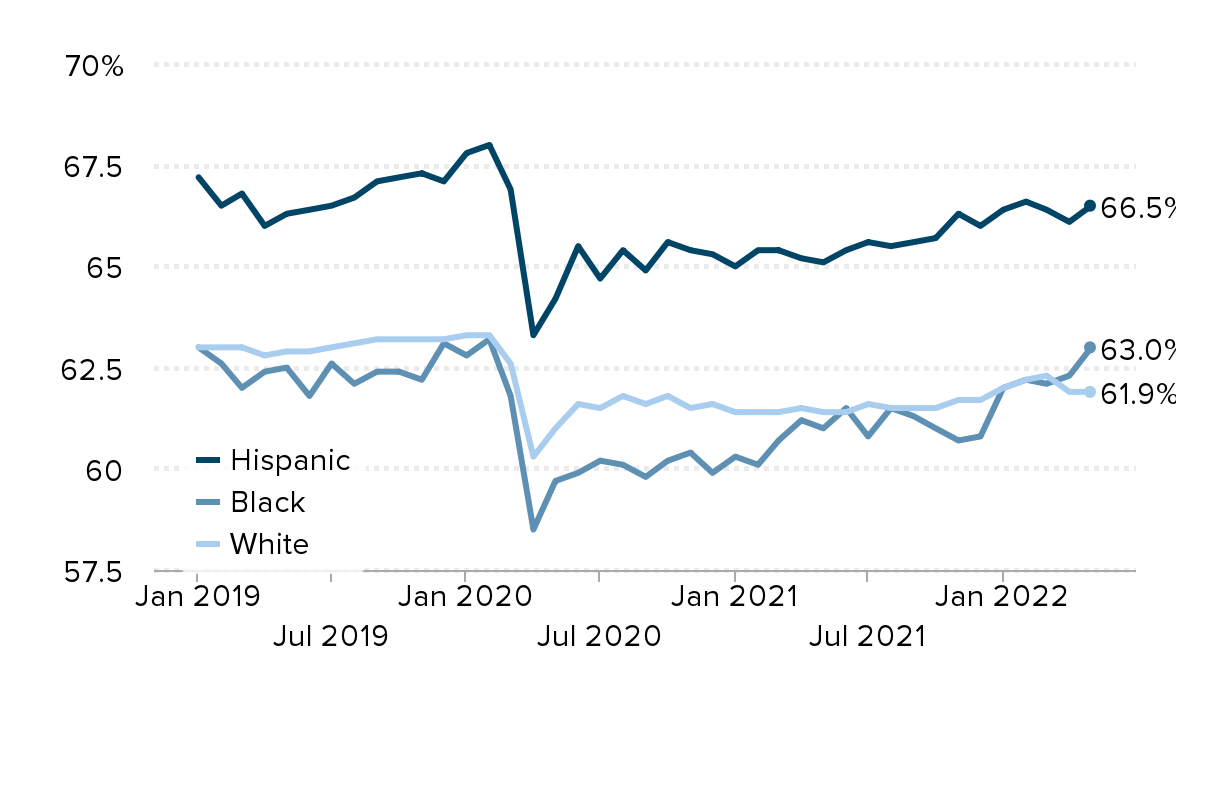
Source: Seasonally adjusted Federal Reserve Economic Data.
Compositional shifts distort normal measures of wage growth: Median and mean changes in wages, normal and inverse probability (composition-adjusted) weights, 2019–2020 and 2020–2021
| Mean (normal weight) | Mean (inverse probability weight) | Median (normal weight) | Median (inverse probability weight) | |||
|---|---|---|---|---|---|---|
| 2019–2020 | 0 | 7.4% | 4.4% | 0 | 6.6% | 2.6% |
| 2020–2021 | 0 | -2.7% | -1.7% | 0 | -3.4% | -1.6% |
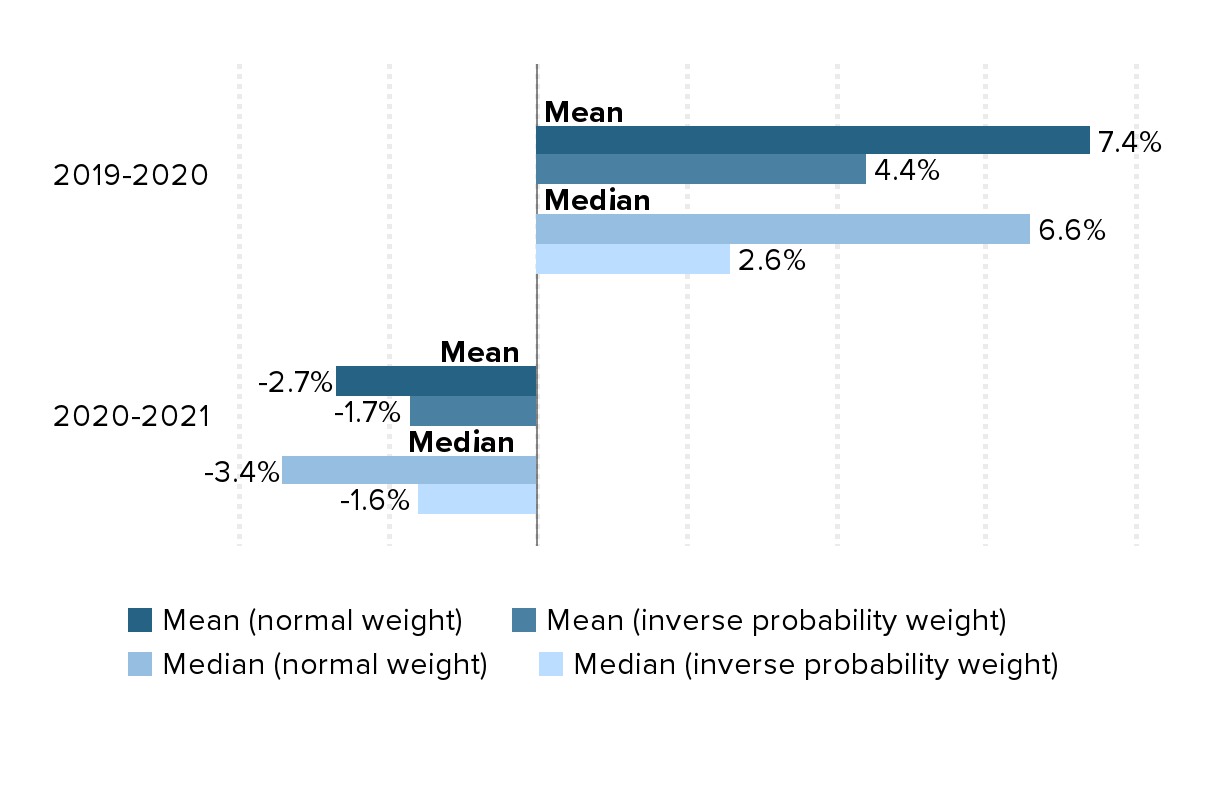
Source: Authors' analysis of Current Population Survey basic monthly microdata, EPI Current Population Survey Extracts, Version 1.0.27 (2022), https://microdata.epi.org.
Wage growth fell at higher wage levels in 2021: Real annual composition-adjusted wage growth by percentile, alternative and calendar years, 2020–2021
| Percentile | Alternative year | Calendar year |
|---|---|---|
| 5th | 0.4% | 1.1% |
| 10th | 0.7% | 1.1% |
| 15th | 0.6% | 1.0% |
| 20th | 0.3% | 0.6% |
| 25th | 0.0% | 0.3% |
| 30th | -0.5% | -0.1% |
| 35th | -0.9% | -0.5% |
| 40th | -1.4% | -0.9% |
| 45th | -1.8% | -1.2% |
| 50th | -2.1% | -1.5% |
| 55th | -2.4% | -1.7% |
| 60th | -2.5% | -1.8% |
| 65th | -2.7% | -1.9% |
| 70th | -2.8% | -2.0% |
| 75th | -2.9% | -2.2% |
| 80th | -3.0% | -2.3% |
| 85th | -3.1% | -2.4% |
| 90th | -3.2% | -2.7% |
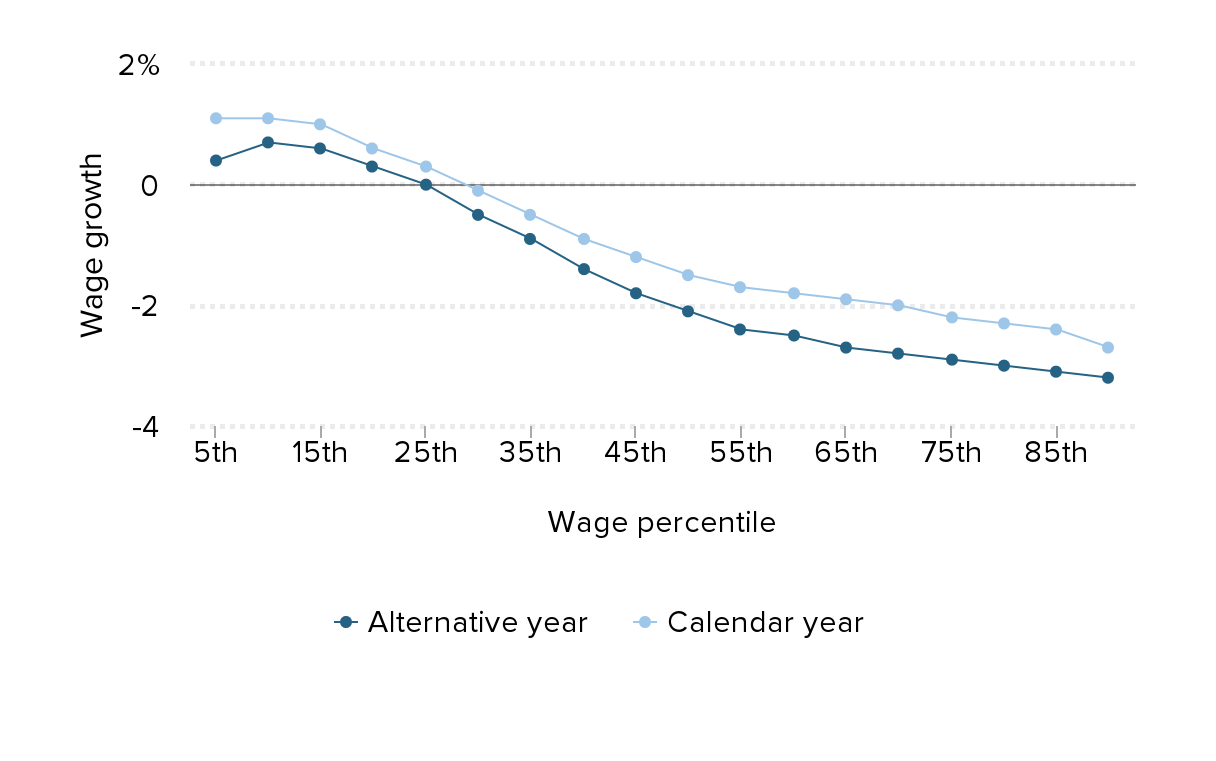
Source: Authors’ analysis of Current Population Survey Outgoing Rotation Group microdata, EPI Current Population Survey Extracts, Version 1.0.27 (2022), https://microdata.epi.org.
Wage growth has stabilized as the labor market returns to pre-pandemic composition: Year-over-year wage changes, alternative measures, 2018–2022
| Year-over-year | Employment cost index (ECI) | Hourly compensation | Average hourly earning (all employees) | Average hourly earning (production and non-supervisory employees) | Composition-adjusted average hourly earnings (all employees) |
|---|---|---|---|---|---|
| 2019-03-01 | 3.0% | 4.3% | 3.4% | 3.5% | 3.4% |
| 2019-06-01 | 3.0% | 4.2% | 3.3% | 3.5% | 3.3% |
| 2019-09-01 | 3.0% | 3.0% | 3.3% | 3.7% | 3.3% |
| 2019-12-01 | 3.0% | 3.9% | 3.2% | 3.5% | 3.2% |
| 2020-03-01 | 3.3% | 3.7% | 3.2% | 3.5% | 3.1% |
| 2020-06-01 | 2.9% | 8.7% | 6.6% | 6.7% | 4.9% |
| 2020-09-01 | 2.6% | 7.3% | 4.9% | 4.9% | 4.0% |
| 2020-12-01 | 2.8% | 8.6% | 4.9% | 5.0% | 4.0% |
| 2021-03-01 | 3.0% | 6.2% | 5.0% | 5.1% | 4.2% |
| 2021-06-01 | 3.6% | 3.4% | 2.2% | 2.8% | 3.4% |
| 2021-09-01 | 4.6% | 6.3% | 4.5% | 5.4% | 4.9% |
| 2021-12-01 | 4.9% | 5.5% | 5.2% | 6.4% | 5.7% |
| 2022-03-01 | 5.0% | 6.5% | 5.4% | 6.7% | 5.8% |
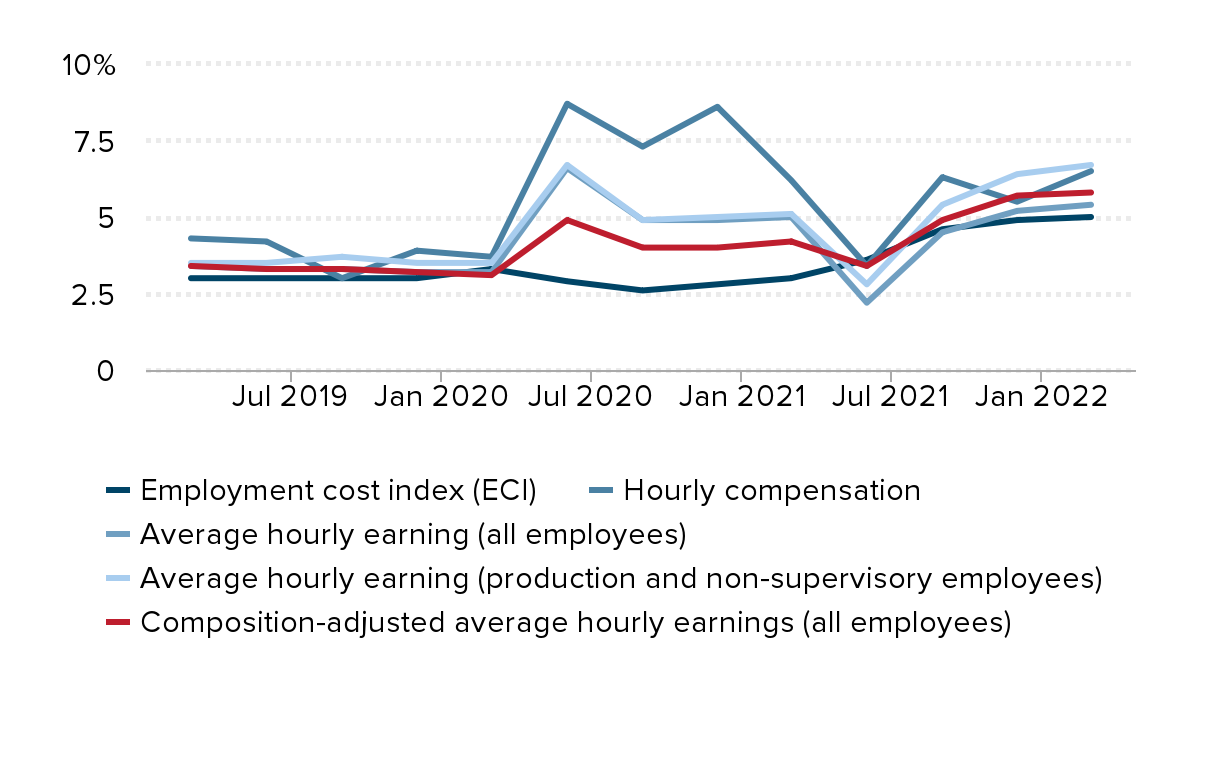
Notes: Our composition-adjusted average hourly earnings for all workers holds constant February 2020 industry mix by weighting by sector-level average weekly hours in the months that follow.
Source: EPI analysis of Bureau of Labor Statistics' (BLS) Current Employment Statistics, Employment Cost Index, and Productivity and Costs public data series.
Quarterly wage growth shows no sign of accelerating this year: Annualized quarterly wage changes, alternative measures, 2018–2022
| Quarter | Employment cost index (ECI) | Hourly compensation | Average hourly earnings (all employees) | Average hourly earnings (production and non-supervisory employees) | Composition-adjusted average hourly earnings (all employees) |
|---|---|---|---|---|---|
| 2019-03-01 | 2.7% | 9.3% | 3.7% | 4.0% | 3.7% |
| 2019-06-01 | 3.0% | 0.8% | 2.3% | 2.9% | 2.3% |
| 2019-09-01 | 3.6% | 0.4% | 3.6% | 3.9% | 3.6% |
| 2019-12-01 | 2.6% | 5.2% | 3.1% | 3.2% | 3.1% |
| 2020-03-01 | 4.1% | 8.7% | 4.0% | 4.2% | 3.4% |
| 2020-06-01 | 1.4% | 21.6% | 16.3% | 16.2% | 9.6% |
| 2020-09-01 | 2.3% | -4.7% | -3.0% | -3.1% | 0.1% |
| 2020-12-01 | 3.4% | 10.6% | 3.2% | 3.4% | 3.3% |
| 2021-03-01 | 4.8% | -0.6% | 4.2% | 4.6% | 4.2% |
| 2021-06-01 | 3.6% | 9.2% | 4.7% | 6.4% | 6.0% |
| 2021-09-01 | 6.5% | 6.3% | 5.7% | 7.2% | 6.0% |
| 2021-12-01 | 4.7% | 7.4% | 6.1% | 7.3% | 6.4% |
| 2022-03-01 | 5.2% | 3.2% | 5.1% | 6.0% | 4.9% |
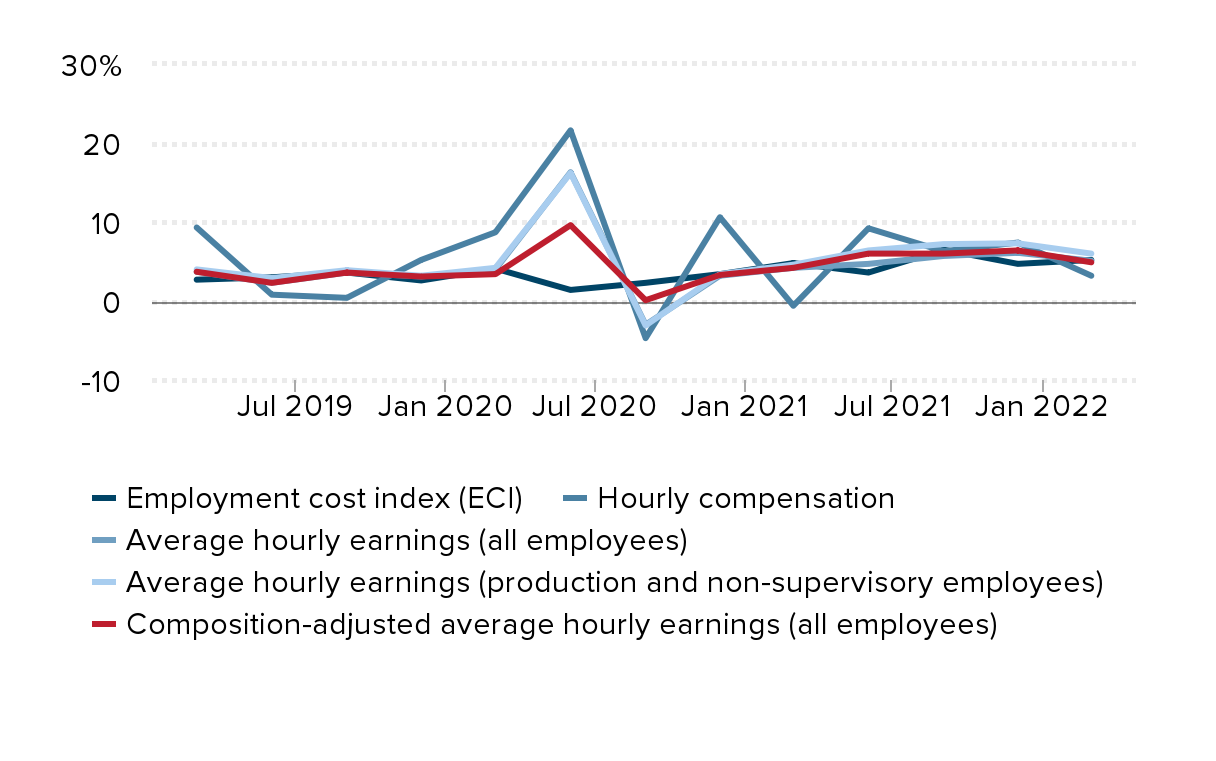
Notes: Our composition-adjusted average hourly earnings for all workers holds constant February 2020 industry mix by weighting by sector-level average weekly hours in the months that follow.
Source: EPI analysis of Bureau of Labor Statistics' (BLS) Current Employment Statistics, Employment Cost Index, and Productivity and Costs public data series.
Nominal wage growth has moderated in recent months: Nominal wage growth in average hourly earnings for all workers in three measures, year-over-year, annualized quarterly, and annualized monthly changes, January 2019—May 2022
| Year-over-year change | Annualized quarterly change | Annualized monthly change | |
|---|---|---|---|
| Jan-2019 | 3.3% | 3.5% | 1.8% |
| Feb-2019 | 3.6% | 3.8% | 4.4% |
| Mar-2019 | 3.5% | 3.7% | 4.4% |
| Apr-2019 | 3.3% | 3.4% | -0.9% |
| May-2019 | 3.3% | 2.8% | 3.1% |
| Jun-2019 | 3.4% | 2.3% | 3.9% |
| Jul-2019 | 3.4% | 2.6% | 3.9% |
| Aug-2019 | 3.4% | 3.3% | 4.4% |
| Sep-2019 | 3.1% | 3.6% | 0.9% |
| Oct-2019 | 3.2% | 3.3% | 3.5% |
| Nov-2019 | 3.4% | 3.0% | 5.2% |
| Dec-2019 | 2.9% | 3.1% | 0.8% |
| Jan-2020 | 3.0% | 3.1% | 2.6% |
| Feb-2020 | 3.1% | 3.0% | 5.6% |
| Mar-2020 | 3.6% | 4.0% | 10.1% |
| Apr-2020 | 8.0% | 10.8% | 64.5% |
| May-2020 | 6.7% | 15.6% | -11.4% |
| Jun-2020 | 5.1% | 16.3% | -13.3% |
| Jul-2020 | 4.9% | 5.2% | 2.1% |
| Aug-2020 | 4.8% | -1.2% | 2.9% |
| Sep-2020 | 4.8% | -3.0% | 1.2% |
| Oct-2020 | 4.6% | 0.2% | 0.8% |
| Nov-2020 | 4.6% | 2.0% | 5.0% |
| Dec-2020 | 5.5% | 3.2% | 11.5% |
| Jan-2021 | 5.3% | 4.5% | 0.4% |
| Feb-2021 | 5.2% | 5.5% | 4.5% |
| Mar-2021 | 4.4% | 4.2% | 0.8% |
| Apr-2021 | 0.6% | 3.6% | 5.7% |
| May-2021 | 2.2% | 3.3% | 6.5% |
| Jun-2021 | 4.0% | 4.7% | 6.5% |
| Jul-2021 | 4.3% | 5.7% | 6.1% |
| Aug-2021 | 4.3% | 6.0% | 3.6% |
| Sep-2021 | 4.8% | 5.7% | 6.4% |
| Oct-2021 | 5.4% | 5.5% | 7.6% |
| Nov-2021 | 5.3% | 5.8% | 4.7% |
| Dec-2021 | 4.9% | 6.1% | 5.9% |
| Jan-2022 | 5.4% | 6.1% | 7.1% |
| Feb-2022 | 5.2% | 5.6% | 1.5% |
| Mar-2022 | 5.6% | 5.2% | 5.8% |
| Apr-2022 | 5.5% | 4.4% | 3.8% |
| May-2022 | 5.2% | 4.3% | 3.8% |
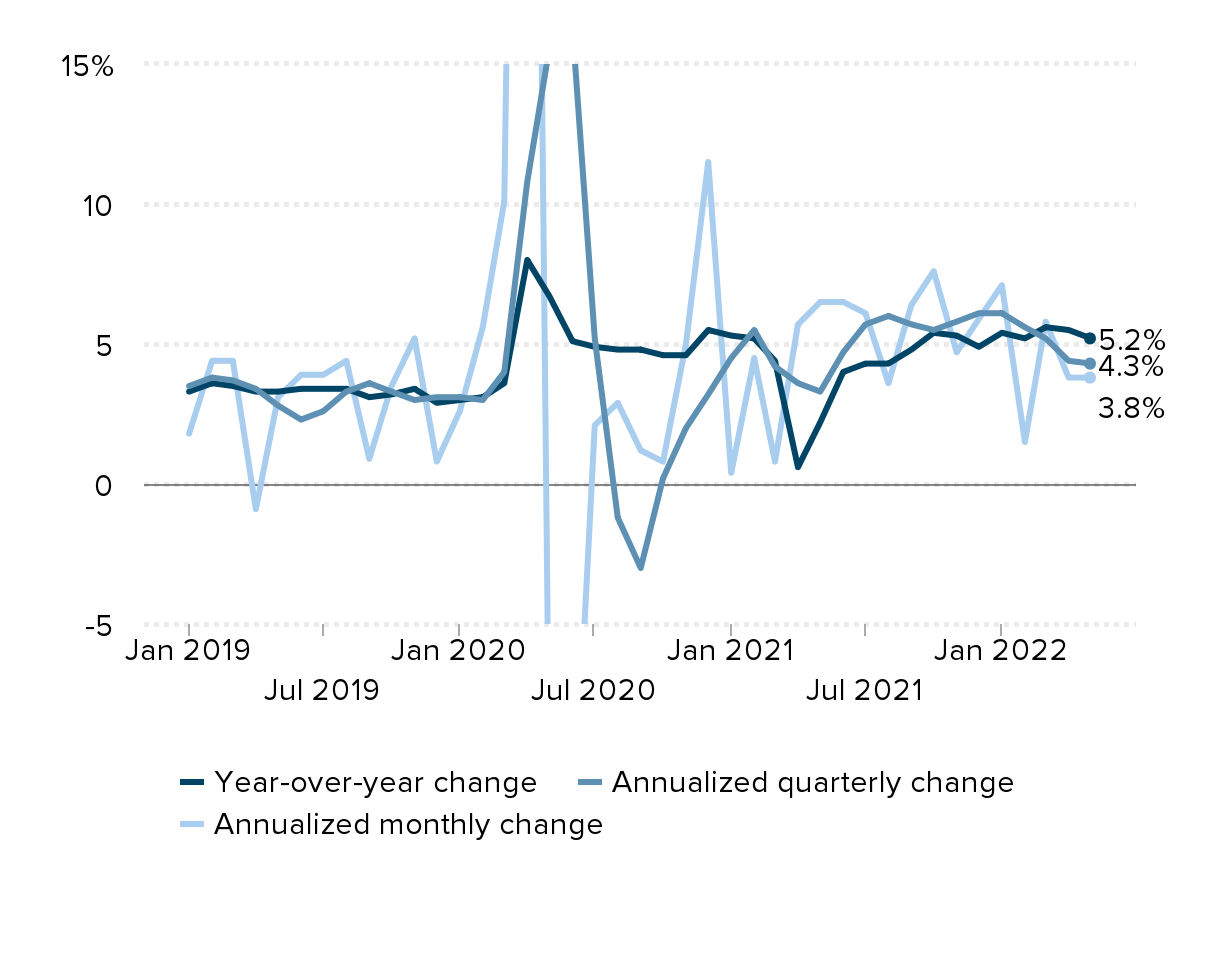
Source: EPI analysis of Bureau of Labor Statistics Current Employment Statistics public data series
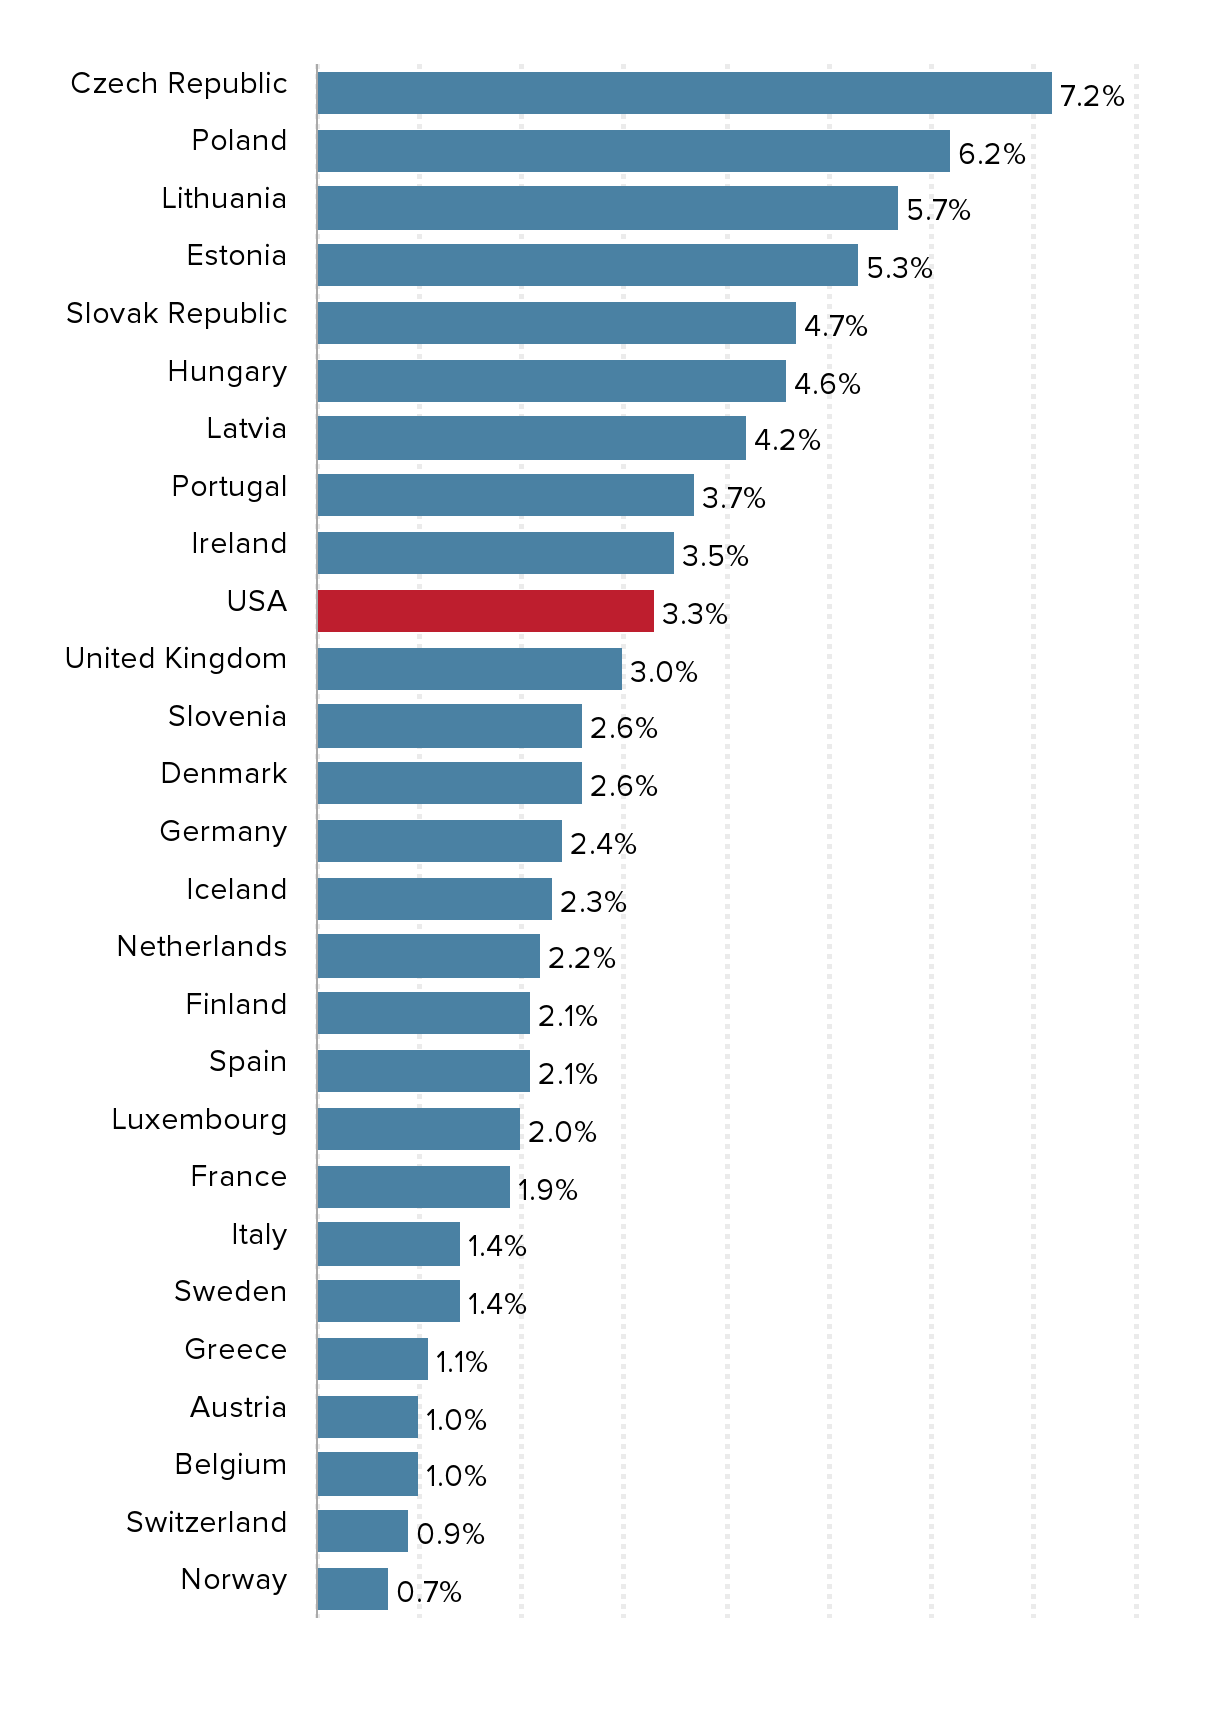
The acceleration of inflation is global: Difference in core inflation rates from 12/2020–4/2022, compared to 2 years pre-pandemic
| Nation | Difference in core inflation rates from 12/2020–4/2022 |
|---|---|
| Czech Republic | 7.2% |
| Poland | 6.2% |
| Lithuania | 5.7% |
| Estonia | 5.3% |
| Slovak Republic | 4.7% |
| Hungary | 4.6% |
| Latvia | 4.2% |
| Portugal | 3.7% |
| Ireland | 3.5% |
| USA | 3.3% |
| United Kingdom | 3.0% |
| Slovenia | 2.6% |
| Denmark | 2.6% |
| Germany | 2.4% |
| Iceland | 2.3% |
| Netherlands | 2.2% |
| Finland | 2.1% |
| Spain | 2.1% |
| Luxembourg | 2.0% |
| France | 1.9% |
| Italy | 1.4% |
| Sweden | 1.4% |
| Greece | 1.1% |
| Austria | 1.0% |
| Belgium | 1.0% |
| Switzerland | 0.9% |
| Norway | 0.7% |
Labor costs are still dampening, not amplifying, inflation: Prices and labor costs during 1970s and from 2020Q4–2022Q1
| Prices | Unit Labor Costs | |
|---|---|---|
| 1970s | 7.0% | 7.4% |
| 2020Q4–2022Q1 | 8.5% | 5.6% |
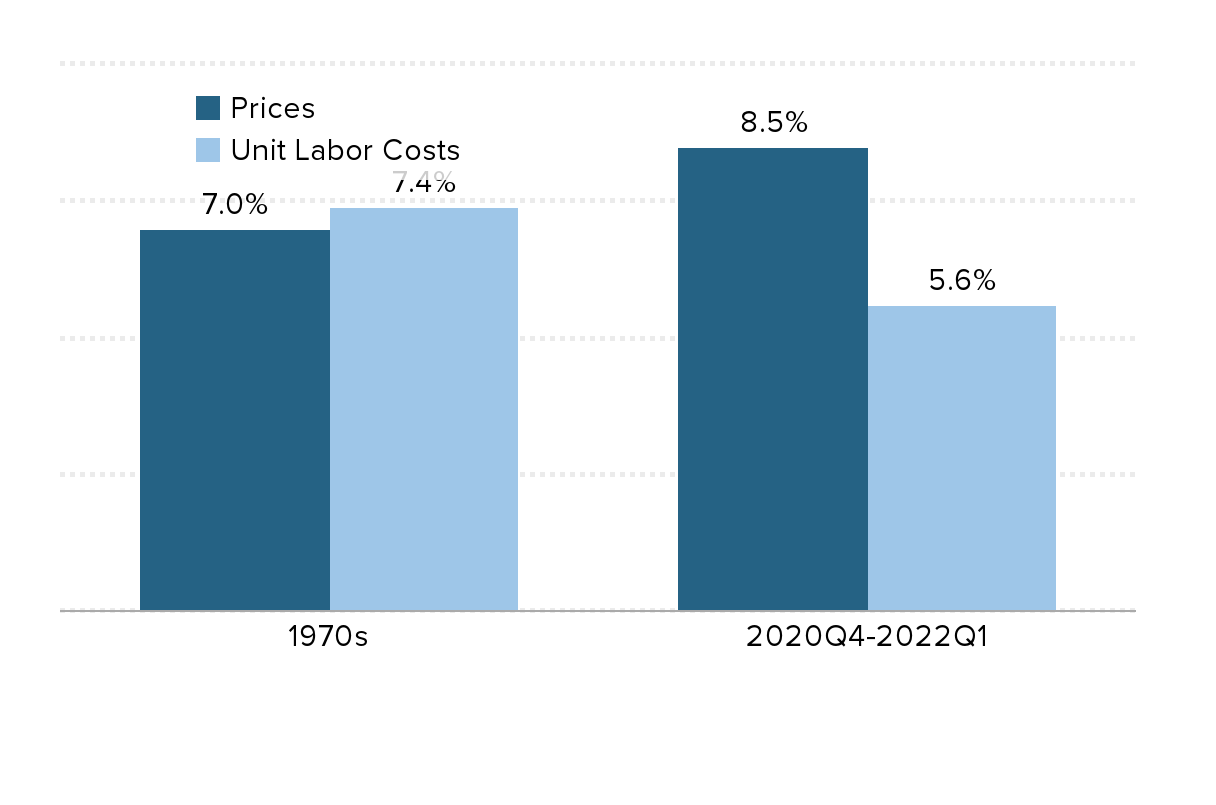
Source: Data from Table 1.15 from the National Income and Product Accounts (NIPA) program of the Bureau of Economic Analysis (BEA).
Nominal GDP (Demand, kind of) and Potential Output (Supply, kind of) relative to CBO pre-pandemic forecasts
| Potential output | Nominal GDP | Projected Potential ouput | Projected Nominal GDP | |
|---|---|---|---|---|
| 2019Q4 | 100.0% | 100.0% | ||
| 2020Q1 | 99.5% | 97.7% | ||
| 2020Q2 | 97.4% | 87.7% | ||
| 2020Q3 | 95.4% | 94.1% | ||
| 2020Q4 | 96.5% | 94.6% | ||
| 2021Q1 | 96.4% | 96.1% | ||
| 2021Q2 | 97.1% | 98.3% | ||
| 2021Q3 | 97.1% | 99.3% | ||
| 2021Q4 | 99.2% | 101.8% | ||
| 2022Q1 | 99.8% | 102.4% | 99.8% | 102.4% |
| 2022Q2 | 100.6% | 103.0% |
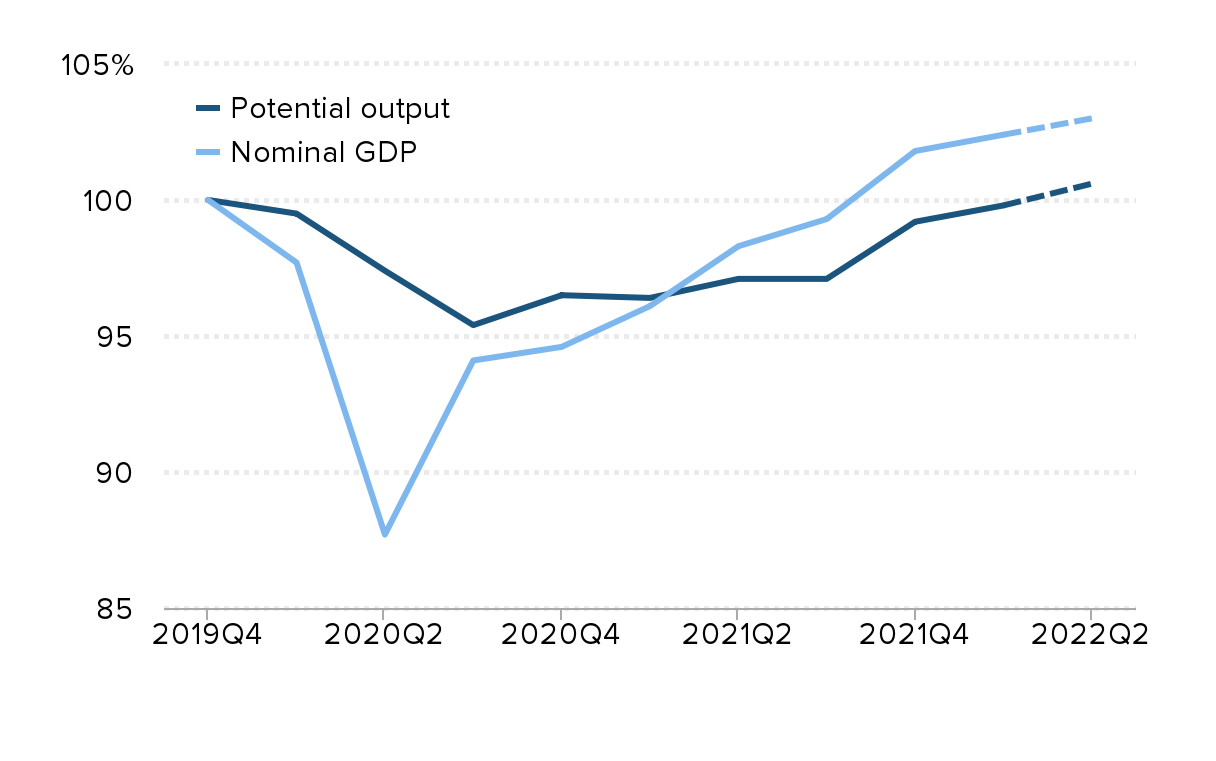
Forecasted nominal GDP and forecasted potential output taken from the Congressional Budget Office (CBO) Budget and Economic Outlook from January 2020. Real-time potential output is estimated by taking difference between forecasted measures of labor force participation and trend measures of capital services and total factor productivity (TFP) growth and actual measures since 2019.
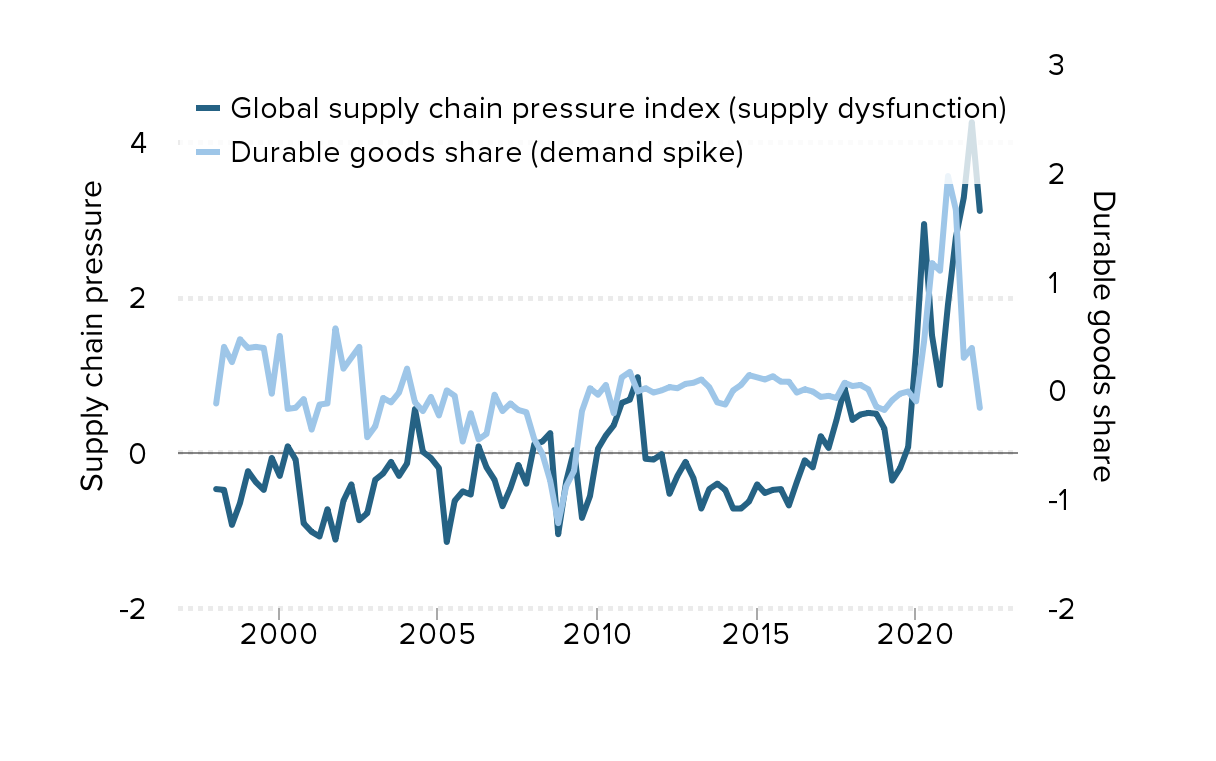
Pandemic distortions on both demand and supply-side spark inflation: Global supply chain pressure index and change in durable goods share, 1998–2022
| Quarter | Global supply chain pressure index (supply dysfunction) | Durable goods share (demand spike) |
|---|---|---|
| 1998Q1 | -0.47 | -0.12 |
| 1998Q2 | -0.48 | 0.40 |
| 1998Q3 | -0.93 | 0.26 |
| 1998Q4 | -0.65 | 0.47 |
| 1999Q1 | -0.24 | 0.39 |
| 1999Q2 | -0.38 | 0.40 |
| 1999Q3 | -0.48 | 0.39 |
| 1999Q4 | -0.07 | -0.03 |
| 2000Q1 | -0.30 | 0.50 |
| 2000Q2 | 0.08 | -0.17 |
| 2000Q3 | -0.09 | -0.16 |
| 2000Q4 | -0.91 | -0.08 |
| 2001Q1 | -1.02 | -0.36 |
| 2001Q2 | -1.08 | -0.13 |
| 2001Q3 | -0.73 | -0.12 |
| 2001Q4 | -1.12 | 0.57 |
| 2002Q1 | -0.62 | 0.20 |
| 2002Q2 | -0.41 | 0.30 |
| 2002Q3 | -0.87 | 0.40 |
| 2002Q4 | -0.78 | -0.43 |
| 2003Q1 | -0.35 | -0.33 |
| 2003Q2 | -0.27 | -0.07 |
| 2003Q3 | -0.12 | -0.11 |
| 2003Q4 | -0.30 | -0.02 |
| 2004Q1 | -0.14 | 0.20 |
| 2004Q2 | 0.56 | -0.11 |
| 2004Q3 | 0.01 | -0.19 |
| 2004Q4 | -0.07 | -0.06 |
| 2005Q1 | -0.20 | -0.23 |
| 2005Q2 | -1.15 | 0.00 |
| 2005Q3 | -0.62 | -0.05 |
| 2005Q4 | -0.50 | -0.47 |
| 2006Q1 | -0.54 | -0.21 |
| 2006Q2 | 0.08 | -0.45 |
| 2006Q3 | -0.19 | -0.40 |
| 2006Q4 | -0.35 | -0.04 |
| 2007Q1 | -0.69 | -0.19 |
| 2007Q2 | -0.46 | -0.12 |
| 2007Q3 | -0.16 | -0.18 |
| 2007Q4 | -0.40 | -0.20 |
| 2008Q1 | 0.11 | -0.45 |
| 2008Q2 | 0.14 | -0.58 |
| 2008Q3 | 0.25 | -0.83 |
| 2008Q4 | -1.05 | -1.22 |
| 2009Q1 | -0.37 | -0.88 |
| 2009Q2 | 0.03 | -0.74 |
| 2009Q3 | -0.84 | -0.19 |
| 2009Q4 | -0.56 | 0.02 |
| 2010Q1 | 0.05 | -0.04 |
| 2010Q2 | 0.22 | 0.05 |
| 2010Q3 | 0.35 | -0.21 |
| 2010Q4 | 0.64 | 0.12 |
| 2011Q1 | 0.68 | 0.17 |
| 2011Q2 | 0.97 | -0.01 |
| 2011Q3 | -0.08 | 0.02 |
| 2011Q4 | -0.09 | -0.02 |
| 2012Q1 | -0.02 | 0.00 |
| 2012Q2 | -0.53 | 0.03 |
| 2012Q3 | -0.30 | 0.02 |
| 2012Q4 | -0.12 | 0.06 |
| 2013Q1 | -0.33 | 0.07 |
| 2013Q2 | -0.72 | 0.10 |
| 2013Q3 | -0.47 | 0.03 |
| 2013Q4 | -0.40 | -0.11 |
| 2014Q1 | -0.48 | -0.13 |
| 2014Q2 | -0.72 | 0.00 |
| 2014Q3 | -0.72 | 0.05 |
| 2014Q4 | -0.63 | 0.14 |
| 2015Q1 | -0.41 | 0.12 |
| 2015Q2 | -0.52 | 0.10 |
| 2015Q3 | -0.48 | 0.13 |
| 2015Q4 | -0.47 | 0.08 |
| 2016Q1 | -0.68 | 0.08 |
| 2016Q2 | -0.38 | -0.02 |
| 2016Q3 | -0.10 | 0.01 |
| 2016Q4 | -0.19 | -0.01 |
| 2017Q1 | 0.21 | -0.06 |
| 2017Q2 | 0.06 | -0.05 |
| 2017Q3 | 0.42 | -0.07 |
| 2017Q4 | 0.83 | 0.07 |
| 2018Q1 | 0.42 | 0.04 |
| 2018Q2 | 0.49 | 0.05 |
| 2018Q3 | 0.51 | 0.01 |
| 2018Q4 | 0.50 | -0.15 |
| 2019Q1 | 0.31 | -0.18 |
| 2019Q2 | -0.36 | -0.09 |
| 2019Q3 | -0.20 | -0.03 |
| 2019Q4 | 0.07 | -0.01 |
| 2020Q1 | 1.32 | -0.10 |
| 2020Q2 | 2.94 | 0.45 |
| 2020Q3 | 1.51 | 1.17 |
| 2020Q4 | 0.87 | 1.10 |
| 2021Q1 | 1.91 | 1.97 |
| 2021Q2 | 2.77 | 1.66 |
| 2021Q3 | 3.28 | 0.30 |
| 2021Q4 | 4.25 | 0.39 |
| 2022Q1 | 3.11 | -0.16 |
Since pandemic shock, labor costs make historically small contribution to price growth, while profits make historically large contribution: Contribution of cost components to price increases in the non-financial corporate sector
| Unit labor costs | Nonlabor inputs | Profits | |
|---|---|---|---|
| Historical average | 61.8% | 26.9% | 11.3% |
| Since 2020Q2 (recession’s trough) | 19.1% | 42.6% | 38.2% |
| Since 2020Q4 (approx. beginning of inflation) | 40.0% | 38.3% | 22.5% |
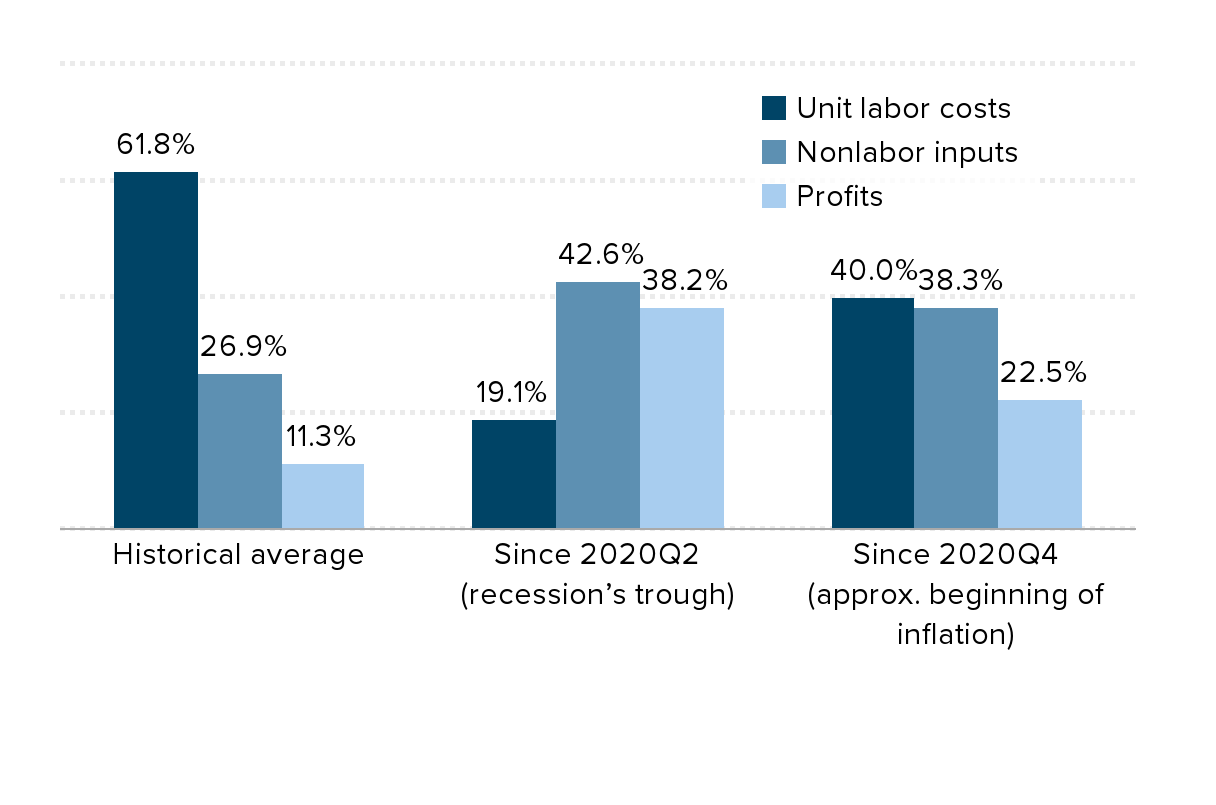
Source: Data from Table 1.15 from the BEA NIPAs.
Profit margin spike of 2021 is relenting – but margins are still historically high: Pre- and post-tax profit margins, recent and historical averages
| Pre-tax | Post-tax | Pre-tax average, 1979–2019 | Post-tax average, 1979–2019 | |
|---|---|---|---|---|
| 2016Q1 | 16.0% | 12.7% | 13.1% | 9.6% |
| 2016Q2 | 14.7% | 11.3% | 13.1% | 9.6% |
| 2016Q3 | 14.6% | 11.4% | 13.1% | 9.6% |
| 2016Q4 | 14.0% | 11.0% | 13.1% | 9.6% |
| 2017Q1 | 14.5% | 11.9% | 13.1% | 9.6% |
| 2017Q2 | 14.6% | 12.0% | 13.1% | 9.6% |
| 2017Q3 | 14.1% | 11.4% | 13.1% | 9.6% |
| 2017Q4 | 14.2% | 11.6% | 13.1% | 9.6% |
| 2018Q1 | 14.5% | 12.4% | 13.1% | 9.6% |
| 2018Q2 | 14.8% | 12.4% | 13.1% | 9.6% |
| 2018Q3 | 15.3% | 13.0% | 13.1% | 9.6% |
| 2018Q4 | 15.8% | 13.4% | 13.1% | 9.6% |
| 2019Q1 | 14.1% | 12.0% | 13.1% | 9.6% |
| 2019Q2 | 14.6% | 12.3% | 13.1% | 9.6% |
| 2019Q3 | 14.6% | 12.6% | 13.1% | 9.6% |
| 2019Q4 | 14.9% | 12.6% | 13.1% | 9.6% |
| 2020Q1 | 13.2% | 11.5% | 13.1% | 9.6% |
| 2020Q2 | 13.1% | 11.1% | 13.1% | 9.6% |
| 2020Q3 | 17.7% | 15.2% | 13.1% | 9.6% |
| 2020Q4 | 15.8% | 13.4% | 13.1% | 9.6% |
| 2021Q1 | 16.9% | 14.3% | 13.1% | 9.6% |
| 2021Q2 | 19.0% | 16.1% | 13.1% | 9.6% |
| 2021Q3 | 18.5% | 15.8% | 13.1% | 9.6% |
| 2021Q4 | 17.8% | 15.1% | 13.1% | 9.6% |
| 2022Q1 | 17.0% | 13.9% | 13.1% | 9.6% |
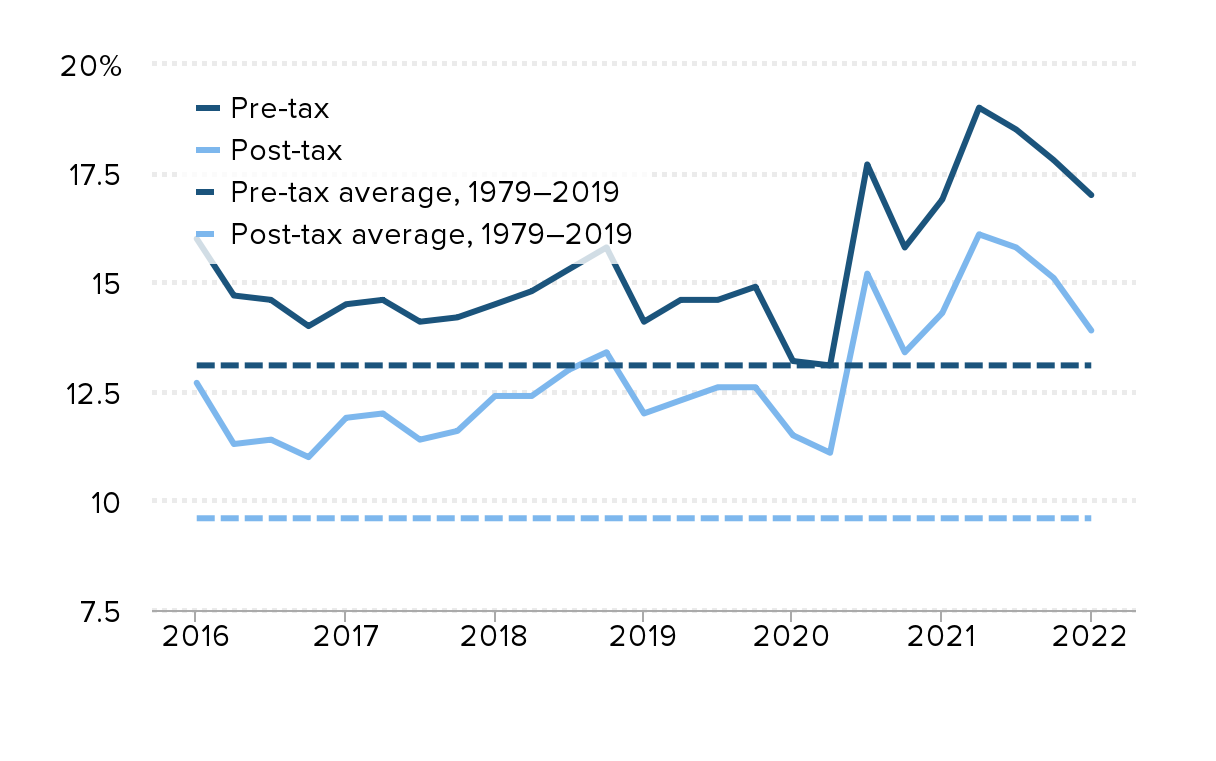
Source: Data from Table 1.15 from the BEA NIPAs.
