The gender pay gap is real:
A 360 degree look at what it is and why it matters
Economic Policy Institute
Elise Gould
Senior Economist
Economic Policy Institute
Wednesday, October 26, 2016
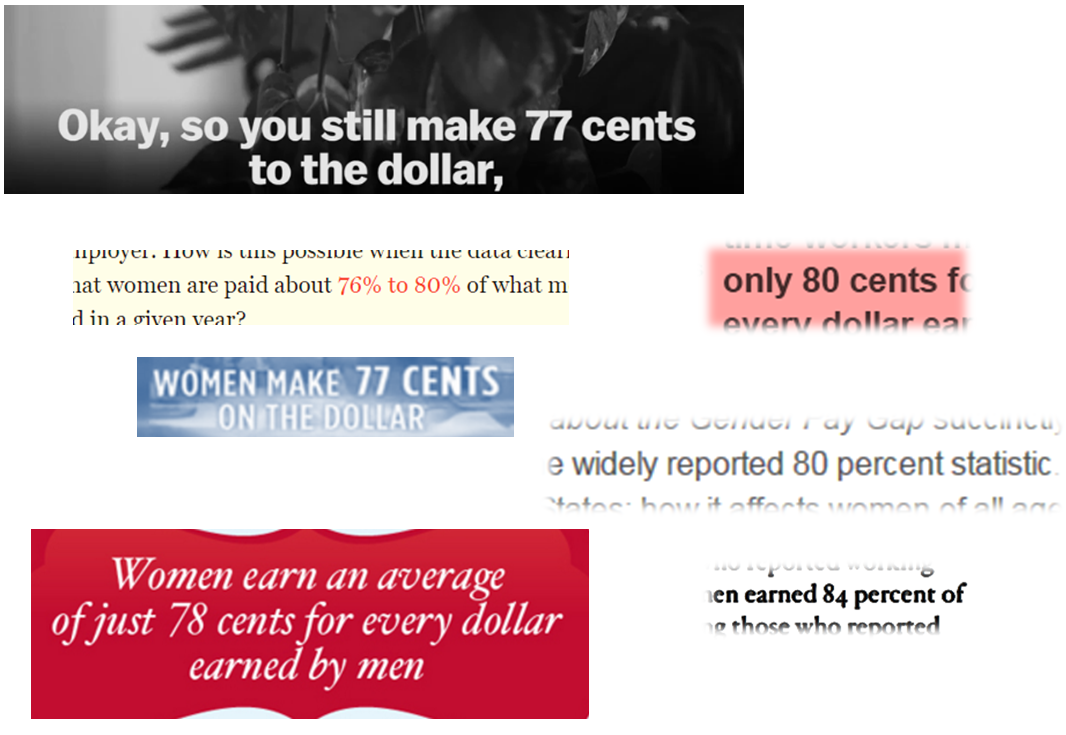
Different measures don’t mean the data are unreliable.
Adjusted measures can’t gauge the full effects of discrimination.

No matter how you slice it, there is a gender wage gap.
Progress in closing the gender pay gap has largely stalled: Women's hourly wages as a share of men's at the median, 1979–2015
| Year | Women’s hourly earnings at the median as a share of men’s hourly earnings at the median | Men |
|---|---|---|
| 1979 | 62.39% | 100 |
| 1980 | 63.06% | 100 |
| 1981 | 64.18% | 100 |
| 1982 | 65.32% | |
| 1983 | 66.52% | |
| 1984 | 67.54% | |
| 1985 | 68.00% | |
| 1986 | 67.33% | |
| 1987 | 69.08% | |
| 1988 | 70.95% | |
| 1989 | 73.82% | |
| 1990 | 75.15% | |
| 1991 | 75.78% | |
| 1992 | 76.38% | |
| 1993 | 78.43% | |
| 1994 | 79.10% | |
| 1995 | 77.35% | |
| 1996 | 77.34% | |
| 1997 | 79.24% | |
| 1998 | 77.96% | |
| 1999 | 77.13% | |
| 2000 | 78.29% | |
| 2001 | 78.79% | |
| 2002 | 80.05% | |
| 2003 | 80.64% | |
| 2004 | 81.81% | |
| 2005 | 82.49% | |
| 2006 | 82.39% | |
| 2007 | 81.75% | |
| 2008 | 83.17% | |
| 2009 | 81.30% | |
| 2010 | 83.43% | |
| 2011 | 84.62% | |
| 2012 | 83.03% | |
| 2013 | 83.36% | |
| 2014 | 82.24% | |
| 2015 | 82.74% | 100 |
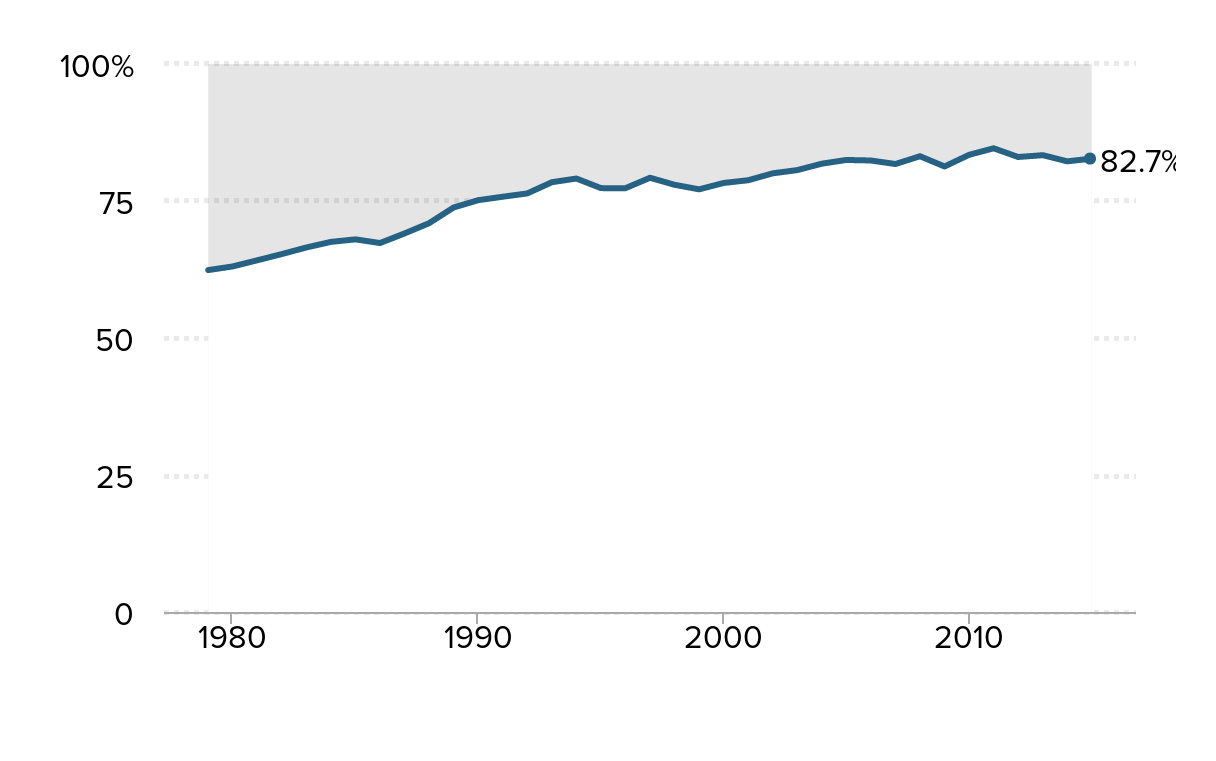
Source: EPI analysis of Current Population Survey microdata. For more information on the data sample see EPI's State of Working America Data Library.
The gender wage gap is still widest among top earners: Women's hourly wages as a share of men's at various wage percentiles, 1979 and 2015
| 2015 | 1979 | |||
|---|---|---|---|---|
| 10th percentile | 92.0% | 8.0 | 86.9% | 12.1 |
| 50th percentile | 82.7% | 17.3 | 62.4% | 37.6 |
| 95th percentile | 73.8% | 26.2 | 63.0% | 37.0 |
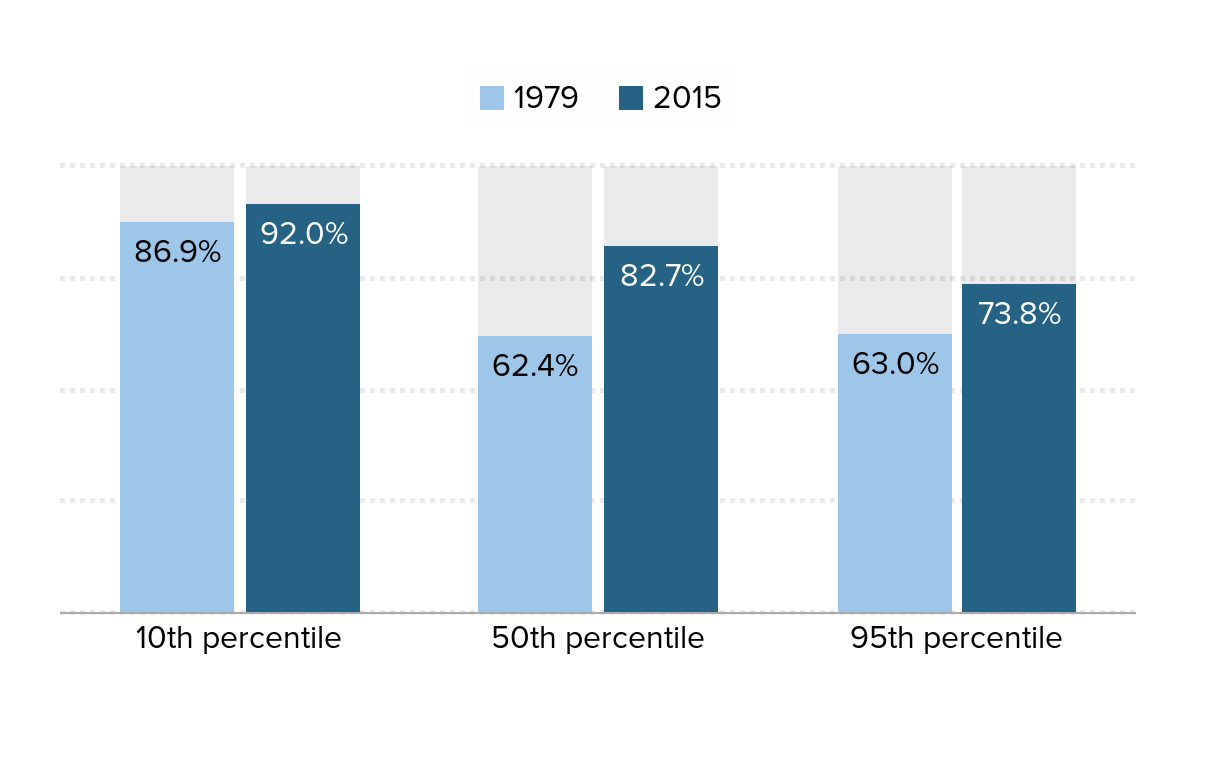
Notes: The xth-percentile wage is the wage at which x% of wage earners earn less and (100-x)% earn more.
Source: EPI analysis of Current Population Survey Outgoing Rotation group microdata
Black and Hispanic women experience the biggest pay gaps: Women's median hourly wages as a share of white men's and their per hour wage penalties, by race and ethnicity, 2015
| Gender Wage Gap as Compared to White Men | Median | Gap |
|---|---|---|
| White women | 81.00% | 19.00% |
| Black women | 65.26% | 34.74% |
| Hispanic women | 57.64% | 42.36% |
| Asian women | 89.79% | 10.21% |
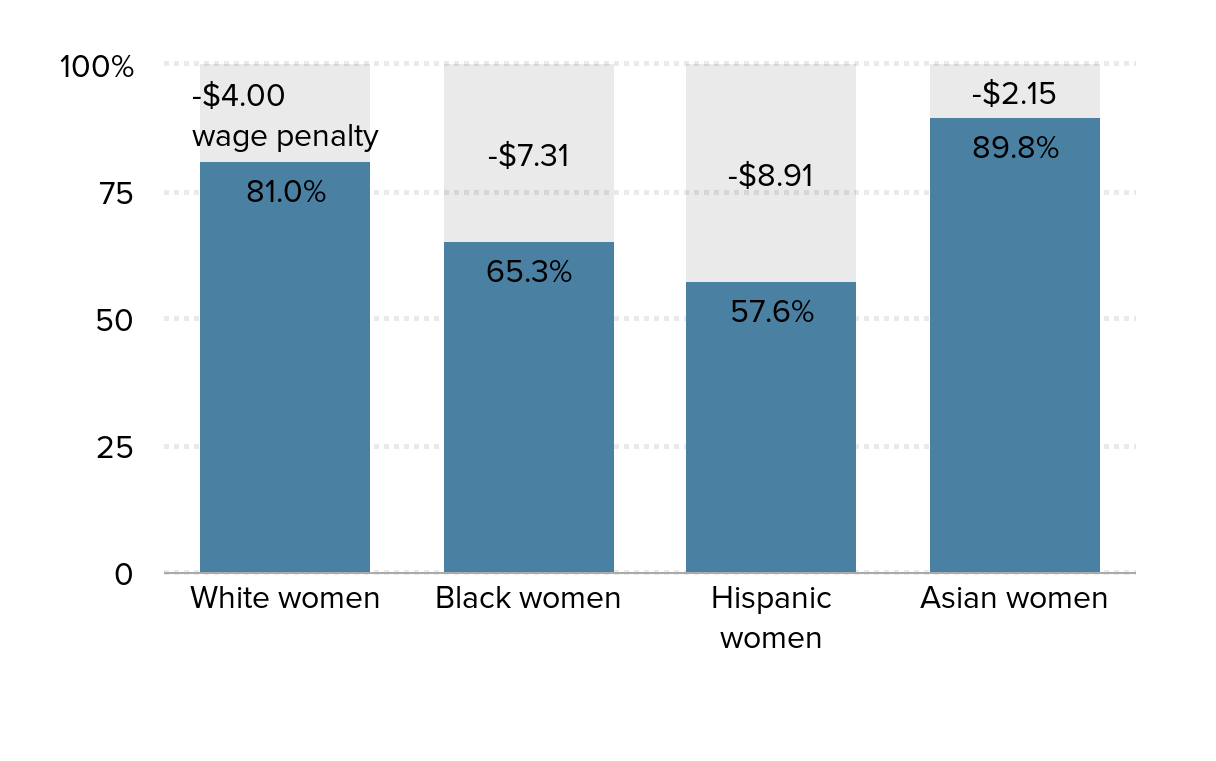
Notes: Values displayed above columns represent the difference between women's median hourly wages and median hourly wages of white men.
Source: EPI analysis of Current Population Survey microdata, 2015
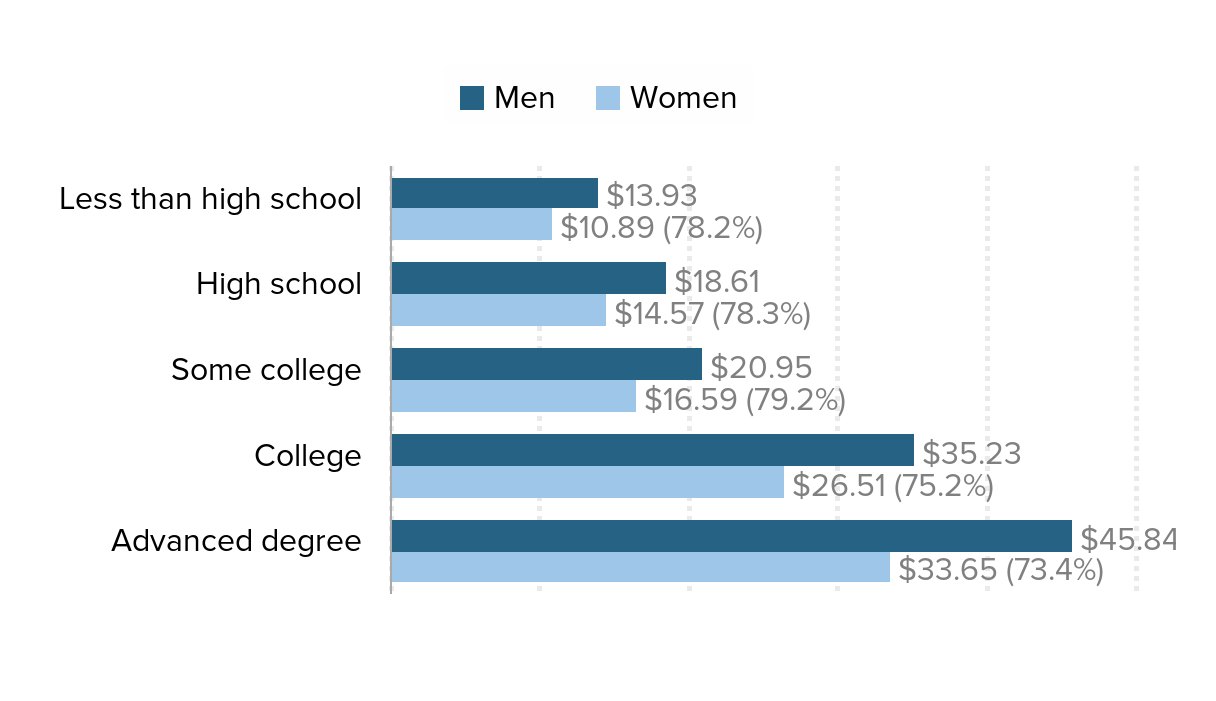
Women earn less than men at every education level: Average hourly wages, by gender and education, 2015
| Education level | Men | Women |
|---|---|---|
| Less than high school | $13.93 | $10.89 |
| High school | $18.61 | $14.57 |
| Some college | $20.95 | $16.59 |
| College | $35.23 | $26.51 |
| Advanced degree | $45.84 | $33.65 |
Source: EPI analysis of Current Population Survey Outgoing Rotation Group microdata. For more information on the data sample see EPI's State of Working America Data Library.
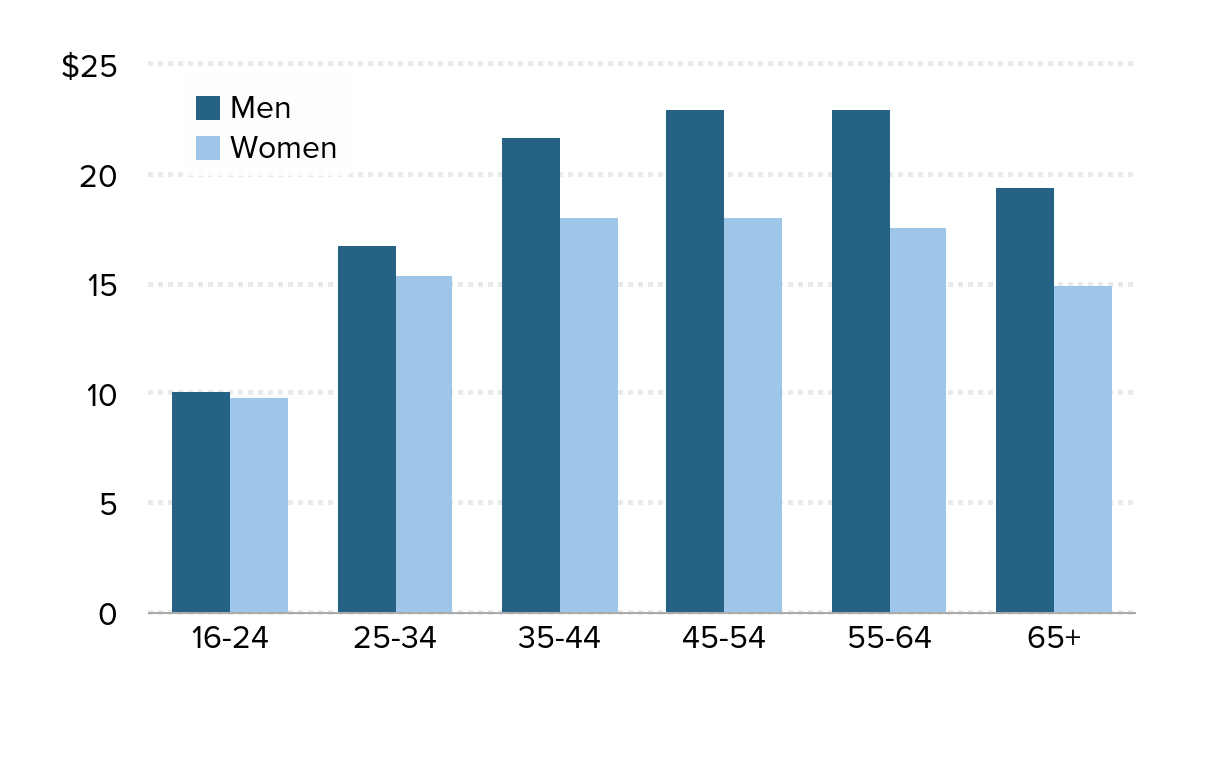
Women's hourly wages plateau and then begin to decline earlier than men's: Median hourly wage gap by age and gender, 2015
| Age | Men | Women |
|---|---|---|
| 16-24 | $10.09 | $9.85 |
| 25-34 | $16.78 | $15.39 |
| 35-44 | $21.72 | $18.04 |
| 45-54 | $22.98 | $18.03 |
| 55-64 | $22.97 | $17.63 |
| 65+ | $19.44 | $14.95 |
Source: EPI analysis of Current Population Survey microdata

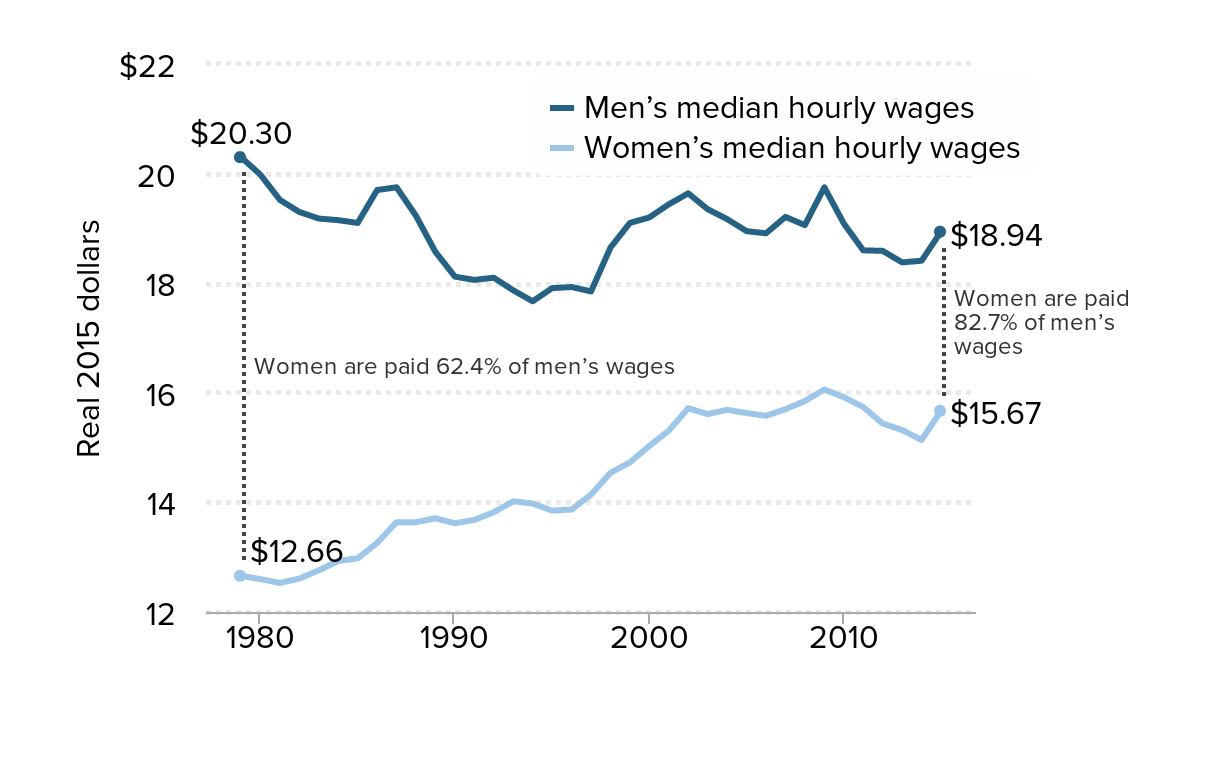
30 percent of the reduction of the gender wage gap between the median male and female worker since 1979 is due to the decline in men’s wages: Median hourly wages, by gender, 1979–2015
| Year | Men’s median hourly wages | Women’s median hourly wages |
|---|---|---|
| 1979 | $20.30 | $12.66 |
| 1980 | $19.98 | $12.60 |
| 1981 | $19.52 | $12.53 |
| 1982 | $19.30 | $12.61 |
| 1983 | $19.18 | $12.76 |
| 1984 | $19.15 | $12.93 |
| 1985 | $19.10 | $12.98 |
| 1986 | $19.70 | $13.26 |
| 1987 | $19.75 | $13.64 |
| 1988 | $19.23 | $13.64 |
| 1989 | $18.57 | $13.71 |
| 1990 | $18.12 | $13.62 |
| 1991 | $18.06 | $13.68 |
| 1992 | $18.10 | $13.82 |
| 1993 | $17.87 | $14.02 |
| 1994 | $17.67 | $13.98 |
| 1995 | $17.91 | $13.85 |
| 1996 | $17.93 | $13.87 |
| 1997 | $17.85 | $14.14 |
| 1998 | $18.65 | $14.54 |
| 1999 | $19.10 | $14.73 |
| 2000 | $19.20 | $15.03 |
| 2001 | $19.44 | $15.31 |
| 2002 | $19.64 | $15.72 |
| 2003 | $19.35 | $15.61 |
| 2004 | $19.17 | $15.69 |
| 2005 | $18.95 | $15.63 |
| 2006 | $18.91 | $15.58 |
| 2007 | $19.21 | $15.70 |
| 2008 | $19.06 | $15.85 |
| 2009 | $19.75 | $16.06 |
| 2010 | $19.09 | $15.92 |
| 2011 | $18.60 | $15.74 |
| 2012 | $18.59 | $15.44 |
| 2013 | $18.38 | $15.32 |
| 2014 | $18.41 | $15.14 |
| 2015 | $18.94 | $15.67 |
Source: EPI analysis of Current Population Survey Outgoing Rotation Group microdata. For more information on the data sample see EPI's State of Working America Data Library.
Eliminating the gender and inequality wage gap could raise women’s wages by 69%: Median hourly wages for men and women, compared with wages for all workers had they increased in tandem with productivity, 1979–2015
| Year | Wages for all workers | Men’s wages | Women’s wages | Wages for all workers had they grown in tandem with productivity |
|---|---|---|---|---|
| 1979 | $16.15 | $20.30 | $12.66 | $16.15 |
| 1980 | $16.07 | $19.98 | $12.60 | $16.03 |
| 1981 | $15.66 | $19.52 | $12.53 | $16.38 |
| 1982 | $15.75 | $19.30 | $12.61 | $16.13 |
| 1983 | $15.71 | $19.18 | $12.76 | $16.62 |
| 1984 | $15.71 | $19.15 | $12.93 | $17.05 |
| 1985 | $15.80 | $19.10 | $12.98 | $17.34 |
| 1986 | $16.27 | $19.70 | $13.26 | $17.70 |
| 1987 | $16.12 | $19.75 | $13.64 | $17.78 |
| 1988 | $16.10 | $19.23 | $13.64 | $17.99 |
| 1989 | $16.06 | $18.57 | $13.71 | $18.13 |
| 1990 | $15.85 | $18.12 | $13.62 | $18.39 |
| 1991 | $15.94 | $18.06 | $13.68 | $18.54 |
| 1992 | $15.98 | $18.10 | $13.82 | $19.21 |
| 1993 | $16.06 | $17.87 | $14.02 | $19.28 |
| 1994 | $15.80 | $17.67 | $13.98 | $19.46 |
| 1995 | $15.58 | $17.91 | $13.85 | $19.47 |
| 1996 | $15.65 | $17.93 | $13.87 | $19.94 |
| 1997 | $16.04 | $17.85 | $14.14 | $20.22 |
| 1998 | $16.49 | $18.65 | $14.54 | $20.62 |
| 1999 | $16.97 | $19.10 | $14.73 | $21.12 |
| 2000 | $16.83 | $19.20 | $15.03 | $21.61 |
| 2001 | $17.27 | $19.44 | $15.31 | $21.95 |
| 2002 | $17.27 | $19.64 | $15.72 | $22.56 |
| 2003 | $17.56 | $19.35 | $15.61 | $23.30 |
| 2004 | $17.55 | $19.17 | $15.69 | $23.92 |
| 2005 | $17.40 | $18.95 | $15.63 | $24.34 |
| 2006 | $17.51 | $18.91 | $15.58 | $24.49 |
| 2007 | $17.21 | $19.21 | $15.70 | $24.66 |
| 2008 | $17.30 | $19.06 | $15.85 | $24.70 |
| 2009 | $17.65 | $19.75 | $16.06 | $25.20 |
| 2010 | $17.40 | $19.09 | $15.92 | $25.94 |
| 2011 | $16.92 | $18.60 | $15.74 | $25.97 |
| 2012 | $16.83 | $18.59 | $15.44 | $26.12 |
| 2013 | $16.95 | $18.38 | $15.32 | $26.20 |
| 2014 | $16.90 | $18.41 | $15.14 | $26.33 |
| 2015 | 17.11 | 18.94 | 15.67 | 26.47 |
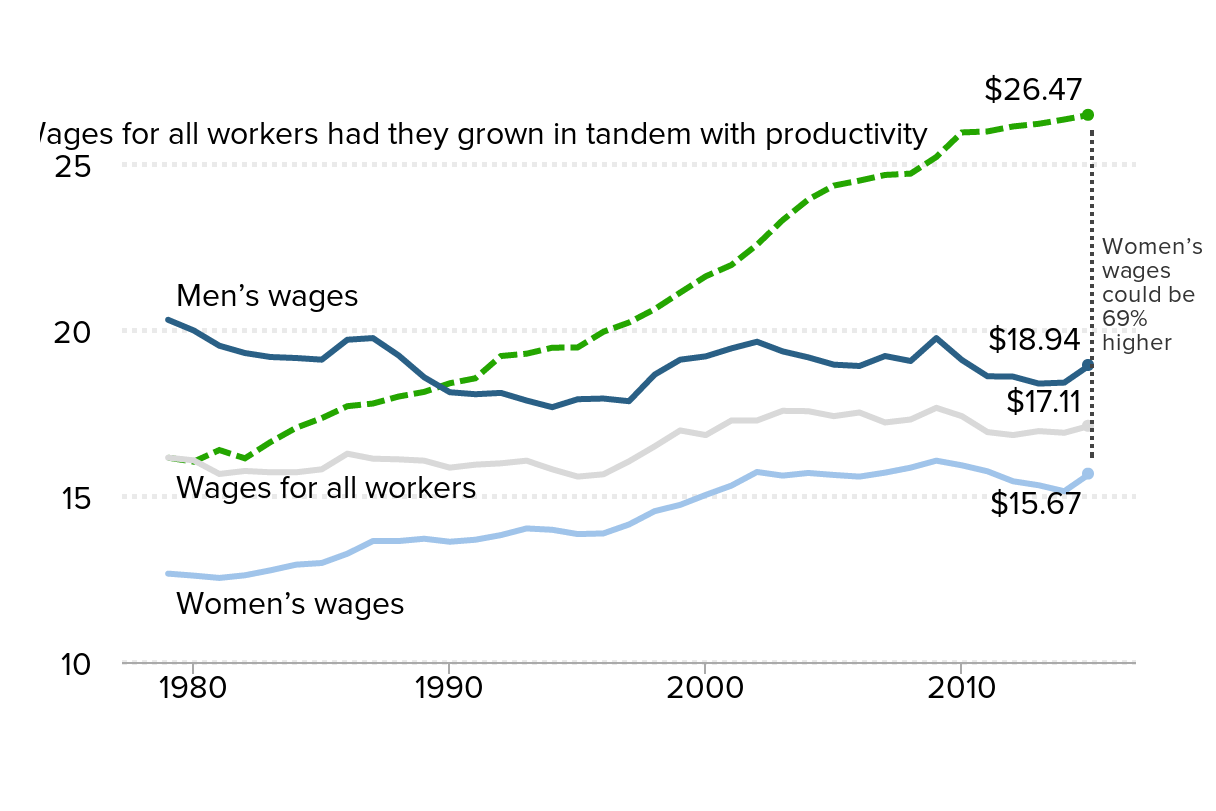
Source: Reproduced from Figure G in Alyssa Davis and Elise Gould, Closing the Pay Gap and Beyond:
A Comprehensive Strategy for Improving Economic Security for Women and Families, EPI Briefing Paper #412, November 18, 2015
Thank you!
Economic Policy Institute: epi.org
Women’s Economic Agenda: epi.org/womens-agenda
Get this presentation at: go.epi.org/gendergap2016
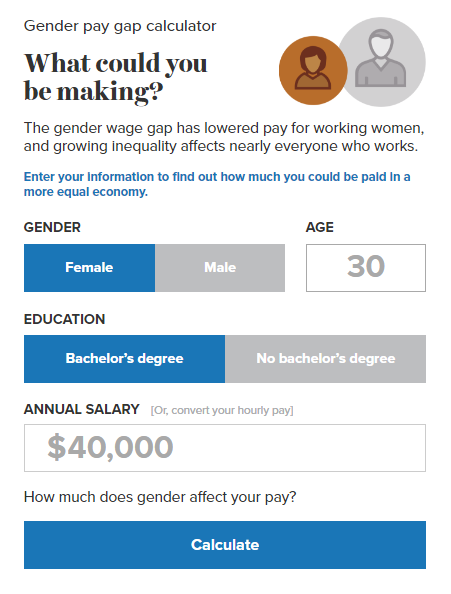
Pay Calculator: epi.org/paygapcalc
