The Changing Demographics of America’s Working Class
Washington, D.C.
December 11, 2015
Dr. Valerie Wilson
Economic Policy Institute
Working class becomes majority-minority in 2032: Projected racial/ethnic composition of 18- to 64-year-olds in the labor force with less than a bachelor's degree, 2013–2032
| White, non-Hispanic | Hispanic | Black | Asian | |
|---|---|---|---|---|
| 2013 | 62.6% | 19.8% | 14.2% | 3.4% |
| 2014 | 61.9% | 20.4% | 14.3% | 3.4% |
| 2015 | 61.2% | 21.0% | 14.3% | 3.5% |
| 2016 | 60.5% | 21.6% | 14.4% | 3.5% |
| 2017 | 59.8% | 22.2% | 14.4% | 3.6% |
| 2018 | 59.1% | 22.8% | 14.5% | 3.6% |
| 2019 | 58.3% | 23.5% | 14.5% | 3.7% |
| 2020 | 57.6% | 24.1% | 14.5% | 3.7% |
| 2021 | 56.9% | 24.8% | 14.6% | 3.8% |
| 2022 | 56.1% | 25.4% | 14.6% | 3.8% |
| 2023 | 55.4% | 26.0% | 14.7% | 3.9% |
| 2024 | 54.7% | 26.7% | 14.7% | 3.9% |
| 2025 | 54.0% | 27.3% | 14.7% | 4.0% |
| 2026 | 53.3% | 27.9% | 14.7% | 4.0% |
| 2027 | 52.7% | 28.6% | 14.7% | 4.0% |
| 2028 | 52.0% | 29.2% | 14.8% | 4.1% |
| 2029 | 51.4% | 29.8% | 14.8% | 4.1% |
| 2030 | 50.8% | 30.4% | 14.8% | 4.1% |
| 2031 | 50.2% | 30.9% | 14.8% | 4.1% |
| 2032 | 49.6% | 31.5% | 14.8% | 4.1% |
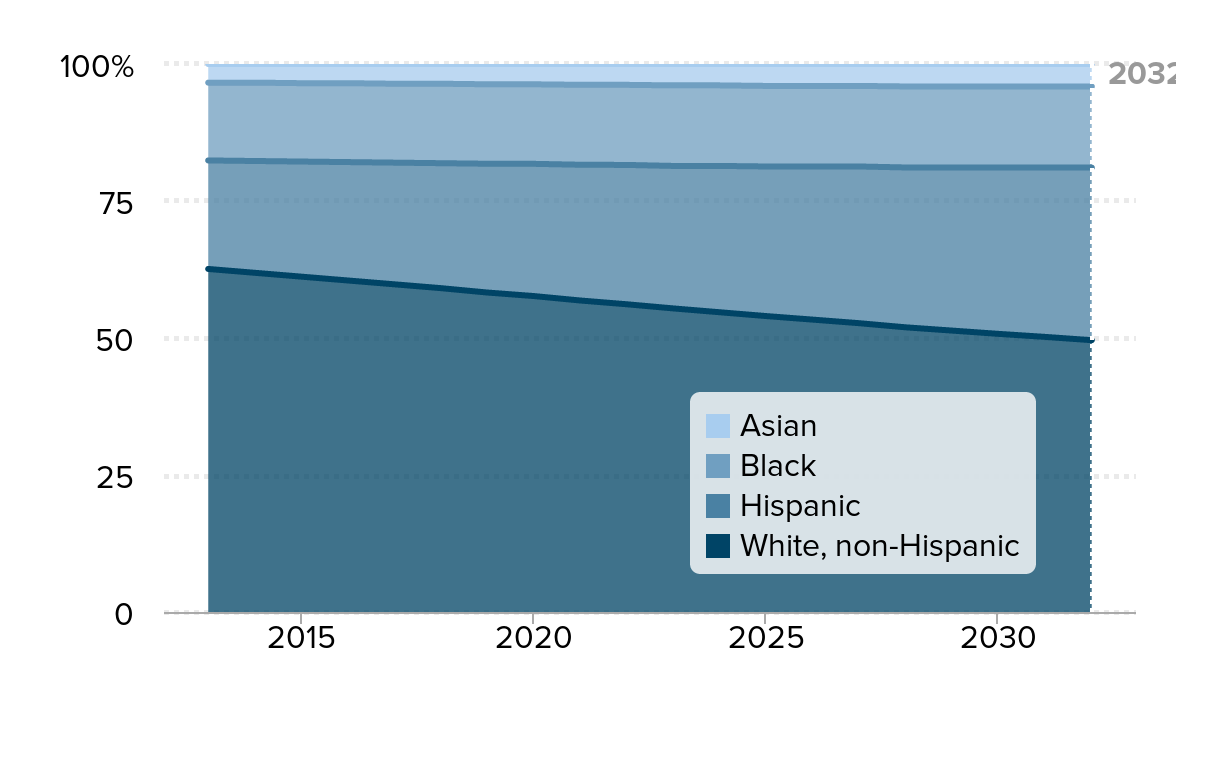
Note: Line represents demographic transition from the majority (50 percent or more), for white, non-Hispanic, working class.
Source: EPI analysis of educational attainment trends from 1993-2013 Current Population Survey Annual Social and Economic Supplement and Bureau of Labor Statistics' long-term labor force projections for 2005–2050
Hispanics and men will drive increase in the browning of the working class: Projected percentage-point change in share of 18- to 64-year-old working class with given racial/ethnicity characteristic, by gender, 2013–2032
| Male | Female | |
|---|---|---|
| White, non-Hispanic | -5.1% | -7.9% |
| Hispanic | 7.2% | 4.5% |
| Black | 0.7% | -0.1% |
| Asian | 0.4% | 0.3% |
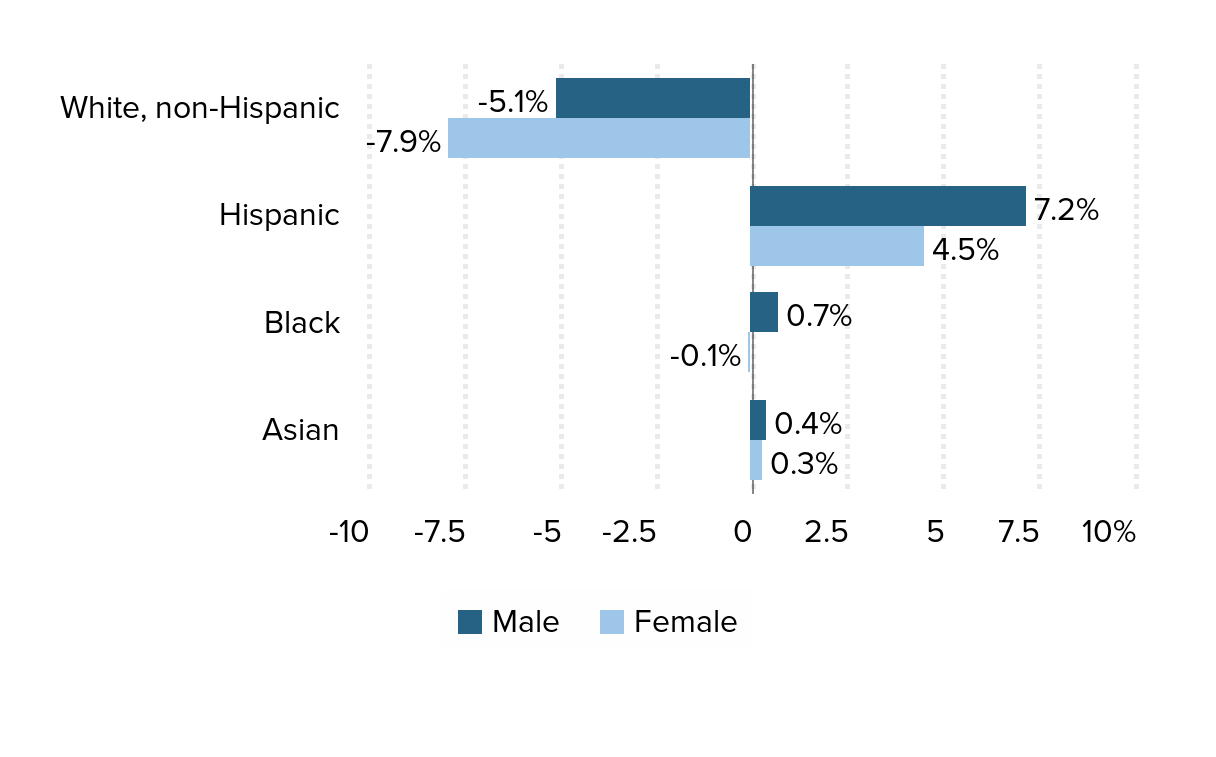
Note: The working class consists of members of the labor force who have less than a bachelor's degree.
Source: EPI analysis of educational attainment trends from 1993–2013 Current Population Survey Annual Social and Economic Supplement and Bureau of Labor Statistics' long-term labor force projections for 2005–2050
Prime-age working class becomes majority-minority in 2029: Projected racial/ethnic composition of 25- to 54-year-olds in the labor force with less than a bachelor's degree, 2013–2032
| White, non-Hispanic | Hispanic | Black | Asian | |
|---|---|---|---|---|
| 2013 | 60.3% | 21.6% | 14.7% | 3.4% |
| 2014 | 59.6% | 22.2% | 14.8% | 3.4% |
| 2015 | 58.8% | 22.8% | 14.9% | 3.5% |
| 2016 | 58.0% | 23.5% | 15.0% | 3.5% |
| 2017 | 57.2% | 24.1% | 15.1% | 3.6% |
| 2018 | 56.4% | 24.8% | 15.2% | 3.6% |
| 2019 | 55.6% | 25.4% | 15.3% | 3.7% |
| 2020 | 54.9% | 26.0% | 15.4% | 3.7% |
| 2021 | 54.2% | 26.6% | 15.4% | 3.8% |
| 2022 | 53.6% | 27.1% | 15.5% | 3.8% |
| 2023 | 53.0% | 27.7% | 15.5% | 3.8% |
| 2024 | 52.4% | 28.2% | 15.6% | 3.8% |
| 2025 | 51.8% | 28.8% | 15.6% | 3.8% |
| 2026 | 51.1% | 29.4% | 15.6% | 3.8% |
| 2027 | 50.6% | 30.0% | 15.6% | 3.8% |
| 2028 | 50.1% | 30.5% | 15.6% | 3.8% |
| 2029 | 49.6% | 31.1% | 15.6% | 3.7% |
| 2030 | 49.1% | 31.6% | 15.6% | 3.7% |
| 2031 | 48.6% | 32.2% | 15.6% | 3.7% |
| 2032 | 48.1% | 32.7% | 15.6% | 3.6% |
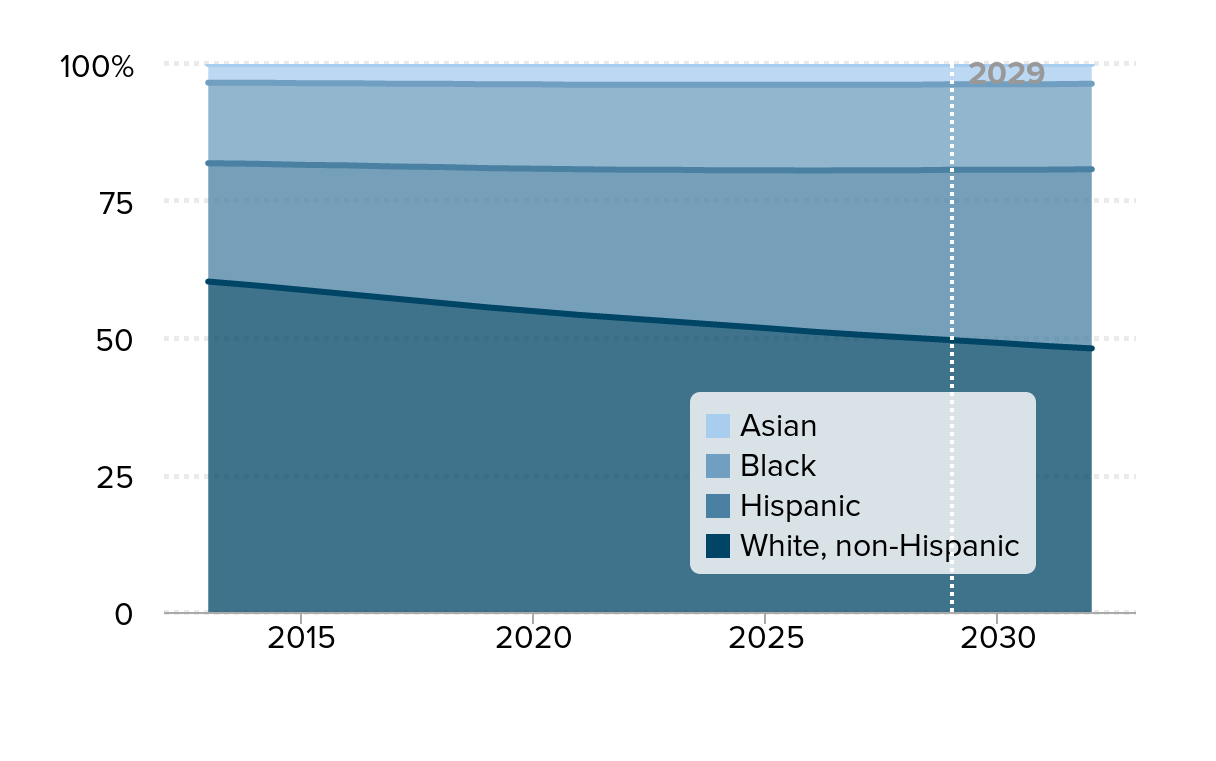
Note: Line represents demographic transition from the majority (50 percent or more), for white, non-Hispanic, working class.
Source: EPI analysis of educational attainment trends from 1993-2013 Current Population Survey Annual Social and Economic Supplement and Bureau of Labor Statistics' long-term labor force projections for 2005–2050
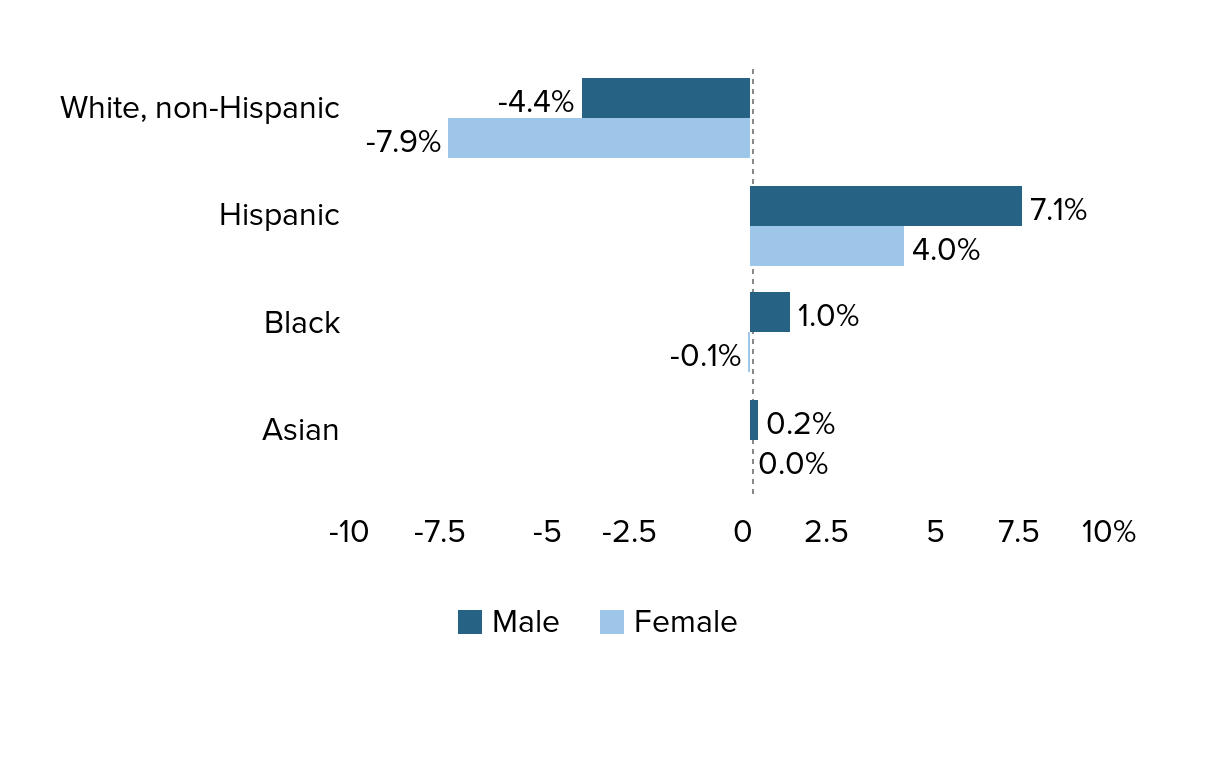
Change in projected demographic of working class, ages 25–54, by gender, race and ethnicity, 2013 and projected 2032
| Male | Female | |
|---|---|---|
| White, non-Hispanic | -4.4% | -7.9% |
| Hispanic | 7.1% | 4.0% |
| Black | 1.0% | -0.1% |
| Asian | 0.2% | 0.0% |
Source: EPI analysis of educational attainment trends from 1993-2013 CPS ASEC and BLS long-term labor force projections for 2005-2050
Older millennial working class becomes majority-minority in 2021: Projected racial/ethnic composition of 25- to 34-year-olds in the labor force with less than a bachelor's degree, 2013–2032
| White, non-Hispanic | Hispanic | Black | Asian | |
|---|---|---|---|---|
| 2013 | 56.1% | 24.5% | 16.5% | 2.9% |
| 2014 | 55.7% | 24.9% | 16.6% | 2.8% |
| 2015 | 55.1% | 25.3% | 16.8% | 2.8% |
| 2016 | 54.4% | 25.8% | 17.0% | 2.7% |
| 2017 | 53.7% | 26.5% | 17.1% | 2.7% |
| 2018 | 52.8% | 27.3% | 17.3% | 2.7% |
| 2019 | 51.8% | 28.2% | 17.4% | 2.6% |
| 2020 | 50.8% | 29.2% | 17.4% | 2.6% |
| 2021 | 49.9% | 30.1% | 17.4% | 2.6% |
| 2022 | 49.0% | 30.1% | 17.4% | 2.6% |
| 2023 | 48.1% | 30.1% | 17.4% | 2.6% |
| 2024 | 47.2% | 30.1% | 17.4% | 2.6% |
| 2025 | 46.3% | 30.1% | 17.4% | 2.6% |
| 2026 | 45.4% | 30.1% | 17.4% | 2.6% |
| 2027 | 44.5% | 30.1% | 17.4% | 2.6% |
| 2028 | 43.7% | 30.1% | 17.4% | 2.6% |
| 2029 | 43.0% | 30.1% | 17.4% | 2.6% |
| 2030 | 42.3% | 30.1% | 17.4% | 2.6% |
| 2031 | 41.5% | 30.1% | 17.4% | 2.6% |
| 2032 | 40.8% | 30.1% | 17.4% | 2.6% |
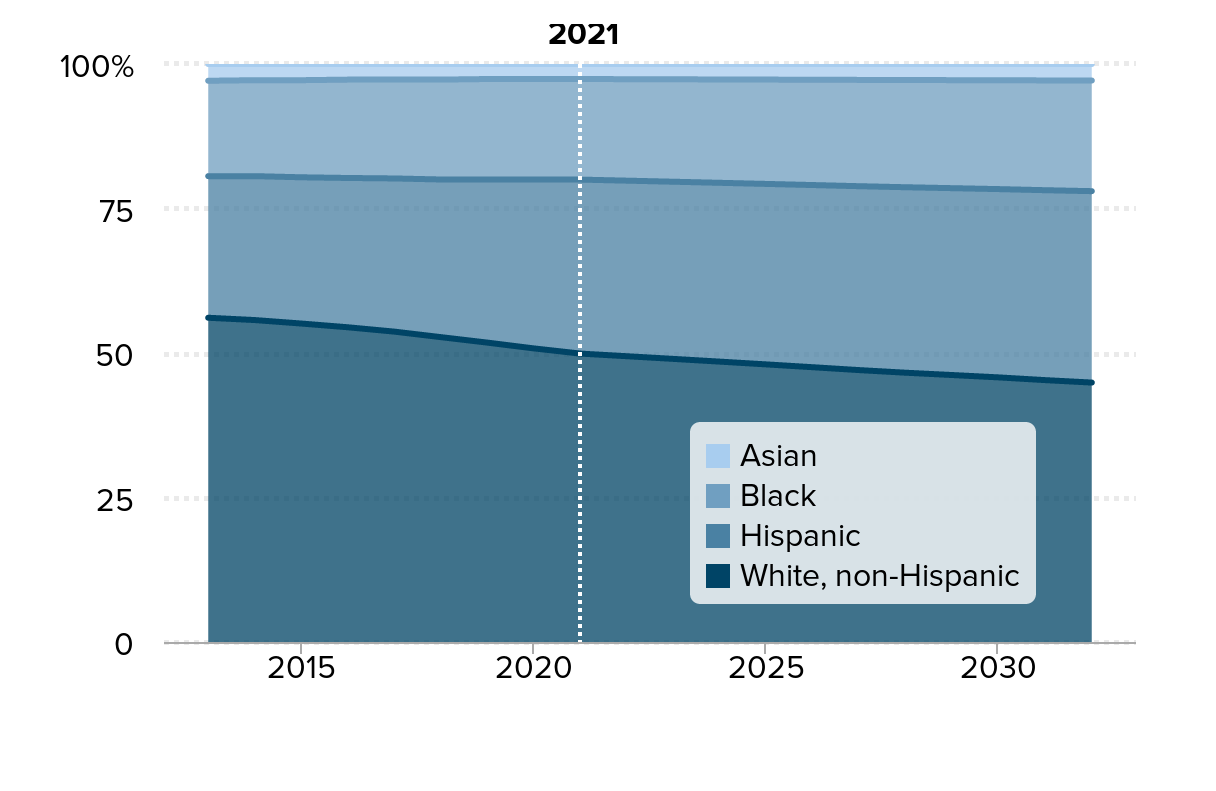
Note: Line represents demographic transition from the majority (50 percent or more), for white, non-Hispanic, working class.
Source: EPI analysis of educational attainment trends from 1993-2013 Current Population Survey Annual Social and Economic Supplement and Bureau of Labor Statistics' long-term labor force projections for 2005–2050
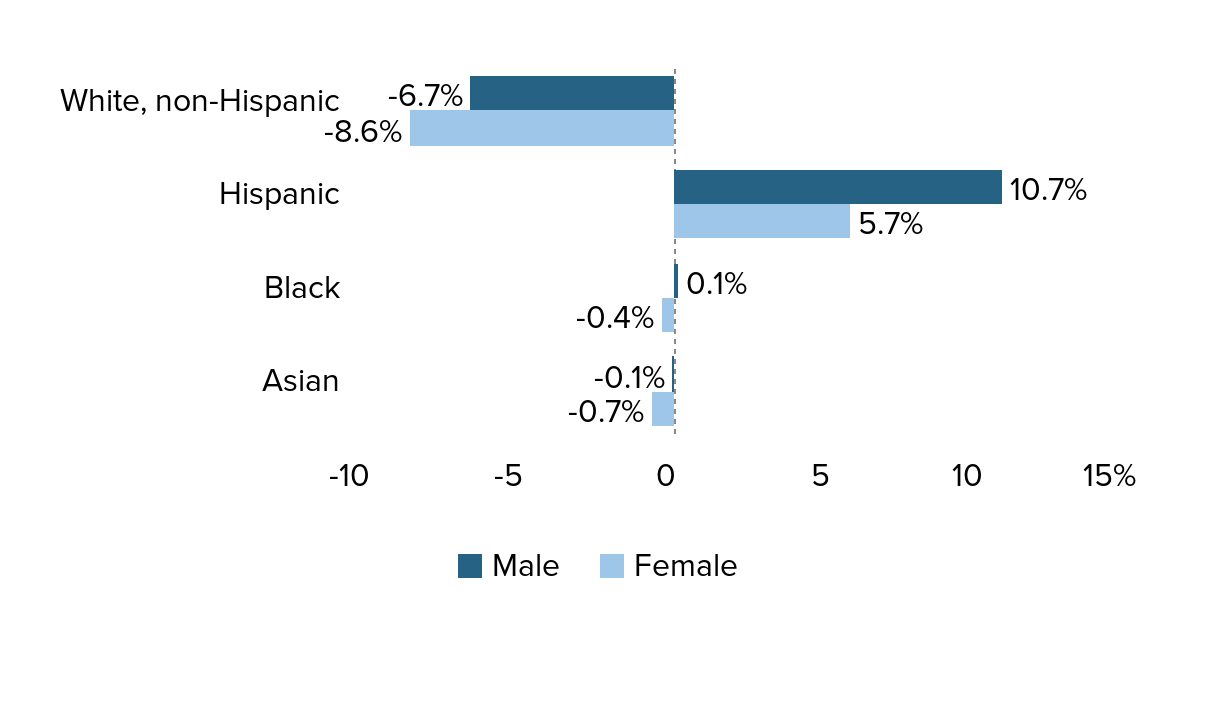
Change in projected demographic of working class, ages 25–34, by gender, race and ethnicity, 2013 and projected 2032
| Male | Female | |
|---|---|---|
| White, non-Hispanic | -6.7% | -8.6% |
| Hispanic | 10.7% | 5.7% |
| Black | 0.1% | -0.4% |
| Asian | -0.1% | -0.7% |
Source: EPI analysis of educational attainment trends from 1993-2013 CPS ASEC and BLS long-term labor force projections for 2005-2050
All workers’ wages—regardless of gender, race, or ethnicity—have failed to rise in tandem with productivity: Hourly median wage growth by gender, race, and ethnicity, compared with economy-wide productivity growth, 1979–2014
| Year | White men | White women | Black men | Black women | Hispanic men | Hispanic women | Productivity |
|---|---|---|---|---|---|---|---|
| 1979 | 0.0% | 0.0% | 0.0% | 0.0% | 0.0% | 0.0% | 0.0% |
| 1980 | -2.1% | -0.2% | -2.0% | -1.9% | -3.2% | 1.6% | -0.8% |
| 1981 | -3.8% | -1.6% | -3.3% | 0.0% | -5.4% | -0.3% | 1.4% |
| 1982 | -3.9% | -0.6% | -7.1% | -0.8% | -6.6% | 2.8% | -0.1% |
| 1983 | -5.1% | 0.5% | -6.6% | -1.2% | -8.9% | 1.4% | 2.9% |
| 1984 | -5.5% | 1.0% | -5.9% | -1.2% | -7.3% | 1.0% | 5.6% |
| 1985 | -2.6% | 1.5% | -8.2% | 1.4% | -7.8% | 1.1% | 7.3% |
| 1986 | -2.4% | 5.4% | -4.5% | 3.0% | -7.3% | 2.7% | 9.5% |
| 1987 | -4.1% | 7.8% | -5.6% | 3.0% | -8.0% | 4.2% | 10.1% |
| 1988 | -4.5% | 8.8% | -5.0% | 4.0% | -9.9% | 3.2% | 11.4% |
| 1989 | -5.3% | 9.0% | -8.9% | 6.0% | -13.1% | 0.5% | 12.3% |
| 1990 | -7.0% | 8.9% | -9.9% | 4.8% | -17.3% | -0.5% | 13.9% |
| 1991 | -6.6% | 9.4% | -11.2% | 5.3% | -18.0% | 1.7% | 14.8% |
| 1992 | -7.2% | 10.7% | -11.8% | 5.8% | -17.1% | 3.2% | 18.9% |
| 1993 | -8.0% | 12.1% | -11.6% | 7.0% | -18.4% | 1.6% | 19.3% |
| 1994 | -9.0% | 12.0% | -11.6% | 5.2% | -19.9% | 0.0% | 20.5% |
| 1995 | -8.8% | 11.7% | -11.3% | 4.5% | -20.7% | -1.5% | 20.5% |
| 1996 | -8.5% | 13.9% | -12.4% | 4.5% | -21.1% | -0.8% | 23.4% |
| 1997 | -6.3% | 14.7% | -9.8% | 5.6% | -19.1% | -1.4% | 25.2% |
| 1998 | -3.2% | 17.7% | -6.9% | 11.2% | -15.6% | 3.2% | 27.7% |
| 1999 | -0.8% | 21.2% | -3.0% | 11.4% | -13.7% | 3.6% | 30.7% |
| 2000 | -1.1% | 21.9% | -3.4% | 16.1% | -12.7% | 4.9% | 33.8% |
| 2001 | 0.7% | 25.6% | -0.5% | 15.1% | -12.6% | 8.9% | 35.9% |
| 2002 | 0.9% | 28.4% | -0.3% | 18.0% | -11.6% | 8.6% | 39.7% |
| 2003 | 2.6% | 29.6% | -0.9% | 21.4% | -11.3% | 13.2% | 44.2% |
| 2004 | 1.8% | 29.3% | 1.0% | 22.9% | -12.2% | 11.6% | 48.1% |
| 2005 | 0.0% | 30.0% | -4.7% | 15.4% | -12.6% | 9.3% | 50.7% |
| 2006 | 0.0% | 30.0% | -1.9% | 19.6% | -9.6% | 7.7% | 51.6% |
| 2007 | 1.3% | 30.5% | -3.0% | 18.2% | -10.0% | 10.6% | 52.7% |
| 2008 | 0.0% | 29.6% | -3.1% | 16.0% | -8.9% | 12.0% | 53.0% |
| 2009 | 3.6% | 31.5% | 0.0% | 20.8% | -8.1% | 12.5% | 56.1% |
| 2010 | 1.8% | 31.6% | -1.9% | 20.2% | -10.7% | 10.3% | 60.7% |
| 2011 | -1.4% | 30.3% | -5.5% | 16.9% | -13.3% | 11.7% | 60.9% |
| 2012 | -2.2% | 29.2% | -5.9% | 14.0% | -12.4% | 9.6% | 61.7% |
| 2013 | -3.1% | 30.6% | -4.9% | 15.9% | -13.1% | 9.1% | 61.9% |
| 2014 | -3.1% | 30.2% | -7.2% | 12.8% | -9.8% | 8.6% | 62.7% |
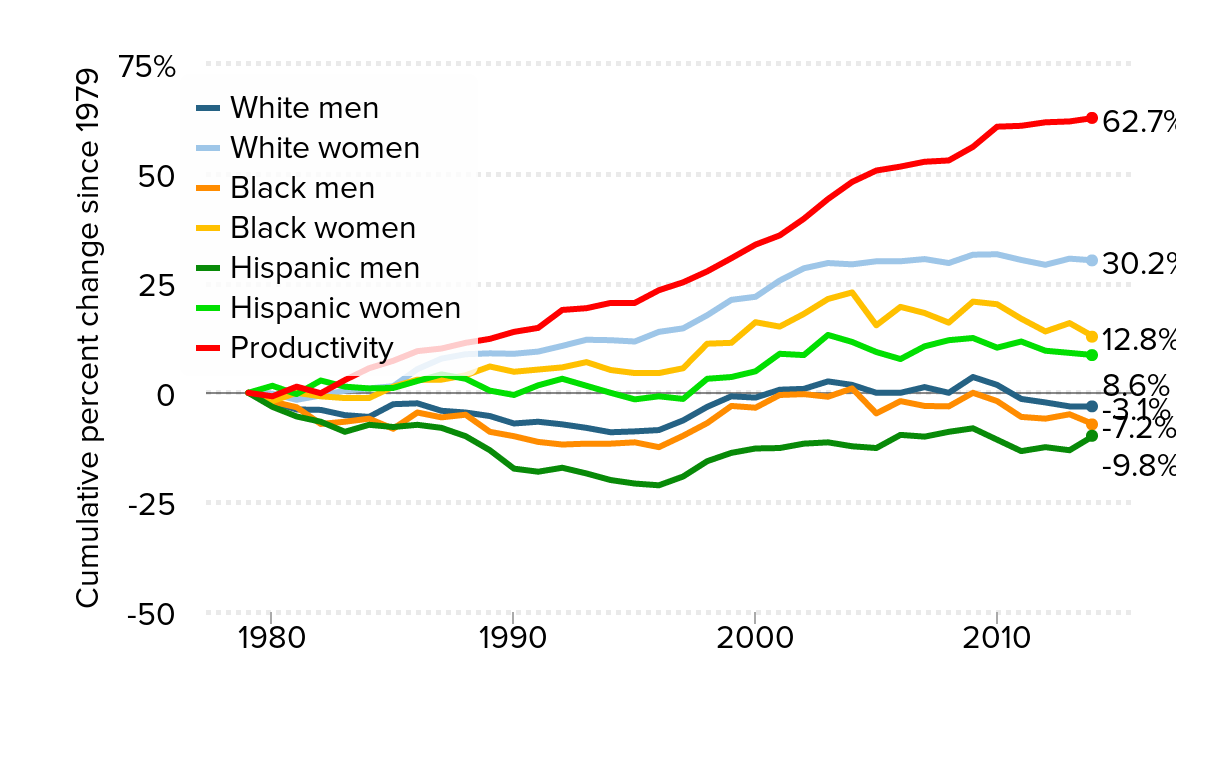
Note: Race/ethnicity categories are mutually exclusive (i.e., white non-Hispanic, black non-Hispanic, and Hispanic any race). This figure includes the entire civilian labor force.
Source: EPI analysis of unpublished Total Economy Productivity data from Bureau of Labor Statistics Labor Productivity and Costs program, and Current Population Survey Outgoing Rotation Group microdata
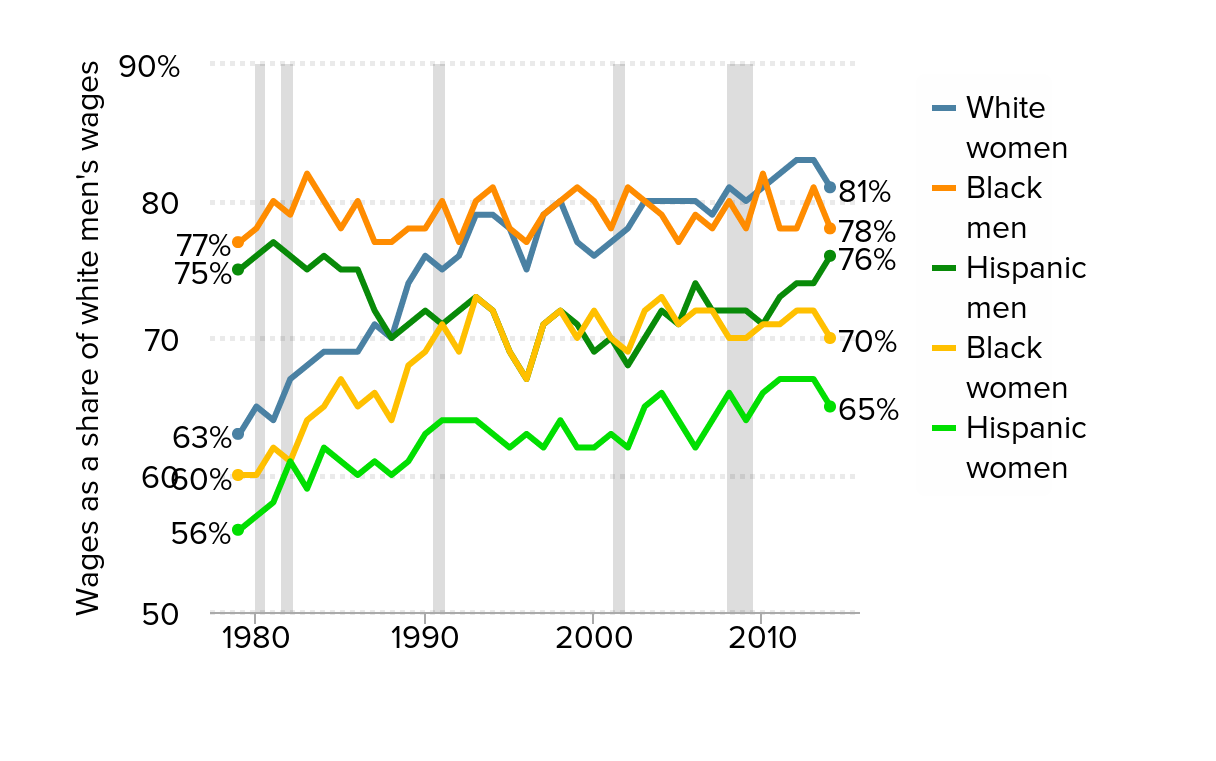
Working class median hourly wage ratios, all groups relative to white men
| White women | Black men | Black women | Hispanic men | Hispanic women | |
|---|---|---|---|---|---|
| 1979 | 63.0% | 77.0% | 60.0% | 75.0% | 56.0% |
| 1980 | 65.0% | 78.0% | 60.0% | 76.0% | 57.0% |
| 1981 | 64.0% | 80.0% | 62.0% | 77.0% | 58.0% |
| 1982 | 67.0% | 79.0% | 61.0% | 76.0% | 61.0% |
| 1983 | 68.0% | 82.0% | 64.0% | 75.0% | 59.0% |
| 1984 | 69.0% | 80.0% | 65.0% | 76.0% | 62.0% |
| 1985 | 69.0% | 78.0% | 67.0% | 75.0% | 61.0% |
| 1986 | 69.0% | 80.0% | 65.0% | 75.0% | 60.0% |
| 1987 | 71.0% | 77.0% | 66.0% | 72.0% | 61.0% |
| 1988 | 70.0% | 77.0% | 64.0% | 70.0% | 60.0% |
| 1989 | 74.0% | 78.0% | 68.0% | 71.0% | 61.0% |
| 1990 | 76.0% | 78.0% | 69.0% | 72.0% | 63.0% |
| 1991 | 75.0% | 80.0% | 71.0% | 71.0% | 64.0% |
| 1992 | 76.0% | 77.0% | 69.0% | 72.0% | 64.0% |
| 1993 | 79.0% | 80.0% | 73.0% | 73.0% | 64.0% |
| 1994 | 79.0% | 81.0% | 72.0% | 72.0% | 63.0% |
| 1995 | 78.0% | 78.0% | 69.0% | 69.0% | 62.0% |
| 1996 | 75.0% | 77.0% | 67.0% | 67.0% | 63.0% |
| 1997 | 79.0% | 79.0% | 71.0% | 71.0% | 62.0% |
| 1998 | 80.0% | 80.0% | 72.0% | 72.0% | 64.0% |
| 1999 | 77.0% | 81.0% | 70.0% | 71.0% | 62.0% |
| 2000 | 76.0% | 80.0% | 72.0% | 69.0% | 62.0% |
| 2001 | 77.0% | 78.0% | 70.0% | 70.0% | 63.0% |
| 2002 | 78.0% | 81.0% | 69.0% | 68.0% | 62.0% |
| 2003 | 80.0% | 80.0% | 72.0% | 70.0% | 65.0% |
| 2004 | 80.0% | 79.0% | 73.0% | 72.0% | 66.0% |
| 2005 | 80.0% | 77.0% | 71.0% | 71.0% | 64.0% |
| 2006 | 80.0% | 79.0% | 72.0% | 74.0% | 62.0% |
| 2007 | 79.0% | 78.0% | 72.0% | 72.0% | 64.0% |
| 2008 | 81.0% | 80.0% | 70.0% | 72.0% | 66.0% |
| 2009 | 80.0% | 78.0% | 70.0% | 72.0% | 64.0% |
| 2010 | 81.0% | 82.0% | 71.0% | 71.0% | 66.0% |
| 2011 | 82.0% | 78.0% | 71.0% | 73.0% | 67.0% |
| 2012 | 83.0% | 78.0% | 72.0% | 74.0% | 67.0% |
| 2013 | 83.0% | 81.0% | 72.0% | 74.0% | 67.0% |
| 2014 | 81.0% | 78.0% | 70.0% | 76.0% | 65.0% |
Source: EPI analysis of Current Population Survey public data series
Unionization higher among blacks, even as union density has declined: Union membership as a share of total employment, by race and ethnicity, 2000–2014
| White, non-Hispanic | Black | Hispanic | Asian | |
|---|---|---|---|---|
| 2000 | 13.0% | 17.2% | 11.1% | 11.5% |
| 2001 | 13.0% | 16.7% | 11.2% | 11.3% |
| 2002 | 12.8% | 16.9% | 10.6% | 11.6% |
| 2003 | 12.5% | 16.5% | 10.7% | 11.4% |
| 2004 | 12.2% | 15.1% | 10.1% | 11.4% |
| 2005 | 12.2% | 15.1% | 10.4% | 11.2% |
| 2006 | 11.7% | 14.5% | 9.8% | 10.4% |
| 2007 | 11.8% | 14.3% | 9.8% | 10.9% |
| 2008 | 12.2% | 14.5% | 10.6% | 10.6% |
| 2009 | 12.1% | 13.9% | 10.2% | 11.4% |
| 2010 | 11.7% | 13.4% | 10.0% | 10.9% |
| 2011 | 11.6% | 13.5% | 9.7% | 10.1% |
| 2012 | 11.1% | 13.4% | 9.8% | 9.6% |
| 2013 | 11.0% | 13.6% | 9.4% | 9.4% |
| 2014 | 10.8% | 13.2% | 9.2% | 10.4% |
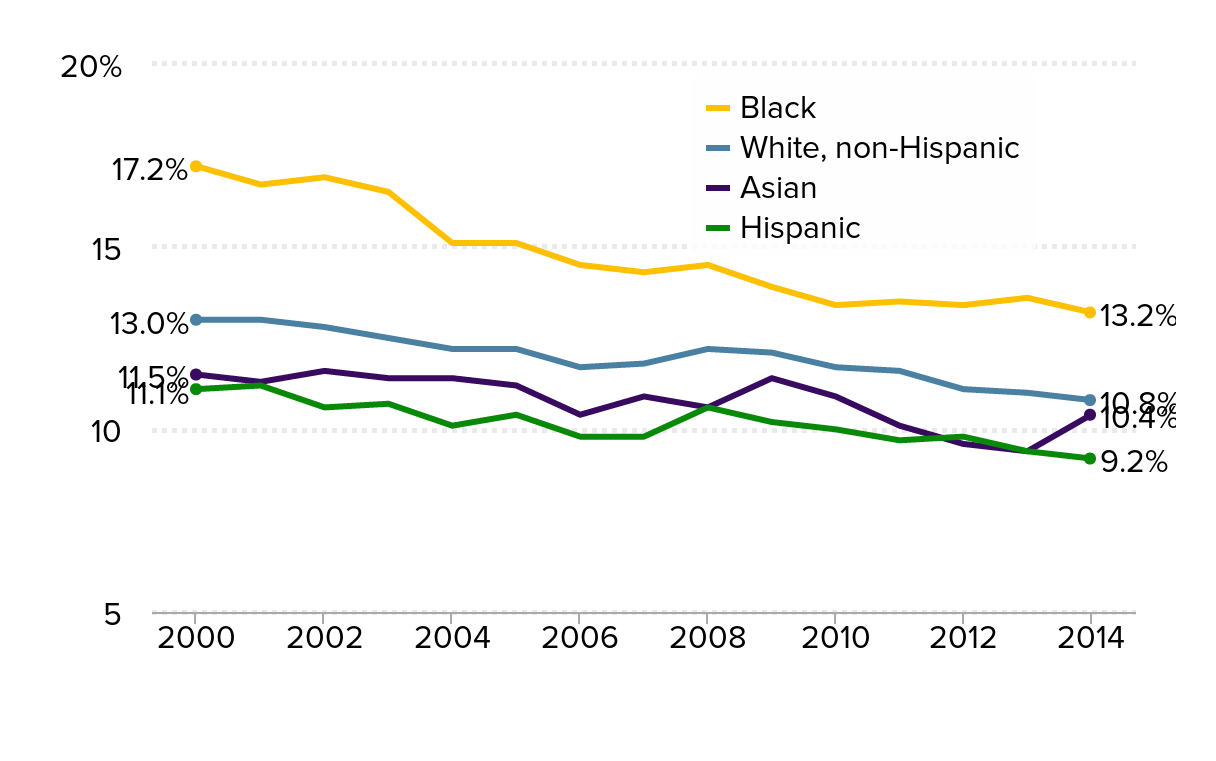
Source: EPI analysis of Current Population Survey public data series
Unemployment rate for those with less than a High School diploma, by race and ethnicity, 2000–2014
| Year | White, non-Hispanic | Black | Hispanic | Asian |
|---|---|---|---|---|
| 2000 | 5.6% | 10.7% | 6.2% | 5.7% |
| 2001 | 6.5 | 11.8 | 7.4 | 5.8 |
| 2002 | 7.6 | 13.3 | 7.7 | 8.4 |
| 2003 | 7.8 | 13.9 | 8.2 | 9.5 |
| 2004 | 7.5 | 15.5 | 7.5 | 5.9 |
| 2005 | 6.5 | 14.4 | 6.2 | 5.5 |
| 2006 | 5.9 | 12.8 | 5.5 | 3.8 |
| 2007 | 6.5 | 12 | 6 | 2.9 |
| 2008 | 8.2 | 14.5 | 8.2 | 6.4 |
| 2009 | 13.9 | 21.3 | 13.7 | 8.4 |
| 2010 | 13.9 | 22.5 | 13.2 | 11.1 |
| 2011 | 12.7 | 24.6 | 12 | 9.5 |
| 2012 | 11.4 | 20.4 | 11 | 6.8 |
| 2013 | 9.7 | 20.5 | 9.1 | 6.9 |
| 2014 | 7.8% | 17.2% | 7.4% | 6.9% |
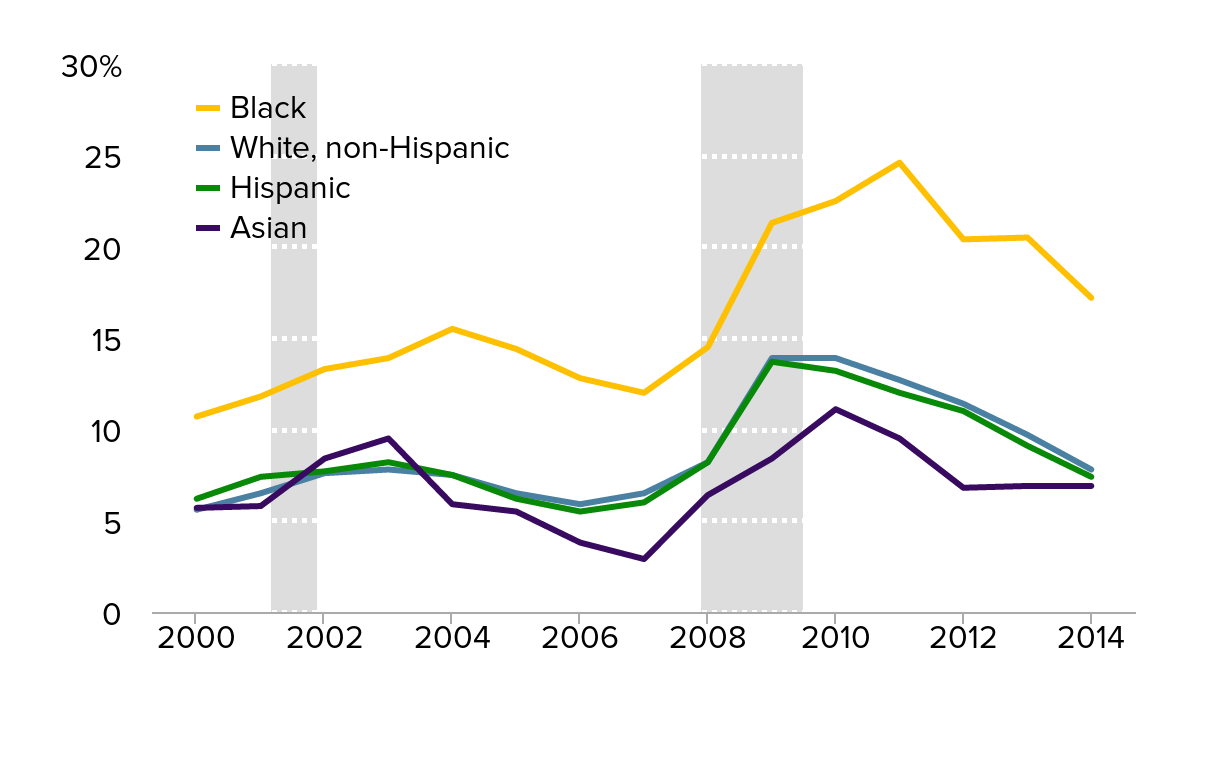
Note: Shaded area denotes recessions
Source: EPI analysis of Current Population Survey public data series
Unemployment rate for High School graduates, by race and ethnicity, 2000–2014
| Year | White, non-Hispanic | Black | Hispanic | Asian |
|---|---|---|---|---|
| 2000 | 2.9% | 6.4% | 3.9% | 3% |
| 2001 | 3.6 | 7.4 | 4.5 | 4.1 |
| 2002 | 4.6 | 8.8 | 5.9 | 5.3 |
| 2003 | 4.8 | 9.3 | 5.9 | 5.6 |
| 2004 | 4.4 | 8.7 | 5.2 | 4.5 |
| 2005 | 4 | 8.5 | 4.5 | 4.6 |
| 2006 | 3.7 | 8 | 4.1 | 3.1 |
| 2007 | 3.9 | 7.3 | 4.4 | 3.2 |
| 2008 | 5.1 | 9.3 | 6.2 | 4.3 |
| 2009 | 9 | 14 | 10.4 | 7.5 |
| 2010 | 9.5 | 15.8 | 11.5 | 7.6 |
| 2011 | 8.4 | 15.5 | 10.3 | 7.6 |
| 2012 | 7.5 | 13.4 | 9 | 6.1 |
| 2013 | 6.6 | 12.6 | 7.9 | 5.4 |
| 2014 | 5.1% | 10.7% | 6.2% | 4.5% |
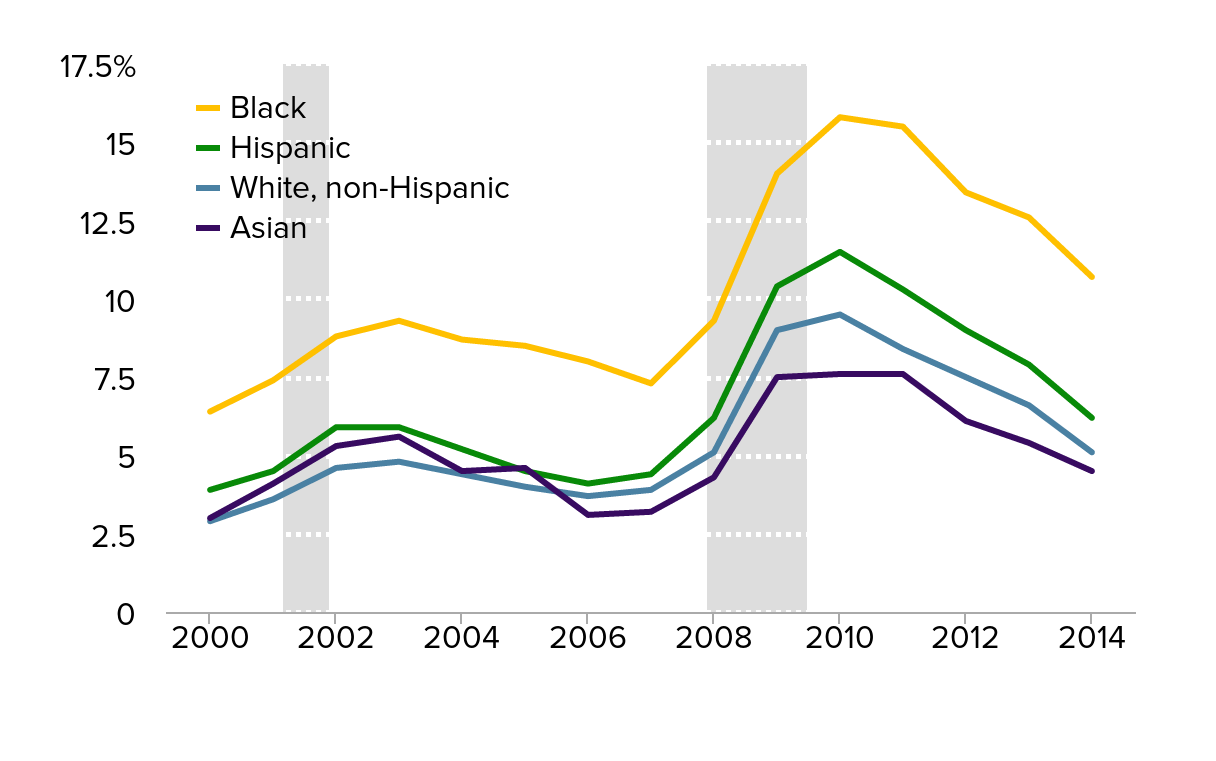
Note: Shaded area denotes recessions
Source: EPI analysis of Current Population Survey public data series
Unemployment rate for those with some college or associate degree, by race and ethnicity, 2000–2014
| Year | White, non-Hispanic | Black | Hispanic | Asian |
|---|---|---|---|---|
| 2000 | 2.4% | 4% | 3.2% | 3.2% |
| 2001 | 3 | 5 | 3.8 | 3.8 |
| 2002 | 4.1 | 6.7 | 5.4 | 6.1 |
| 2003 | 4.2 | 7.9 | 5.7 | 5.9 |
| 2004 | 3.7 | 7.6 | 4.8 | 4.8 |
| 2005 | 3.4 | 6.9 | 4.1 | 3.2 |
| 2006 | 3.2 | 6.2 | 3.6 | 3.1 |
| 2007 | 3.2 | 5.5 | 4.1 | 3.7 |
| 2008 | 4.1 | 7.4 | 5 | 3.8 |
| 2009 | 7.3 | 11.5 | 9.2 | 8.3 |
| 2010 | 7.6 | 12.4 | 9.7 | 8.1 |
| 2011 | 7 | 13.1 | 9.1 | 7.4 |
| 2012 | 6.3 | 11.1 | 8 | 6.7 |
| 2013 | 5.6 | 9.8 | 7 | 5.7 |
| 2014 | 4.7% | 8.9% | 5.8% | 4.9% |
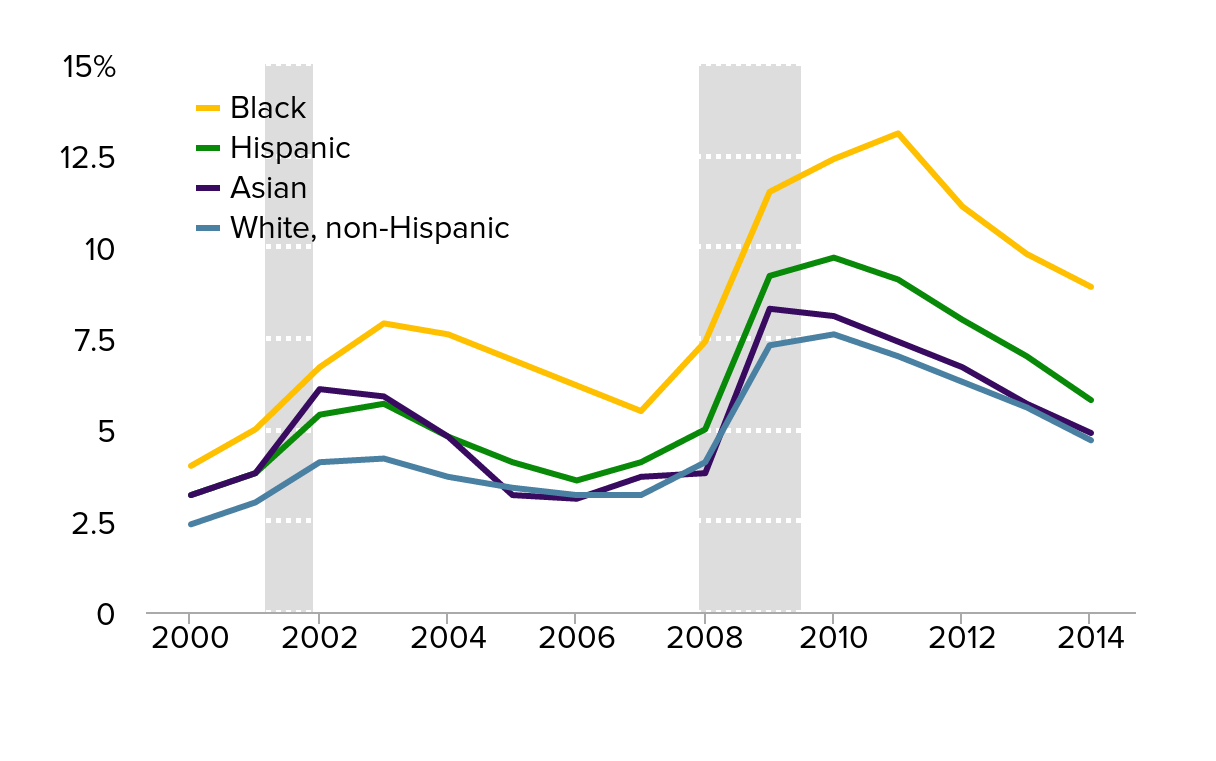
Note: Shaded area denotes recessions
Source: EPI analysis of Current Population Survey public data series
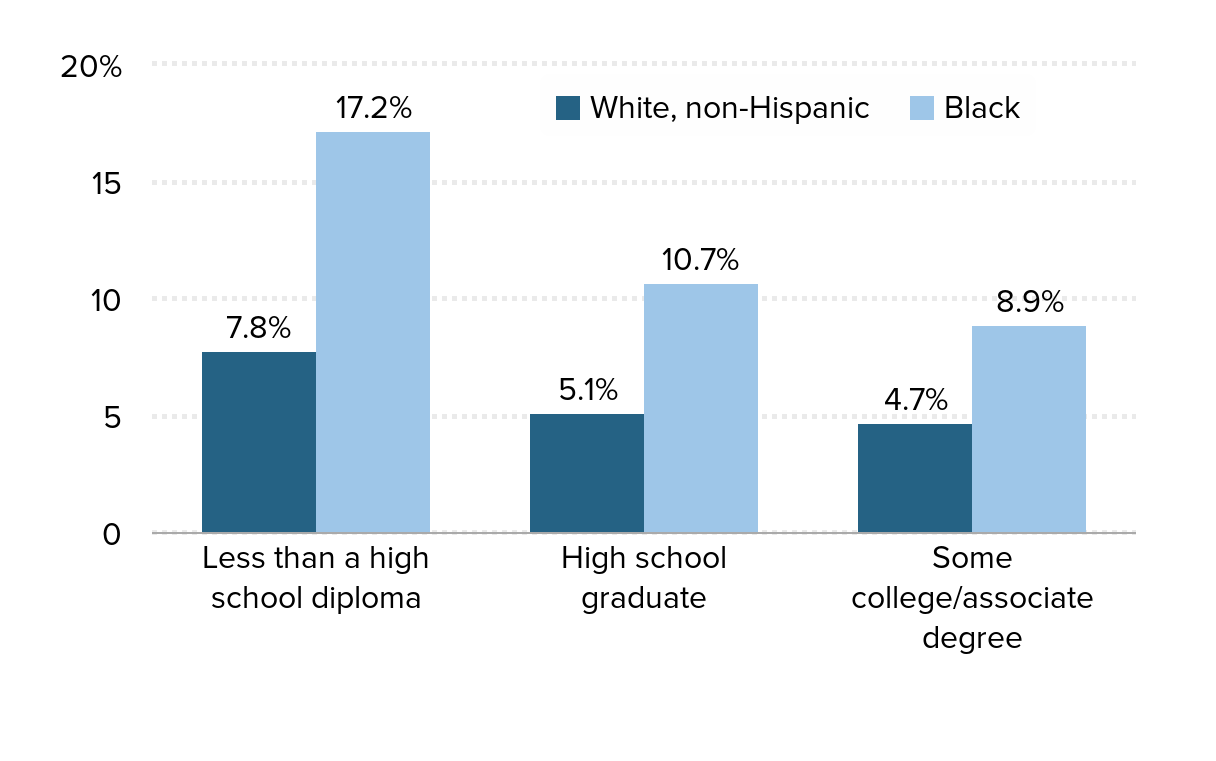
Even the most educated working-class blacks face higher joblessness: Unemployment rate of 18- to 64-year-olds in the labor force with less than a bachelor's degree, by highest level of educational attainment and race/ethnicity, 2014
| White, non-Hispanic | Black | |
|---|---|---|
| Less than a high school diploma | 7.8% | 17.2% |
| High school graduate | 5.1% | 10.7% |
| Some college/associate degree | 4.7% | 8.9% |
Source: EPI analysis of Current Population Survey public data series
Shifting working class demographics have implications for:
- Class and racial/ethnic inequality in economic outcomes (employment, pay/income, wealth)
- Place/race-based inequities in education (K-12 and access to higher ed)
- Future of social insurance and social programs
- Politics


Thank you!
Get this presentation at go.epi.org/changingworkforce