The teacher pay gap is wider than ever
Teachers’ pay continues to fall further behind pay of comparable workers
Lawrence Mishel
President
Economic Policy Institute
Get this presentation at
go.epi.org/teacherpayslides
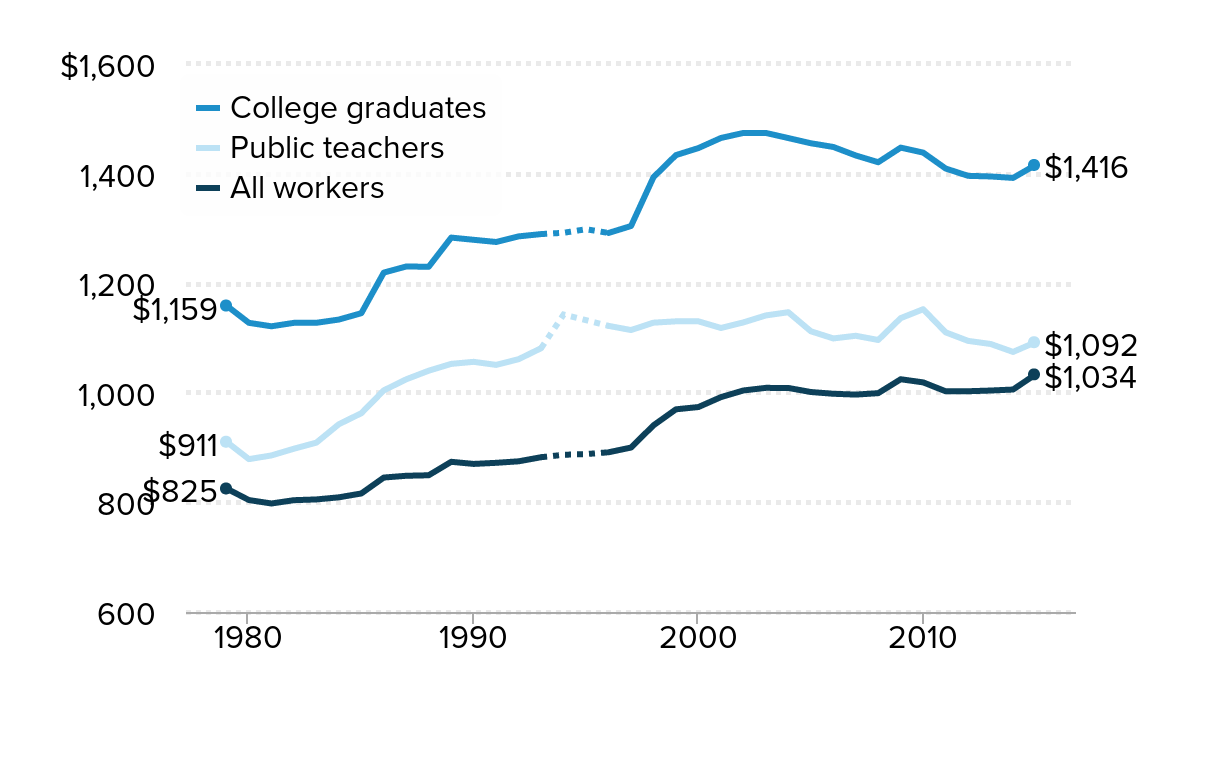
Teachers' weekly wages are 23 percent lower than those of other college graduates: Average weekly wages of public school teachers, other college graduates, and all workers, 1979–2015 (2015 dollars)
| Year | College graduates | Public teachers | All workers | College graduates 1993-1996 | Public teachers 1993-1996 | All workers 1993-1996 | College graduates 1996-2015 | Public teachers 1996-2015 | All workers 1996-2015 |
|---|---|---|---|---|---|---|---|---|---|
| 1979 | $1,159.28 | $910.71 | $825.41 | ||||||
| 1980 | $1,127.66 | $878.95 | $804.27 | ||||||
| 1981 | $1,121.37 | $885.72 | $798.02 | ||||||
| 1982 | $1,127.64 | $897.94 | $804.04 | ||||||
| 1983 | $1,127.76 | $909.05 | $805.43 | ||||||
| 1984 | $1,133.64 | $942.59 | $809.26 | ||||||
| 1985 | $1,145.26 | $962.77 | $816.31 | ||||||
| 1986 | $1,219.36 | $1,004.44 | $845.37 | ||||||
| 1987 | $1,230.49 | $1,024.64 | $848.58 | ||||||
| 1988 | $1,230.00 | $1,040.33 | $849.52 | ||||||
| 1989 | $1,283.22 | $1,052.79 | $874.08 | ||||||
| 1990 | $1,279.18 | $1,056.51 | $870.21 | ||||||
| 1991 | $1,275.22 | $1,050.92 | $872.23 | ||||||
| 1992 | $1,285.44 | $1,061.32 | $874.97 | ||||||
| 1993 | $1,289.63 | $1,081.41 | $882.46 | $1,289.63 | $1,081.41 | $882.46 | |||
| 1994 | $1,292.00 | $1,142.80 | $886.88 | ||||||
| 1995 | $1,298.49 | $1,132.49 | $888.16 | ||||||
| 1996 | $1,291.66 | $1,122.15 | $891.45 | $1,291.66 | $1,122.15 | $891.45 | |||
| 1997 | $1,304.36 | $1,114.51 | $900.08 | ||||||
| 1998 | $1,393.47 | $1,127.98 | $940.64 | ||||||
| 1999 | $1,433.74 | $1,130.44 | $969.87 | ||||||
| 2000 | $1,446.58 | $1,130.42 | $973.99 | ||||||
| 2001 | $1,464.99 | $1,118.32 | $992.11 | ||||||
| 2002 | $1,474.18 | $1,128.45 | $1,004.25 | ||||||
| 2003 | $1,474.20 | $1,141.19 | $1,009.01 | ||||||
| 2004 | $1,464.86 | $1,147.04 | $1,008.86 | ||||||
| 2005 | $1,455.38 | $1,112.30 | $1,001.44 | ||||||
| 2006 | $1,448.64 | $1,099.21 | $998.23 | ||||||
| 2007 | $1,433.08 | $1,104.06 | $996.73 | ||||||
| 2008 | $1,420.76 | $1,096.40 | $999.33 | ||||||
| 2009 | $1,447.42 | $1,136.25 | $1,024.73 | ||||||
| 2010 | $1,438.30 | $1,152.53 | $1,019.01 | ||||||
| 2011 | $1,409.30 | $1,110.35 | $1,002.78 | ||||||
| 2012 | $1,395.91 | $1,094.73 | $1,002.84 | ||||||
| 2013 | $1,394.79 | $1,089.08 | $1,004.13 | ||||||
| 2014 | $1,392.11 | $1,074.60 | $1,005.98 | ||||||
| 2015 | $1,415.73 | $1,092.35 | $1,033.60 |
Source: Authors' analysis of Current Population Survey Outgoing Rotation Group data
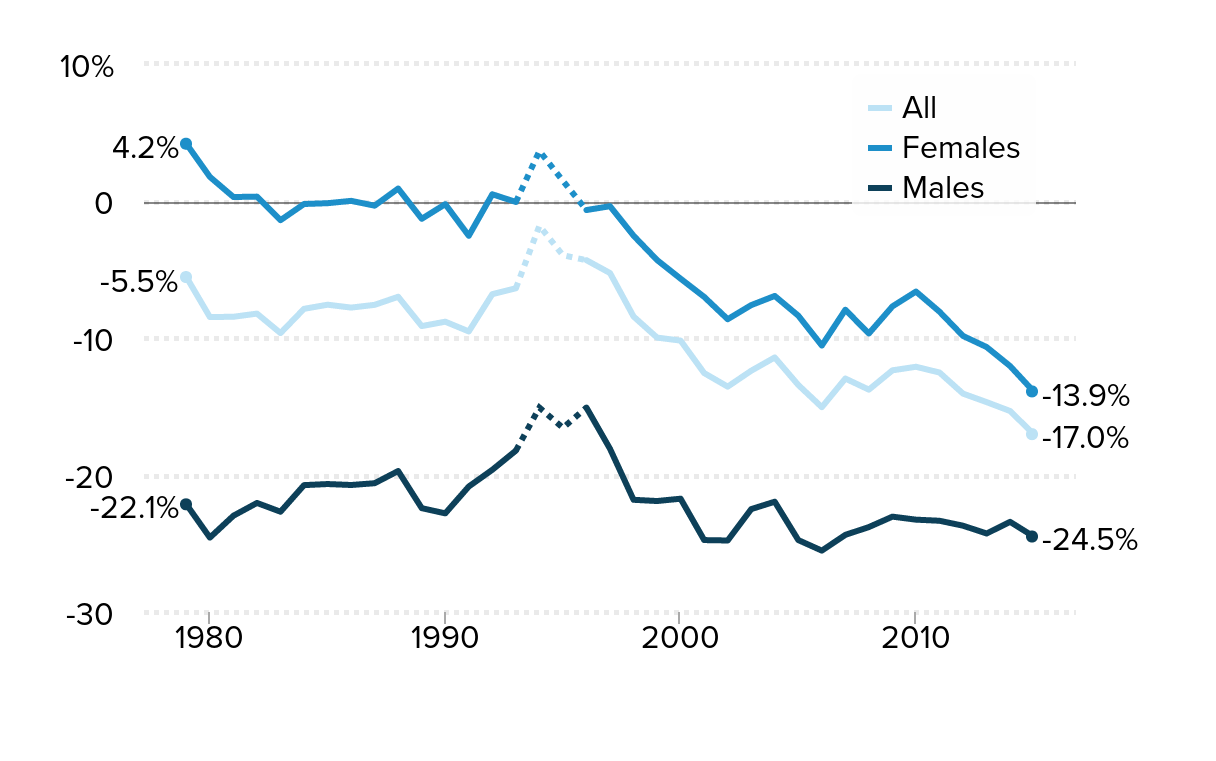
The teacher wage gap grew from -5.5 percent in 1979 to a record -17.0 percent in 2015: Wage gap between public school teachers and similar workers, 1979–2015
| Year | All | Females | Males | All 1993-1996 | Females 1993-1996 | Males 1993-1996 | All 1996-2015 | Females 1996-2015 | Males 1996-2015 |
|---|---|---|---|---|---|---|---|---|---|
| 1979 | -5.55% | 4.18% | -22.14% | ||||||
| 1980 | -8.47% | 1.76% | -24.57% | ||||||
| 1981 | -8.45% | 0.29% | -22.97% | ||||||
| 1982 | -8.22% | 0.32% | -22.04% | ||||||
| 1983 | -9.64% | -1.40% | -22.68% | ||||||
| 1984 | -7.87% | -0.22% | -20.74% | ||||||
| 1985 | -7.57% | -0.16% | -20.66% | ||||||
| 1986 | -7.78% | 0.01% | -20.73% | ||||||
| 1987 | -7.58% | -0.34% | -20.60% | ||||||
| 1988 | -6.99% | 0.91% | -19.71% | ||||||
| 1989 | -9.13% | -1.30% | -22.42% | ||||||
| 1990 | -8.81% | -0.23% | -22.80% | ||||||
| 1991 | -9.52% | -2.54% | -20.84% | ||||||
| 1992 | -6.80% | 0.49% | -19.62% | ||||||
| 1993 | -6.37% | -0.07% | -18.22% | -6.37% | -0.07% | -18.22% | |||
| 1994 | -1.81% | 3.65% | -15.08% | ||||||
| 1995 | -3.96% | 1.47% | -16.56% | ||||||
| 1996 | -4.32% | -0.66% | -15.08% | -4.32% | -0.66% | -15.08% | |||
| 1997 | -5.26% | -0.38% | -18.09% | ||||||
| 1998 | -8.43% | -2.53% | -21.81% | ||||||
| 1999 | -9.97% | -4.31% | -21.90% | ||||||
| 2000 | -10.19% | -5.67% | -21.73% | ||||||
| 2001 | -12.56% | -7.00% | -24.75% | ||||||
| 2002 | -13.55% | -8.63% | -24.78% | ||||||
| 2003 | -12.39% | -7.60% | -22.49% | ||||||
| 2004 | -11.42% | -6.93% | -21.95% | ||||||
| 2005 | -13.43% | -8.37% | -24.75% | ||||||
| 2006 | -15.05% | -10.55% | -25.52% | ||||||
| 2007 | -12.96% | -7.94% | -24.37% | ||||||
| 2008 | -13.77% | -9.67% | -23.80% | ||||||
| 2009 | -12.36% | -7.69% | -23.04% | ||||||
| 2010 | -12.10% | -6.61% | -23.26% | ||||||
| 2011 | -12.52% | -8.08% | -23.34% | ||||||
| 2012 | -14.06% | -9.85% | -23.70% | ||||||
| 2013 | -14.68% | -10.66% | -24.27% | ||||||
| 2014 | -15.33% | -12.05% | -23.42% | ||||||
| 2015 | -17.02% | -13.90% | -24.49% |
Source: Authors' analysis of Current Population Survey Outgoing Rotation Group data
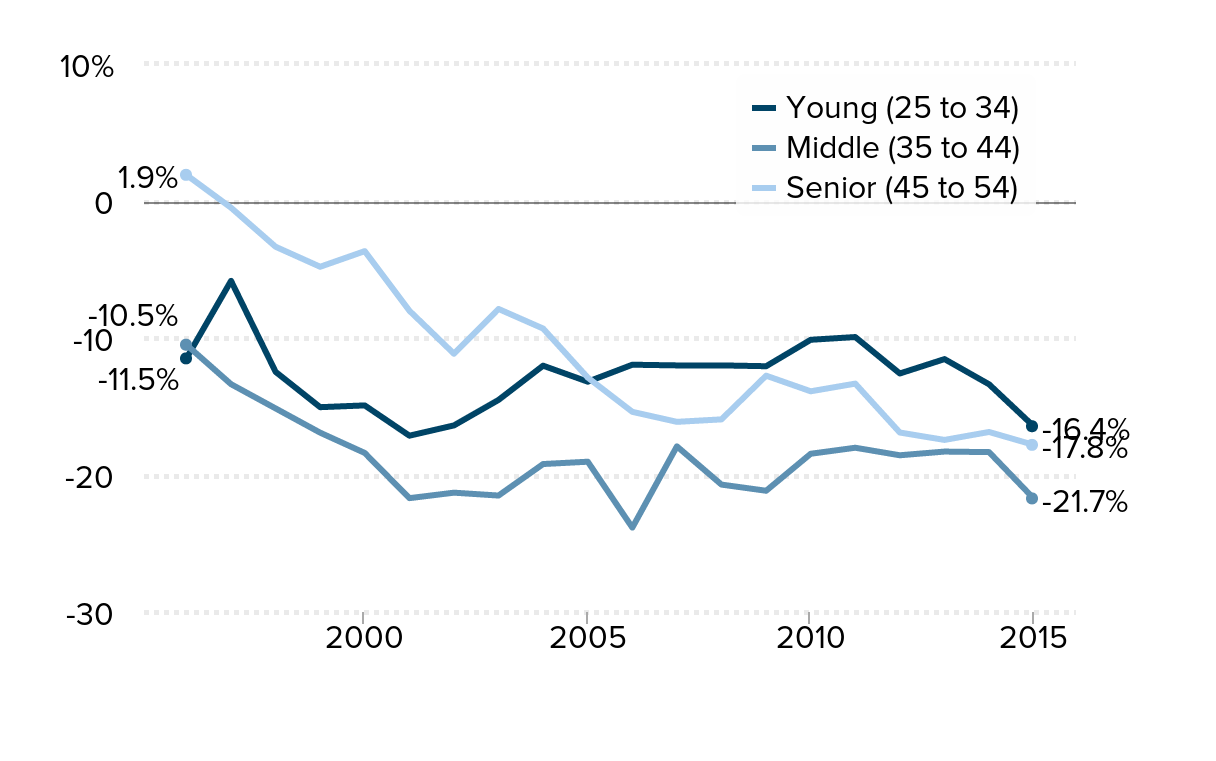
The teacher wage gap grew more for experienced teachers: Wage gap between public school teachers and similar workers, by age cohort, 1996–2015
| Year | Young (25 to 34) | Middle (35 to 44) | Senior (45 to 54) |
|---|---|---|---|
| 1996 | -11.49% | -10.49% | 1.91% |
| 1997 | -5.83% | -13.37% | -0.49% |
| 1998 | -12.47% | -15.14% | -3.34% |
| 1999 | -15.05% | -16.91% | -4.80% |
| 2000 | -14.92% | -18.39% | -3.66% |
| 2001 | -17.13% | -21.69% | -8.01% |
| 2002 | -16.38% | -21.29% | -11.15% |
| 2003 | -14.52% | -21.50% | -7.88% |
| 2004 | -12.02% | -19.20% | -9.31% |
| 2005 | -13.19% | -19.03% | -12.89% |
| 2006 | -11.95% | -23.84% | -15.39% |
| 2007 | -12.00% | -17.91% | -16.12% |
| 2008 | -12.00% | -20.70% | -15.94% |
| 2009 | -12.06% | -21.15% | -12.75% |
| 2010 | -10.13% | -18.45% | -13.89% |
| 2011 | -9.93% | -18.01% | -13.33% |
| 2012 | -12.59% | -18.56% | -16.90% |
| 2013 | -11.54% | -18.29% | -17.44% |
| 2014 | -13.38% | -18.33% | -16.86% |
| 2015 | -16.44% | -21.71% | -17.80% |
Source: Authors' analysis of Current Population Survey Outgoing Rotation Group data
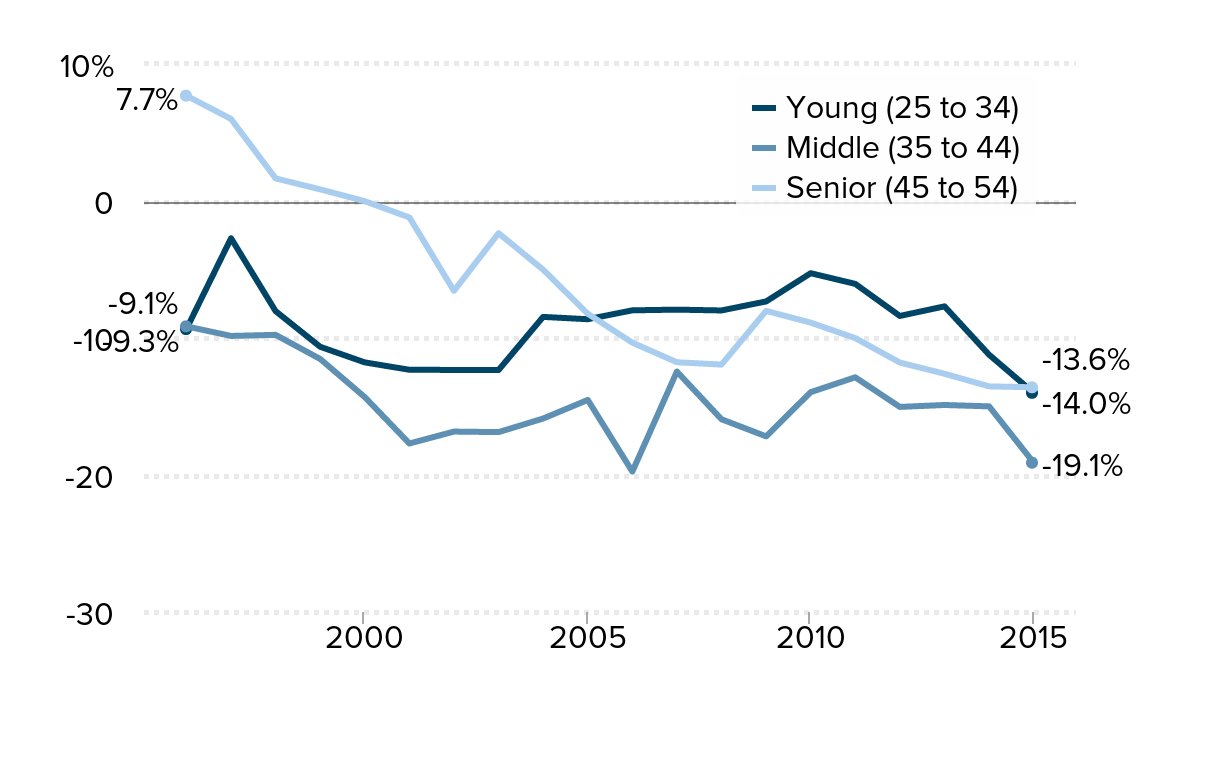
Regardless of experience, teacher wage gap expanded for female teachers: Wage gap between female public school teachers and similar female workers, by age cohort, 1996–2015
| Year | Young (25 to 34) | Middle (35 to 44) | Senior (45 to 54) |
|---|---|---|---|
| 1996 | -9.35% | -9.15% | 7.69% |
| 1997 | -2.72% | -9.85% | 5.99% |
| 1998 | -8.04% | -9.77% | 1.65% |
| 1999 | -10.64% | -11.53% | 0.85% |
| 2000 | -11.78% | -14.31% | -0.01% |
| 2001 | -12.32% | -17.70% | -1.20% |
| 2002 | -12.33% | -16.83% | -6.56% |
| 2003 | -12.34% | -16.87% | -2.35% |
| 2004 | -8.46% | -15.88% | -5.01% |
| 2005 | -8.63% | -14.52% | -8.23% |
| 2006 | -7.98% | -19.75% | -10.34% |
| 2007 | -7.93% | -12.45% | -11.77% |
| 2008 | -7.99% | -15.93% | -11.94% |
| 2009 | -7.33% | -17.18% | -8.02% |
| 2010 | -5.27% | -13.95% | -8.88% |
| 2011 | -6.05% | -12.87% | -10.01% |
| 2012 | -8.39% | -15.03% | -11.79% |
| 2013 | -7.69% | -14.89% | -12.61% |
| 2014 | -11.22% | -14.99% | -13.53% |
| 2015 | -14.00% | -19.10% | -13.6% |
Source: Authors' analysis of Current Population Survey Outgoing Rotation Group data
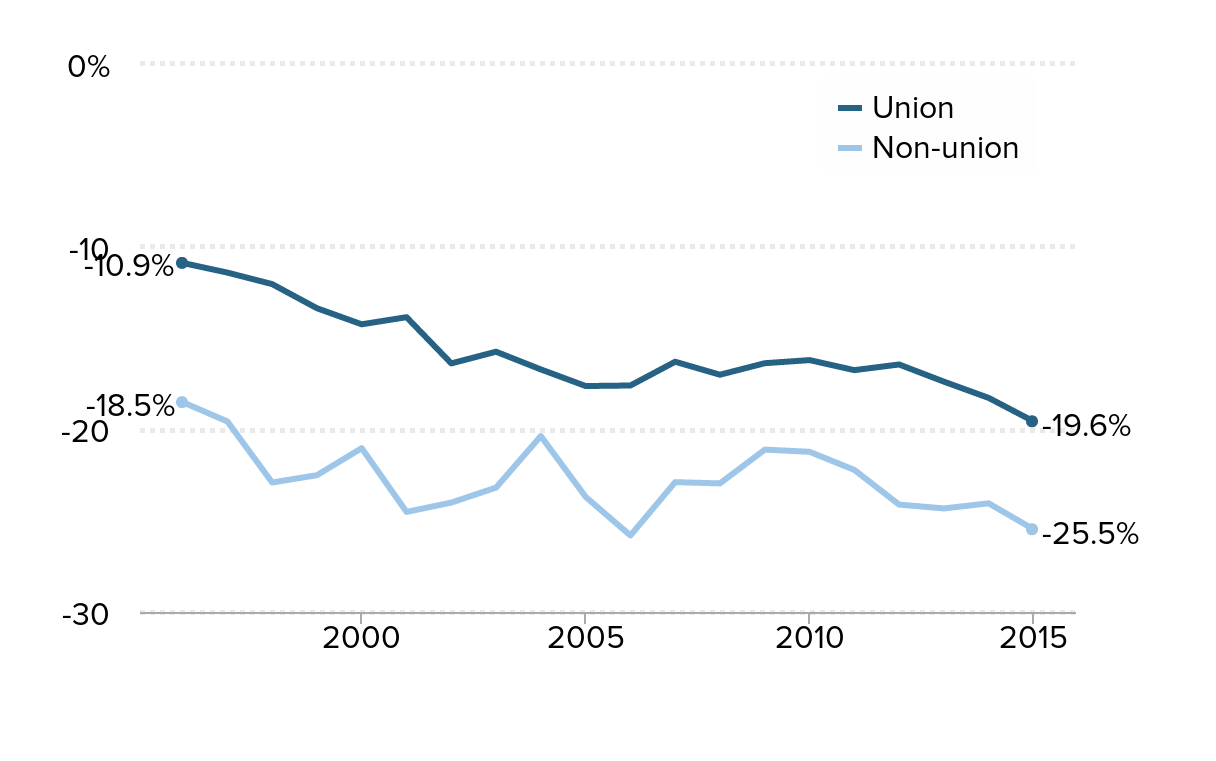
Teachers in a union have a smaller wage gap: Wage gap between public school teachers and similar workers, by union status, 1996–2015
| Year | Union | Non-union |
|---|---|---|
| 1996 | -10.89% | -18.51% |
| 1997 | -11.42% | -19.57% |
| 1998 | -12.05% | -22.91% |
| 1999 | -13.37% | -22.51% |
| 2000 | -14.25% | -21.03% |
| 2001 | -13.86% | -24.52% |
| 2002 | -16.39% | -24.01% |
| 2003 | -15.75% | -23.19% |
| 2004 | -16.72% | -20.37% |
| 2005 | -17.63% | -23.70% |
| 2006 | -17.60% | -25.81% |
| 2007 | -16.30% | -22.89% |
| 2008 | -17.01% | -22.96% |
| 2009 | -16.38% | -21.11% |
| 2010 | -16.21% | -21.23% |
| 2011 | -16.76% | -22.22% |
| 2012 | -16.45% | -24.12% |
| 2013 | -17.39% | -24.33% |
| 2014 | -18.28% | -24.05% |
| 2015 | -19.56% | -25.47% |
Source: Authors' analysis of Current Population Survey Outgoing Rotation Group data
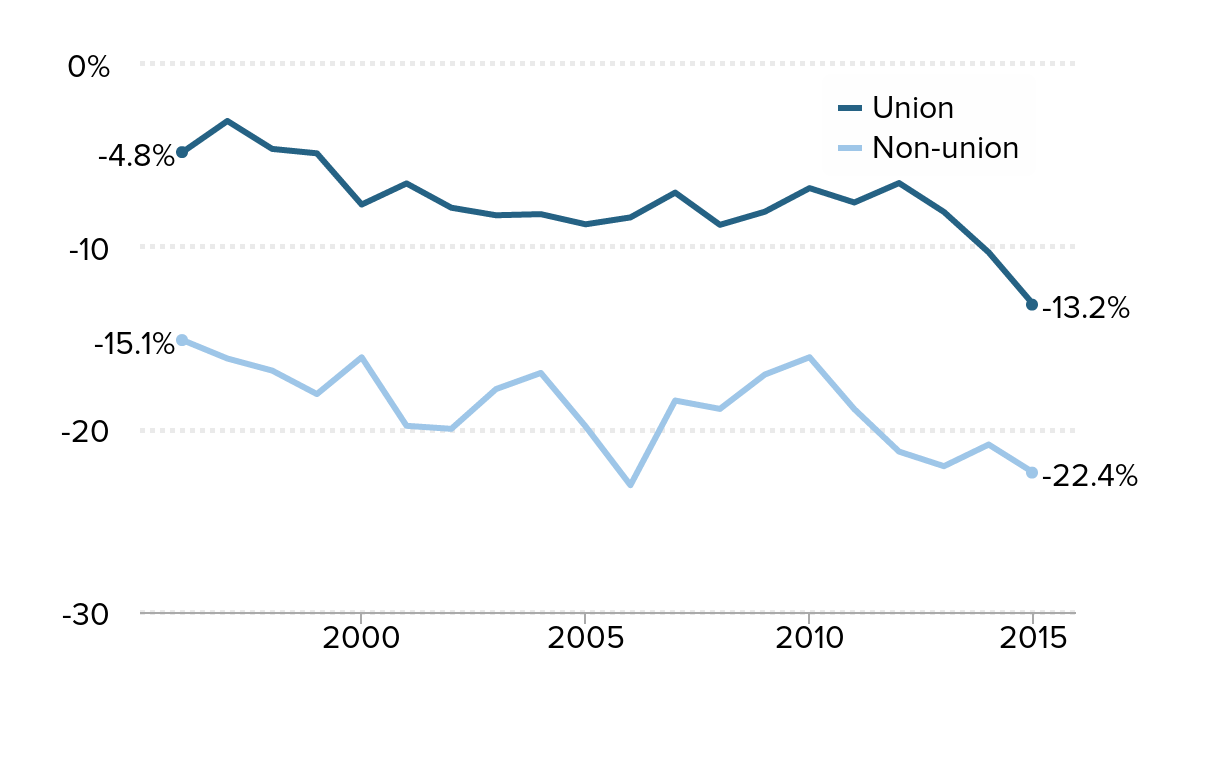
The wage gap is smaller for female teachers in a union: Wage gap between female public school teachers and similar female workers, by union status, 1996–2015
| Year | Union | Non-union |
|---|---|---|
| 1996 | -4.8239% | -15.1142% |
| 1997 | -3.1197% | -16.1238% |
| 1998 | -4.6490% | -16.7834% |
| 1999 | -4.8905% | -18.0698% |
| 2000 | -7.6943% | -16.0569% |
| 2001 | -6.5381% | -19.8071% |
| 2002 | -7.8680% | -19.9737% |
| 2003 | -8.2807% | -17.7961% |
| 2004 | -8.2197% | -16.9125% |
| 2005 | -8.7760% | -19.8453% |
| 2006 | -8.3984% | -23.0571% |
| 2007 | -7.0411% | -18.4240% |
| 2008 | -8.8047% | -18.8815% |
| 2009 | -8.0873% | -17.0013% |
| 2010 | -6.7949% | -16.0536% |
| 2011 | -7.5807% | -18.8937% |
| 2012 | -6.5180% | -21.2190% |
| 2013 | -8.0988% | -22.0175% |
| 2014 | -10.3119% | -20.8320% |
| 2015 | -13.1726% | -22.3684% |
Source: Authors' analysis of Current Population Survey Outgoing Rotation Group data
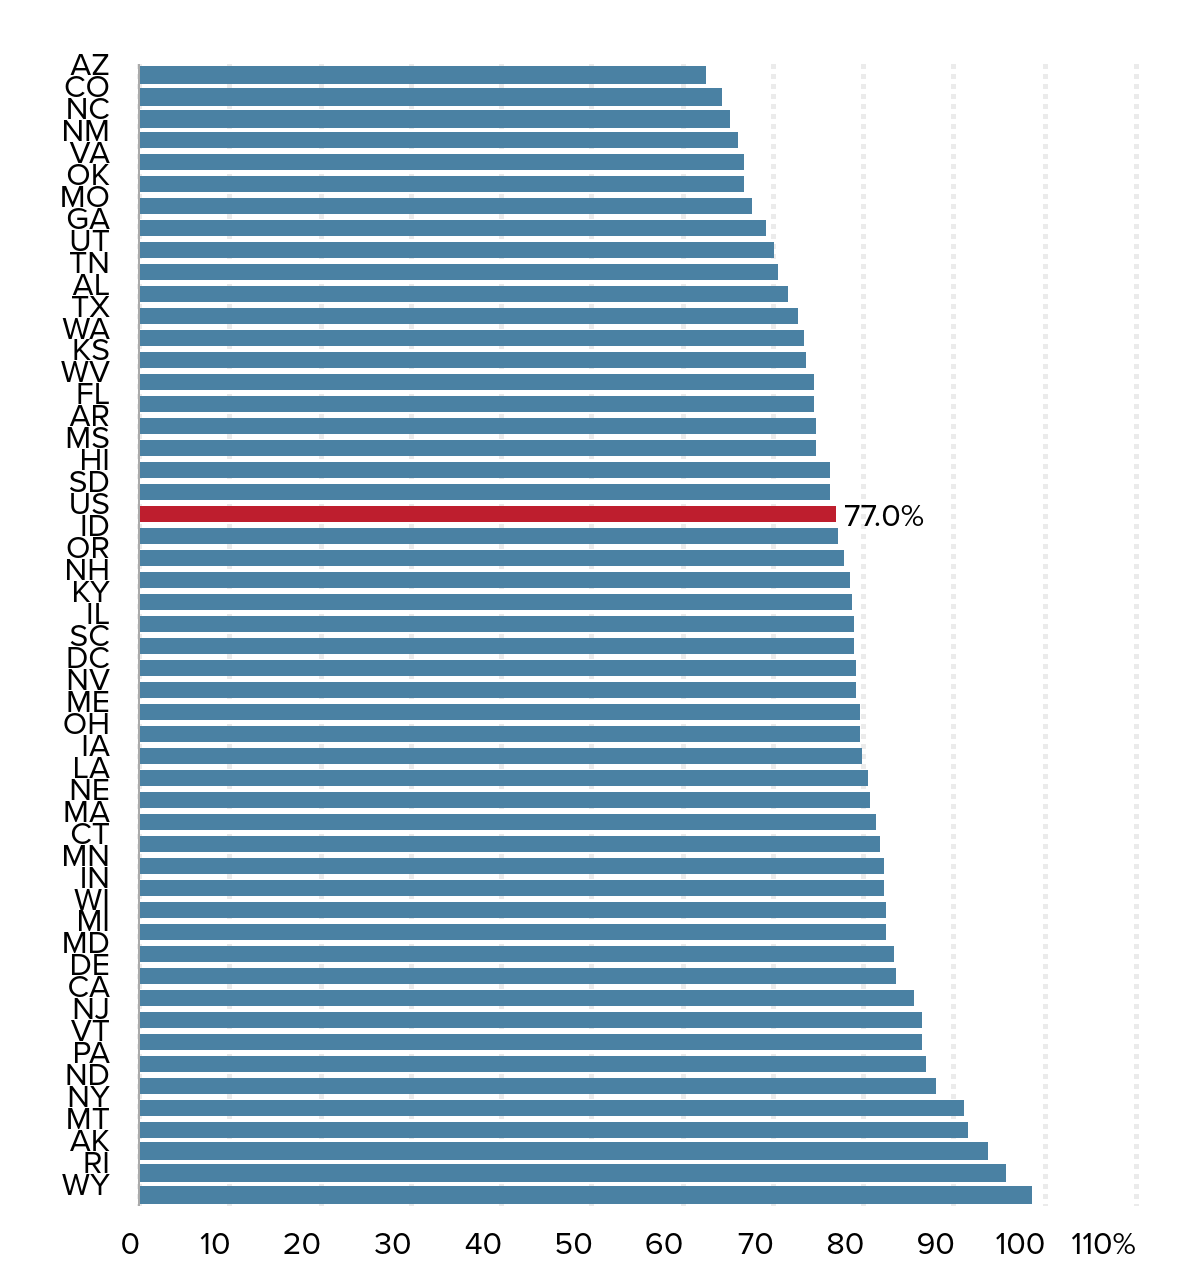
In no state are teachers paid more than other college graduates: Ratios of public school teacher wages to wages of other college graduates, by state
| State | Ratio |
|---|---|
| AZ | 62.8273% |
| CO | 64.5359% |
| NC | 65.3831% |
| NM | 66.1615% |
| VA | 66.8668% |
| OK | 66.9839% |
| MO | 67.8059% |
| GA | 69.2528% |
| UT | 70.3109% |
| TN | 70.6913% |
| AL | 71.7913% |
| TX | 72.8042% |
| WA | 73.5180% |
| KS | 73.8709% |
| WV | 74.6167% |
| FL | 74.6369% |
| AR | 74.8076% |
| MS | 74.8438% |
| HI | 76.3628% |
| SD | 76.3800% |
| US | 77.0171% |
| ID | 77.3277% |
| OR | 77.9107% |
| NH | 78.5277% |
| KY | 78.7610% |
| IL | 78.9697% |
| SC | 79.1601% |
| DC | 79.1998% |
| NV | 79.3665% |
| ME | 79.7165% |
| OH | 79.7357% |
| IA | 80.0012% |
| LA | 80.5429% |
| NE | 80.8519% |
| MA | 81.6090% |
| CT | 82.0540% |
| MN | 82.2927% |
| IN | 82.4501% |
| WI | 82.5462% |
| MI | 82.6941% |
| MD | 83.5838% |
| DE | 83.6782% |
| CA | 85.7933% |
| NJ | 86.5113% |
| VT | 86.5898% |
| PA | 87.0534% |
| ND | 88.1751% |
| NY | 91.2595% |
| MT | 91.6600% |
| AK | 93.8367% |
| RI | 95.7748% |
| WY | 98.6246% |
Source: EPI analysis of pooled 2011–2015 Current Population Survey Outgoing Rotation Group data
Wages and benefits of public school teachers versus other professionals, 2015
| Share of compensation (%) | ||
|---|---|---|
| Professionals | Teachers | |
| Wages | ||
| Direct wages | 69 | 68.8 |
| Paid leave | 7.4 | 4.4 |
| Supplemental pay | 2 | 0.3 |
| Total W-2 wages | 78.4 | 73.4 |
| Benefits | ||
| Insurance | 8.7 | 11.2 |
| Pension | 6.4 | 10.5 |
| Payroll taxes | 6.4 | 5 |
| Total non-wage benefits* | 21.6 | 26.6 |
| Total compensation | 100 | 100 |
| Memo: Pension and payroll taxes | 12.8 | 15.5 |
Source: Authors' analysis of Bureau of Labor Statistics Employer Costs for Employee Compensation data
Trends in the teacher compensation penalty, 1994–2015
| Compensation to W-2 wage ratio | Teacher wage penalty, benefit advantage, and compensation penalty | |||||
|---|---|---|---|---|---|---|
| Professionals | Teachers | Wage penalty | Benefit advantage* | Compensation penalty | ||
| 1994** | n.a. | n.a. | -1.8% | 1.7% | -0.1% | |
| 2004 | 1.23 | 1.26 | -11.4% | 1.8% | -9.6% | |
| 2007 | 1.24 | 1.29 | -13.0% | 3.3% | -9.7% | |
| 2012 | 1.26 | 1.34 | -14.1% | 5.1% | -9.0% | |
| 2015 | 1.28 | 1.36 | -17.0% | 5.9% | -11.1% | |
| Percentage-point change | ||||||
| 1994–2004 | n.a. | n.a. | -9.6 | 0.0 | -9.6 | |
| 2004–2007 | 1.0 | 3.1 | -1.6 | 1.5 | -0.1 | |
| 2007–2012 | 2.3 | 5.1 | -1.1 | 1.8 | 0.7 | |
| 2012–2015 | 1.2 | 2.5 | -2.9 | 0.8 | -2.1 | |
| 2004–2015 | 4.5 | 10.7 | -5.6 | 4.1 | -1.5 | |
| 1994–2015 | n.a. | n.a. | -15.2 | 4.2 | -11.0 | |
Source: Author’s analysis of Current Population Survey Outgoing Rotation Group data and Bureau of Labor Statistics Employer Costs for Employee Compensation data
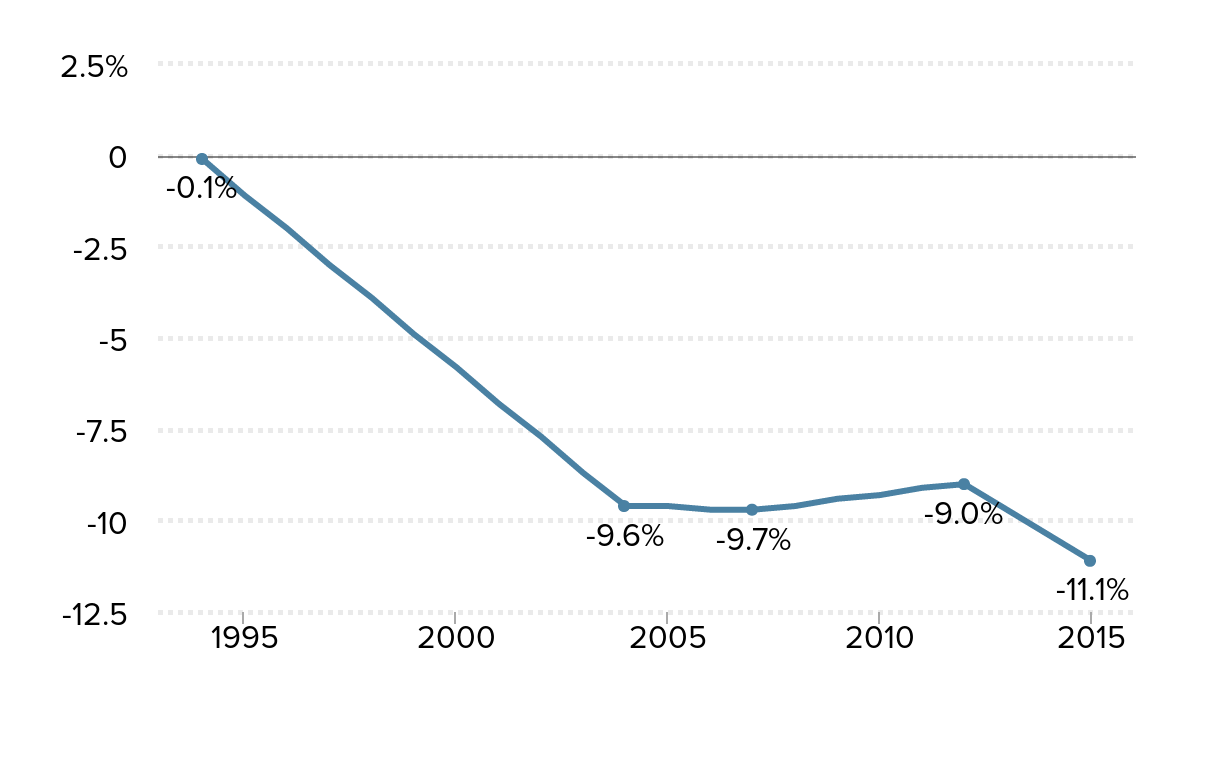
The teacher compensation penalty has grown to 11 percent: Compensation gap between public school teachers and similar workers, 1994–2015
| Year | Teacher compensation penalty |
|---|---|
| 1994 | -0.1% |
| 1995 | -1.1% |
| 1996 | -2.0% |
| 1997 | -3.0% |
| 1998 | -3.9% |
| 1999 | -4.9% |
| 2000 | -5.8% |
| 2001 | -6.8% |
| 2002 | -7.7% |
| 2003 | -8.7% |
| 2004 | -9.6% |
| 2005 | -9.6% |
| 2006 | -9.7% |
| 2007 | -9.7% |
| 2008 | -9.6% |
| 2009 | -9.4% |
| 2010 | -9.3% |
| 2011 | -9.1% |
| 2012 | -9.0% |
| 2013 | -9.7% |
| 2014 | -10.4% |
| 2015 | -11.1% |
Source: Authors' analysis of Current Population Survey Outgoing Rotation Group data and Bureau of Labor Statistics Employer Costs for Employee Compensation data
Thank you!
Full report: go.epi.org/teacherpay
Economic Policy Institute: epi.org