State of American Retirement
Monique Morrissey
Economic Policy Institute
401(k)s magnify inequality: Share of total retirement account savings and total income for families age 32–61 by income quintile, 2013
| Retirement account savings | Income | |
|---|---|---|
| 1st (Bottom) | 0% | 2% |
| 2nd (Lower-middle) | 1% | 5% |
| 3rd (Middle) | 5% | 10% |
| 4th (Upper-middle) | 20% | 19% |
| 5th (Top) | 74% | 63% |
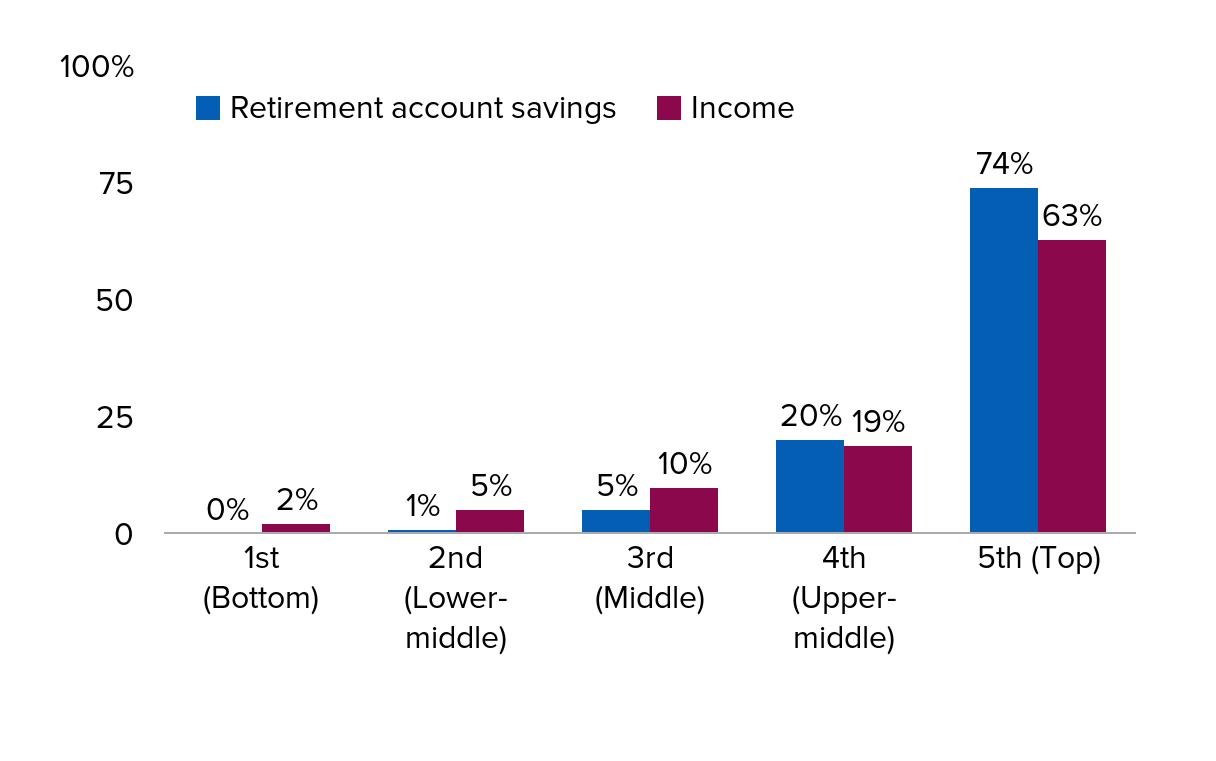
Note: Based on "normal income," which may differ from actual income if a family's income in the past year was unusually high or low. Retirement account savings include 401(k)s, IRAs, and Keogh plans.
Source: EPI analysis of Survey of Consumer Finance data, 2013.
High-income families are 10 times as likely to have retirement accounts as low-income families: Share of families age 32–61 with retirement account savings by income quintile, 1995–2013
| 1st (Bottom) | 2nd (Lower-middle) | 3rd (Middle) | 4th (Upper-middle) | 5th (Top) | |
|---|---|---|---|---|---|
| 1995 | 10% | 33% | 50% | 68% | 79% |
| 1998 | 15% | 38% | 57% | 69% | 83% |
| 2001 | 17% | 40% | 56% | 77% | 89% |
| 2004 | 9% | 37% | 53% | 74% | 84% |
| 2007 | 12% | 34% | 59% | 76% | 90% |
| 2010 | 12% | 36% | 53% | 68% | 86% |
| 2013 | 8% | 30% | 52% | 69% | 88% |
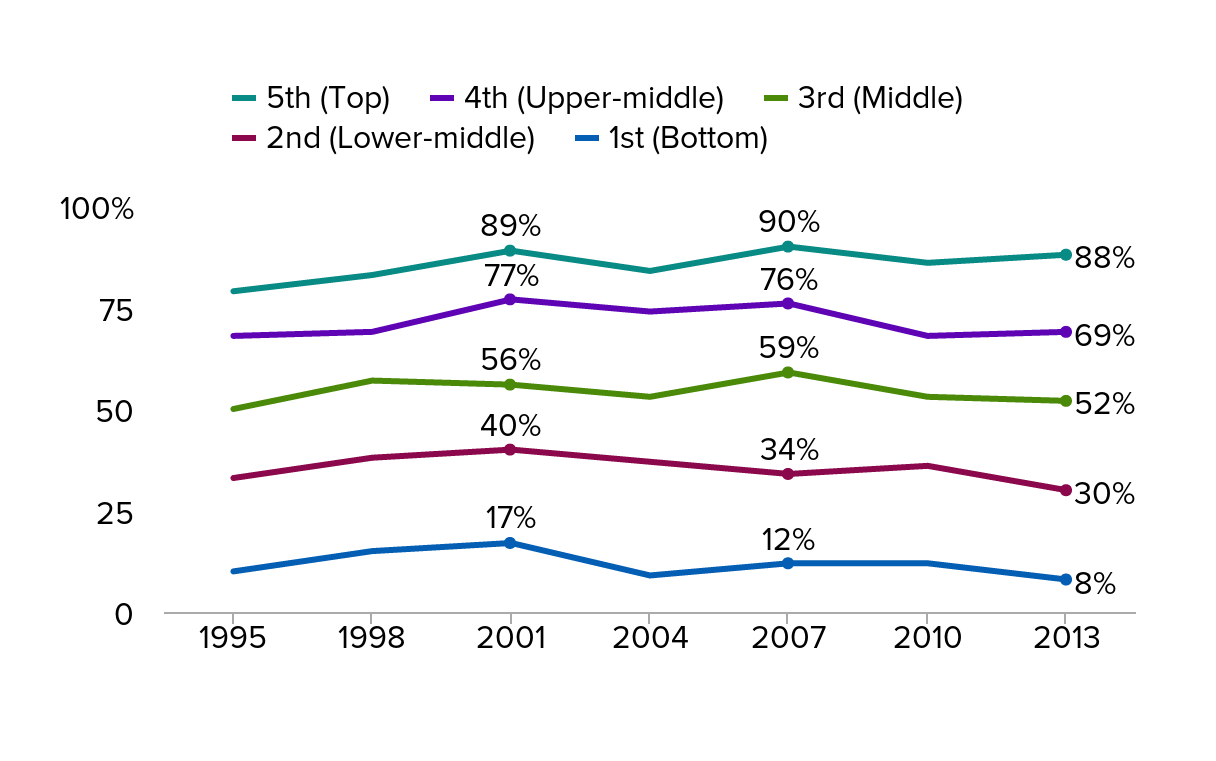
Note: Retirement account savings include 401(k)s, IRAs, and Keogh plans. Family-income quintiles are based on "normal income," a measure that ignores temporary fluctuations and is not available for years prior to 1995.
Source: EPI analysis of Survey of Consumer Finance data, 2013.
The gap between the retirement ‘haves’ and ‘have-nots’ has grown since the recession: Retirement account savings of families age 32–61 by savings percentile, 1989–2013 (2013 dollars)
| 50th (median) | 60th | 70th | 80th | 90th | |
|---|---|---|---|---|---|
| 1989 | $0 | $5,423 | $14,461 | $32,536 | $90,379 |
| 1992 | $0 | $4,874 | $16,248 | $39,384 | $90,987 |
| 1995 | $2,277 | $9,866 | $24,286 | $47,054 | $113,841 |
| 1998 | $6,004 | $17,440 | $38,597 | $73,763 | $160,106 |
| 2001 | $7,879 | $23,638 | $48,326 | $92,818 | $223,247 |
| 2004 | $6,166 | $19,730 | $49,326 | $102,351 | $246,628 |
| 2007 | $11,228 | $30,315 | $61,754 | $123,508 | $258,243 |
| 2010 | $5,358 | $19,291 | $42,868 | $96,453 | $246,490 |
| 2013 | $5,000 | $20,100 | $50,000 | $116,000 | $274,000 |
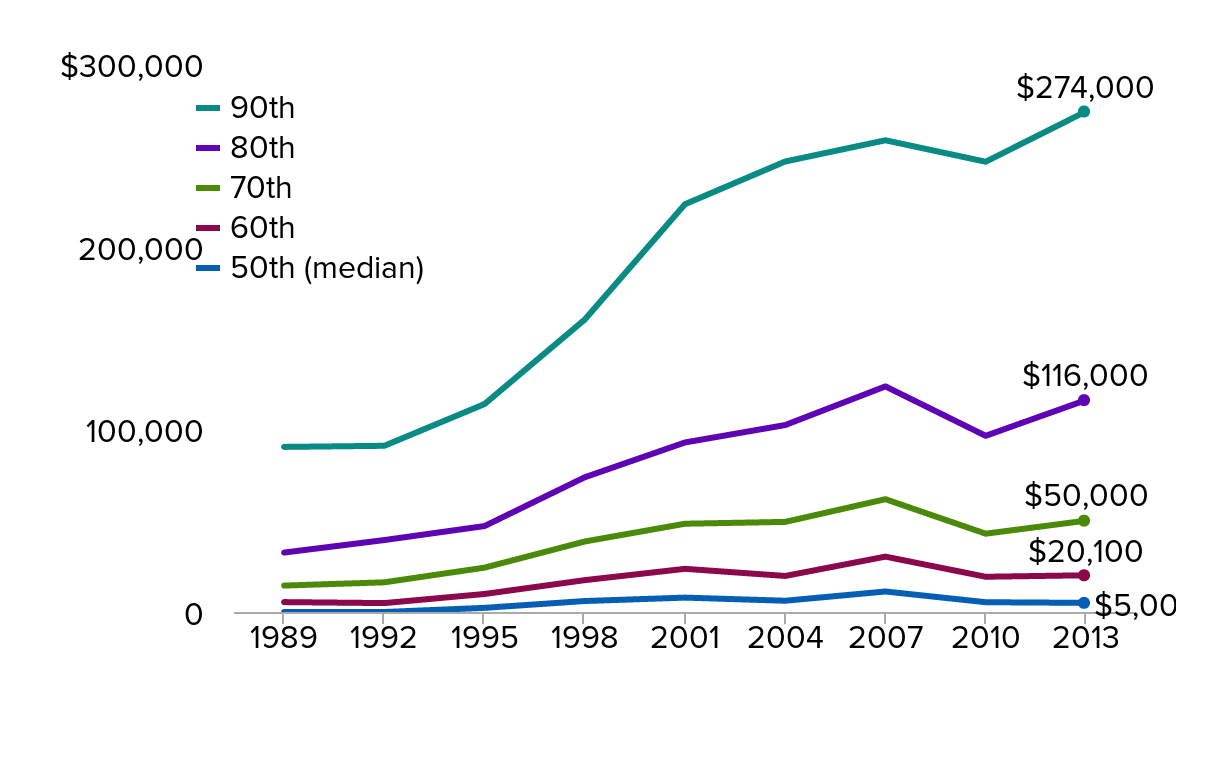
Note: Retirement account savings include 401(k)s, IRAs, and Keogh plans. Scale changed to accommodate larger values.
Source: EPI analysis of Survey of Consumer Finance data, 2013.
College-educated families are much more likely to have retirement savings: Share of families age 32–61 with retirement account savings by education, 1989–2013
| No high school diploma/GED | High school diploma/GED | Some college | College degree or more | |
|---|---|---|---|---|
| 1989 | 22% | 43% | 49% | 69% |
| 1992 | 18% | 42% | 50% | 67% |
| 1995 | 23% | 49% | 57% | 71% |
| 1998 | 30% | 52% | 62% | 74% |
| 2001 | 24% | 54% | 57% | 82% |
| 2004 | 19% | 51% | 57% | 75% |
| 2007 | 27% | 52% | 61% | 79% |
| 2010 | 18% | 46% | 57% | 75% |
| 2013 | 18% | 43% | 53% | 76% |
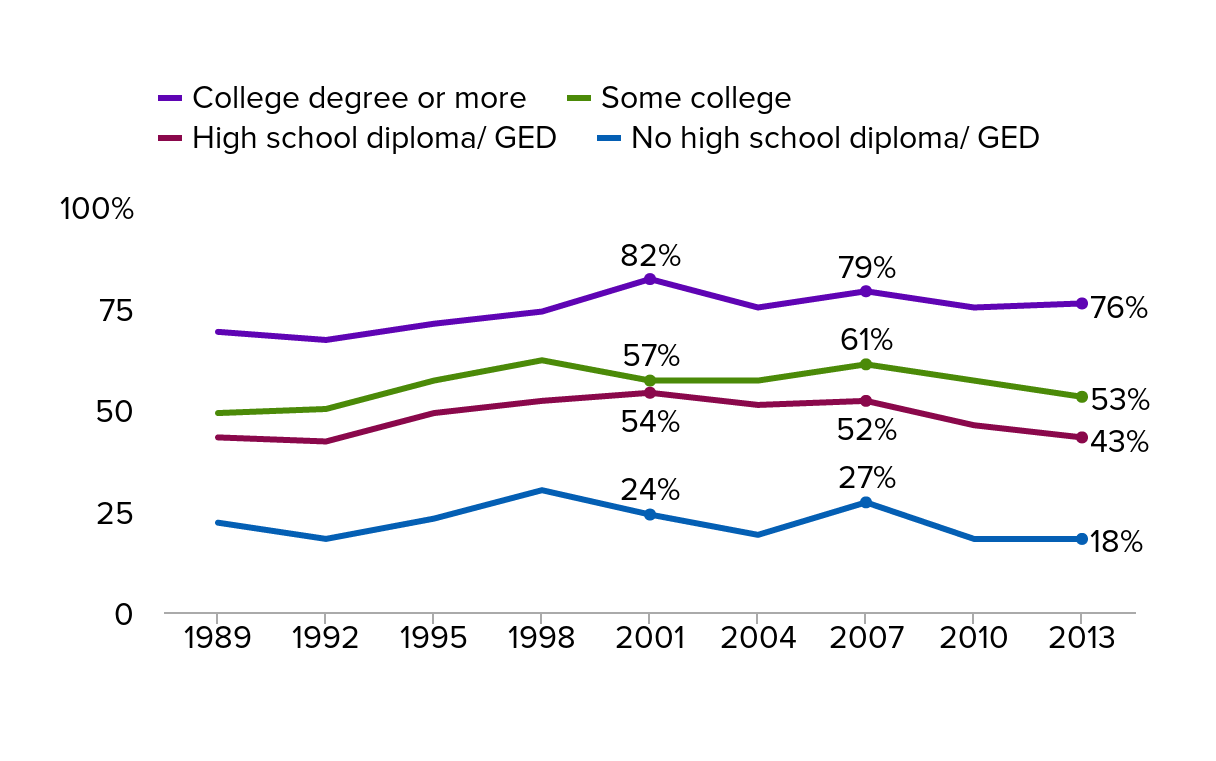
Note: Retirement account savings include 401(k)s, IRAs, and Keogh plans. "College degree" includes associate degrees.
Source: EPI analysis of Survey of Consumer Finance data, 2013.
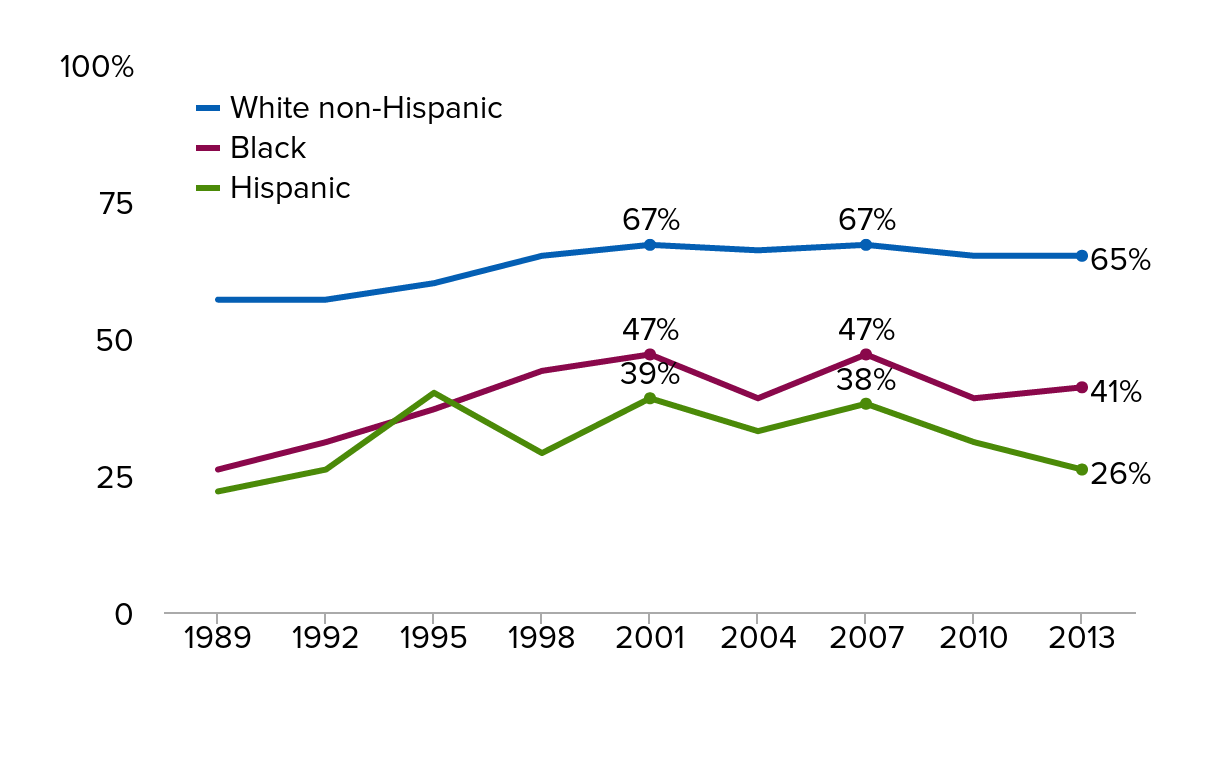
Most black and Hispanic families have no retirement account savings: Share of families age 32–61 with retirement account savings by race, 1989–2013
| White non-Hispanic | Black | Hispanic | |
|---|---|---|---|
| 1989 | 57% | 26% | 22% |
| 1992 | 57% | 31% | 26% |
| 1995 | 60% | 37% | 40% |
| 1998 | 65% | 44% | 29% |
| 2001 | 67% | 47% | 39% |
| 2004 | 66% | 39% | 33% |
| 2007 | 67% | 47% | 38% |
| 2010 | 65% | 39% | 31% |
| 2013 | 65% | 41% | 26% |
Note: Retirement account savings include 401(k)s, IRAs, and Keogh plans.
Source: EPI analysis of Survey of Consumer Finance data, 2013.
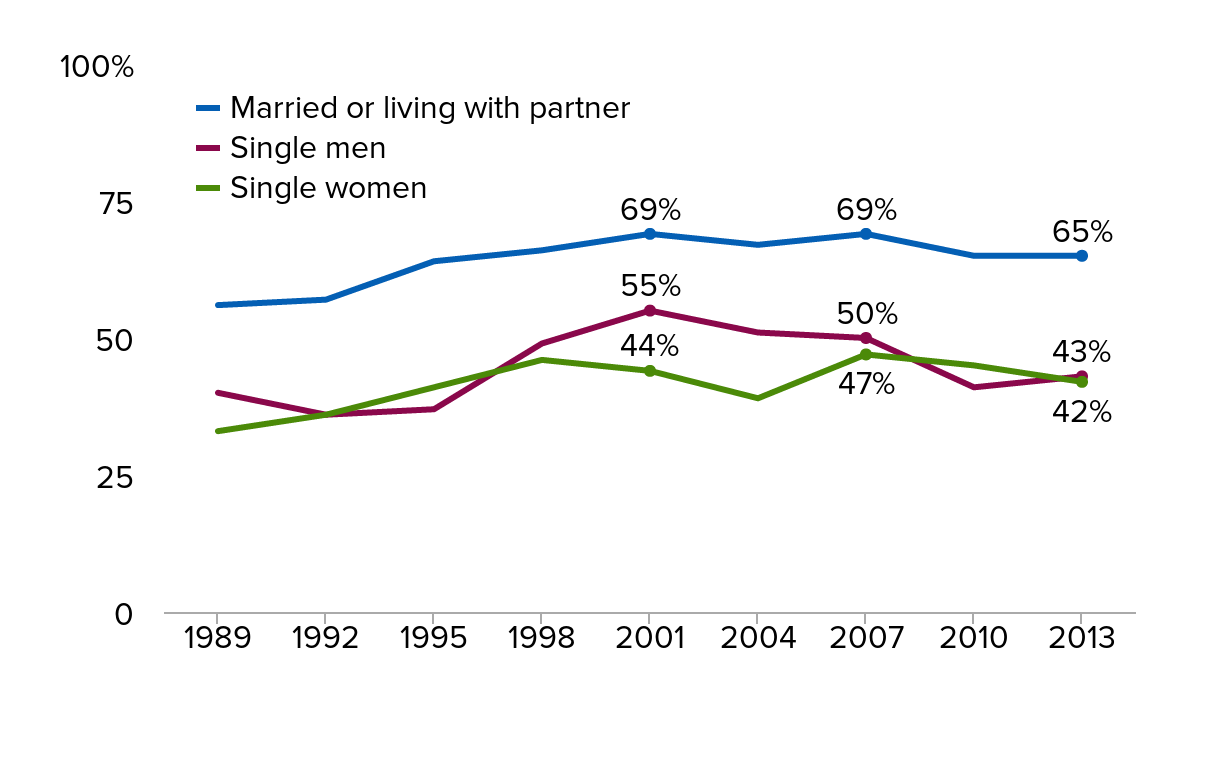
Single people are less likely to have retirement savings: Share of families age 32–61 with retirement account savings by gender and marital status, 1989–2013
| Married or living with partner | Single men | Single women | |
|---|---|---|---|
| 1989 | 56% | 40% | 33% |
| 1992 | 57% | 36% | 36% |
| 1995 | 64% | 37% | 41% |
| 1998 | 66% | 49% | 46% |
| 2001 | 69% | 55% | 44% |
| 2004 | 67% | 51% | 39% |
| 2007 | 69% | 50% | 47% |
| 2010 | 65% | 41% | 45% |
| 2013 | 65% | 43% | 42% |
Note: Retirement account savings include 401(k)s, IRAs, and Keogh plans.
Source: EPI analysis of Survey of Consumer Finance data, 2013.