Closing the Pay Gap
Women’s Rabbinic Network
Elise Gould
Senior Economist
Economic Policy Institute
Monday, April 4, 2016
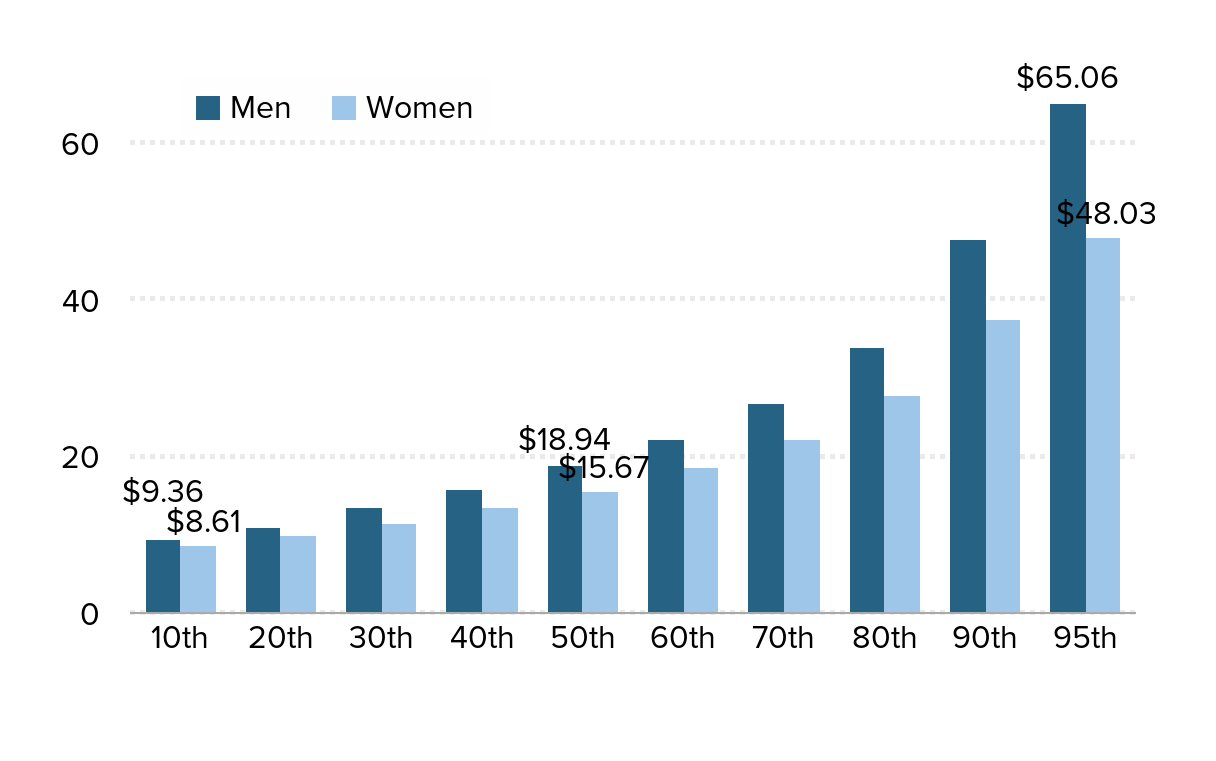
Women earn less than men at every wage level: Hourly wages by gender and wage percentile, 2015
| Men | Women | |
|---|---|---|
| 10th | $9.36 | $8.61 |
| 20th | $11.07 | $9.96 |
| 30th | $13.44 | $11.54 |
| 40th | $15.90 | $13.50 |
| 50th | $18.94 | $15.67 |
| 60th | $22.26 | $18.58 |
| 70th | $26.93 | $22.18 |
| 80th | $33.96 | $27.83 |
| 90th | $47.89 | $37.62 |
| 95th | $65.06 | $48.03 |

Source: EPI analysis of Current Population Survey Outgoing Rotation Group microdata. For more information on the data sample see EPI's State of Working America Data Library.
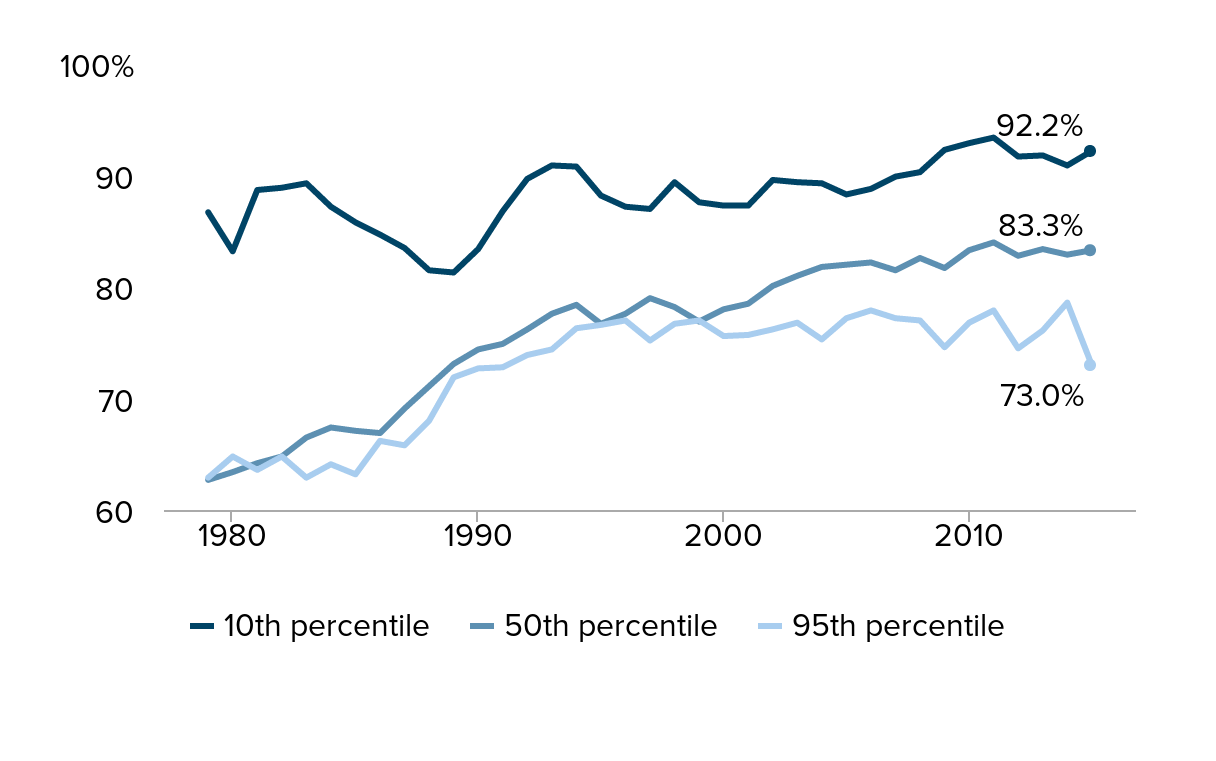
The gender wage gap is largest among top earners: Women’s hourly wages as a share of men’s at various wage percentiles, 1979–2015
| 10th percentile | 50th percentile | 95th percentile | |
|---|---|---|---|
| 1979-01-01 | 86.7% | 62.7% | 62.9% |
| 1980-01-01 | 83.2% | 63.4% | 64.8% |
| 1981-01-01 | 88.7% | 64.2% | 63.6% |
| 1982-01-01 | 88.9% | 64.8% | 64.8% |
| 1983-01-01 | 89.3% | 66.5% | 62.9% |
| 1984-01-01 | 87.2% | 67.4% | 64.1% |
| 1985-01-01 | 85.8% | 67.1% | 63.2% |
| 1986-01-01 | 84.7% | 66.9% | 66.2% |
| 1987-01-01 | 83.5% | 69.1% | 65.8% |
| 1988-01-01 | 81.5% | 71.1% | 68.0% |
| 1989-01-01 | 81.3% | 73.1% | 71.9% |
| 1990-01-01 | 83.4% | 74.4% | 72.7% |
| 1991-01-01 | 86.8% | 74.9% | 72.8% |
| 1992-01-01 | 89.7% | 76.2% | 73.9% |
| 1993-01-01 | 90.9% | 77.6% | 74.4% |
| 1994-01-01 | 90.8% | 78.4% | 76.3% |
| 1995-01-01 | 88.2% | 76.7% | 76.6% |
| 1996-01-01 | 87.2% | 77.6% | 77.0% |
| 1997-01-01 | 87.0% | 79.0% | 75.2% |
| 1998-01-01 | 89.4% | 78.2% | 76.7% |
| 1999-01-01 | 87.6% | 76.9% | 77.0% |
| 2000-01-01 | 87.3% | 78.0% | 75.6% |
| 2001-01-01 | 87.3% | 78.5% | 75.7% |
| 2002-01-01 | 89.6% | 80.1% | 76.2% |
| 2003-01-01 | 89.4% | 81.0% | 76.8% |
| 2004-01-01 | 89.3% | 81.8% | 75.3% |
| 2005-01-01 | 88.3% | 82.0% | 77.2% |
| 2006-01-01 | 88.8% | 82.2% | 77.9% |
| 2007-01-01 | 89.9% | 81.5% | 77.2% |
| 2008-01-01 | 90.3% | 82.6% | 77.0% |
| 2009-01-01 | 92.3% | 81.7% | 74.6% |
| 2010-01-01 | 92.9% | 83.3% | 76.8% |
| 2011-01-01 | 93.4% | 84.0% | 77.9% |
| 2012-01-01 | 91.7% | 82.8% | 74.5% |
| 2013-01-01 | 91.8% | 83.4% | 76.1% |
| 2014-01-01 | 90.9% | 82.9% | 78.6% |
| 2015-01-01 | 92.2% | 83.3% | 73.0% |

Note: The xth-percentile wage is the wage at which x% of wage earners earn less and (100-x)% earn more.
Source: EPI analysis of Current Population Survey Outgoing Rotation Group microdata
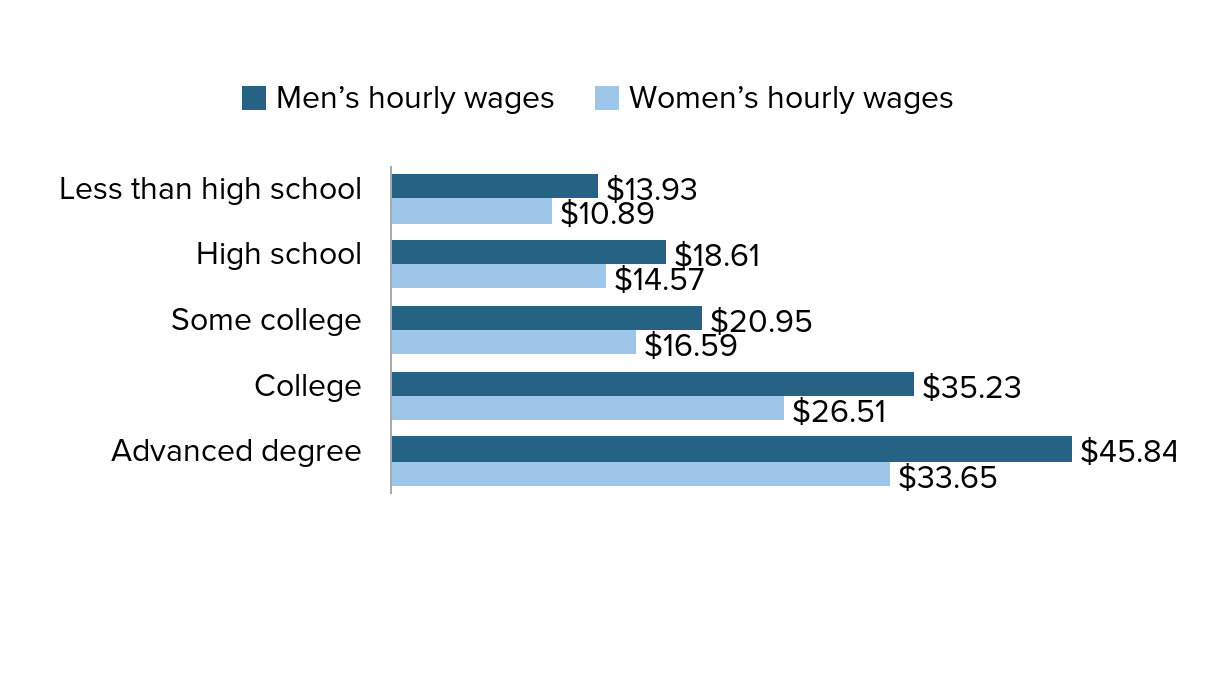
Women earn less than men at every education level: Average hourly wages, by gender and education, 2015
| Education level | Men’s hourly wages | Women’s hourly wages |
|---|---|---|
| Less than high school | $13.93 | $10.89 |
| High school | $18.61 | $14.57 |
| Some college | $20.95 | $16.59 |
| College | $35.23 | $26.51 |
| Advanced degree | $45.84 | $33.65 |

Source: EPI analysis of Current Population Survey Outgoing Rotation Group microdata
How does the gender pay gap change after a woman has children?
-
Lower pay
-
Less labor market experience
-
Fewer hours
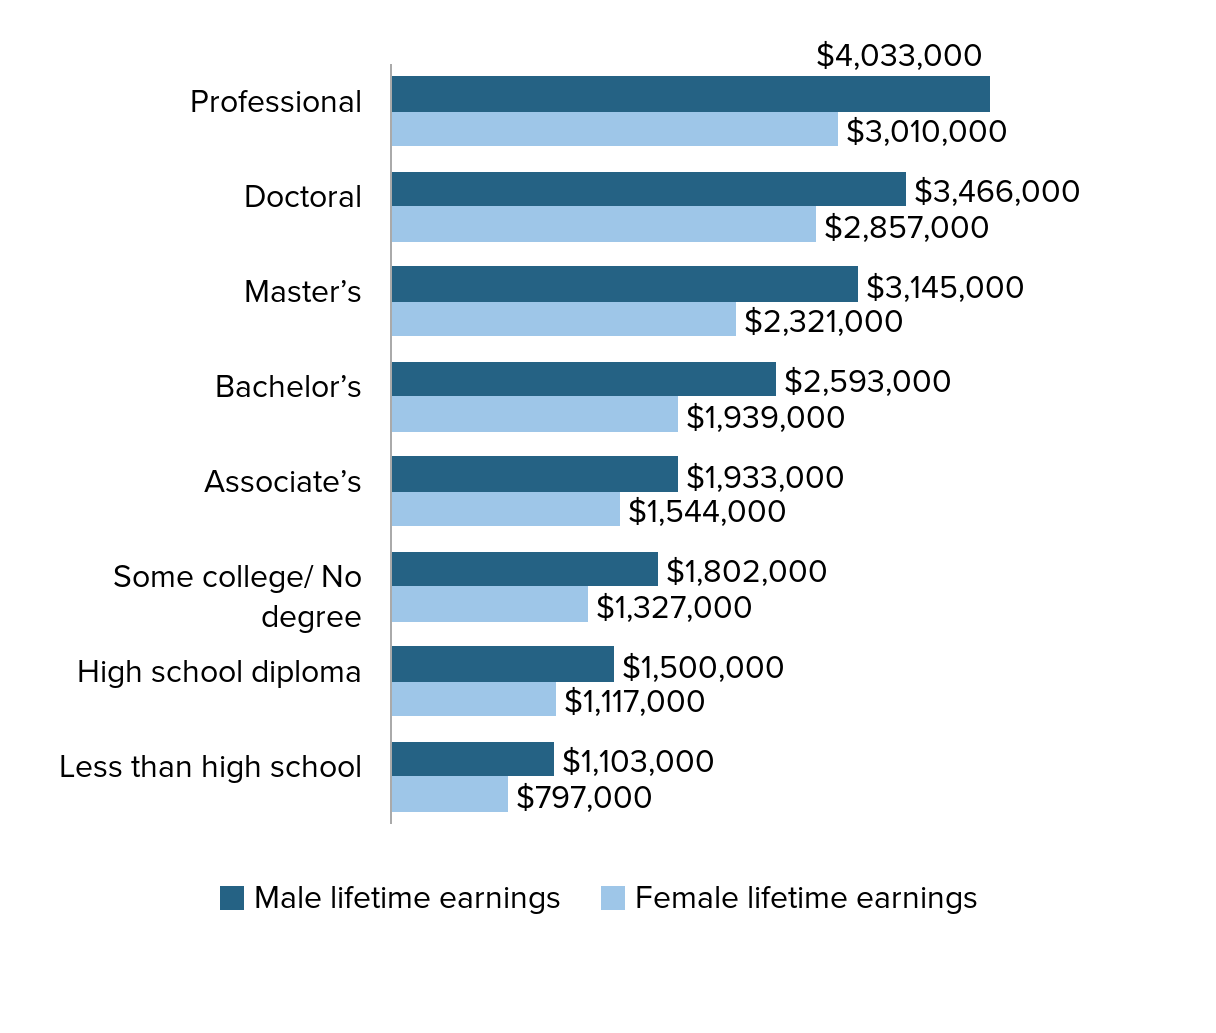
Women have to have a PhD to make as much as men with a bachelor's degree: Male and female lifetime earnings by educational attainment
| Degree | Male lifetime earnings | Female lifetime earnings |
|---|---|---|
| Professional | $4,033,000 | $3,010,000 |
| Doctoral | $3,466,000 | $2,857,000 |
| Master’s | $3,145,000 | $2,321,000 |
| Bachelor’s | $2,593,000 | $1,939,000 |
| Associate’s | $1,933,000 | $1,544,000 |
| Some college/ No degree | $1,802,000 | $1,327,000 |
| High school diploma | $1,500,000 | $1,117,000 |
| Less than high school | $1,103,000 | $797,000 |

Source: Adapted from Figure 5 in The Georgetown University Center for Education and the Workforce, The College Payoff: Education, Occupations, Lifetime Earnings, 2011, https://cew.georgetown.edu/report/the-college-payoff/
Ways to help eliminate the gender wage gap include:
- Require more transparency in compensation data
- Strongly enforce anti-discrimination laws
- Pass comparable-worth laws that ensure women are paid the same as men in equally valuable jobs, or with similar education or skills levels
- Change the culture of work to emphasize work-life balance
- Deter the segregation of genders into specific occupations
- Address the distribution of unpaid car work in the household by making it easier and more affordable for both men and women to spend more time at home, such as through the provision of paid family leave
