The gender pay gap is real:
A 360 degree look at what it is and why it matters
Economic Policy Institute
Friday, November 4, 2016
Different measures don’t mean the data are unreliable.
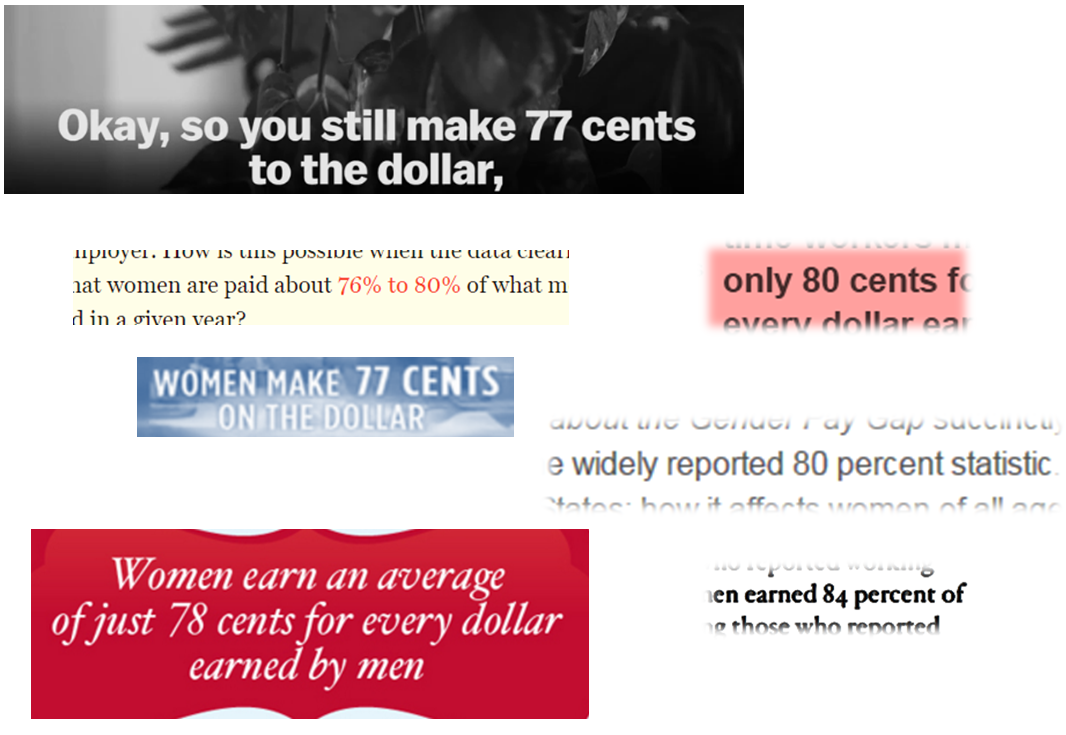
Adjusted measures can’t gauge the full effects of discrimination.

No matter how you slice it, there is a gender wage gap.
Progress in closing the gender pay gap has largely stalled: Women's hourly wages as a share of men's at the median, 1979–2015
| Year | Women’s hourly earnings at the median as a share of men’s hourly earnings at the median | Men |
|---|---|---|
| 1979 | 62.39% | 100 |
| 1980 | 63.06% | 100 |
| 1981 | 64.18% | 100 |
| 1982 | 65.32% | |
| 1983 | 66.52% | |
| 1984 | 67.54% | |
| 1985 | 68.00% | |
| 1986 | 67.33% | |
| 1987 | 69.08% | |
| 1988 | 70.95% | |
| 1989 | 73.82% | |
| 1990 | 75.15% | |
| 1991 | 75.78% | |
| 1992 | 76.38% | |
| 1993 | 78.43% | |
| 1994 | 79.10% | |
| 1995 | 77.35% | |
| 1996 | 77.34% | |
| 1997 | 79.24% | |
| 1998 | 77.96% | |
| 1999 | 77.13% | |
| 2000 | 78.29% | |
| 2001 | 78.79% | |
| 2002 | 80.05% | |
| 2003 | 80.64% | |
| 2004 | 81.81% | |
| 2005 | 82.49% | |
| 2006 | 82.39% | |
| 2007 | 81.75% | |
| 2008 | 83.17% | |
| 2009 | 81.30% | |
| 2010 | 83.43% | |
| 2011 | 84.62% | |
| 2012 | 83.03% | |
| 2013 | 83.36% | |
| 2014 | 82.24% | |
| 2015 | 82.74% | 100 |
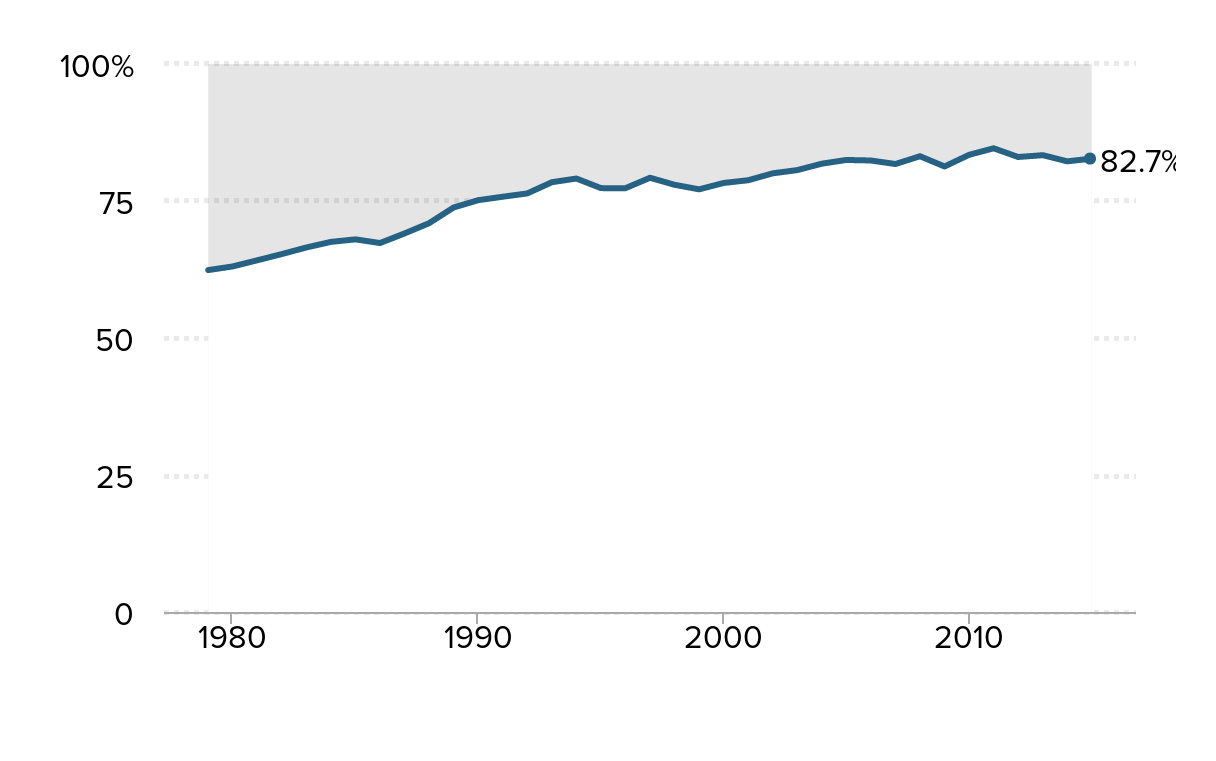
Source: EPI analysis of Current Population Survey microdata. For more information on the data sample see EPI's State of Working America Data Library.
The gender wage gap is still widest among top earners: Women's hourly wages as a share of men's at various wage percentiles, 1979 and 2015
| 2015 | 1979 | |||
|---|---|---|---|---|
| 10th percentile | 92.0% | 8.0 | 86.9% | 12.1 |
| 50th percentile | 82.7% | 17.3 | 62.4% | 37.6 |
| 95th percentile | 73.8% | 26.2 | 63.0% | 37.0 |
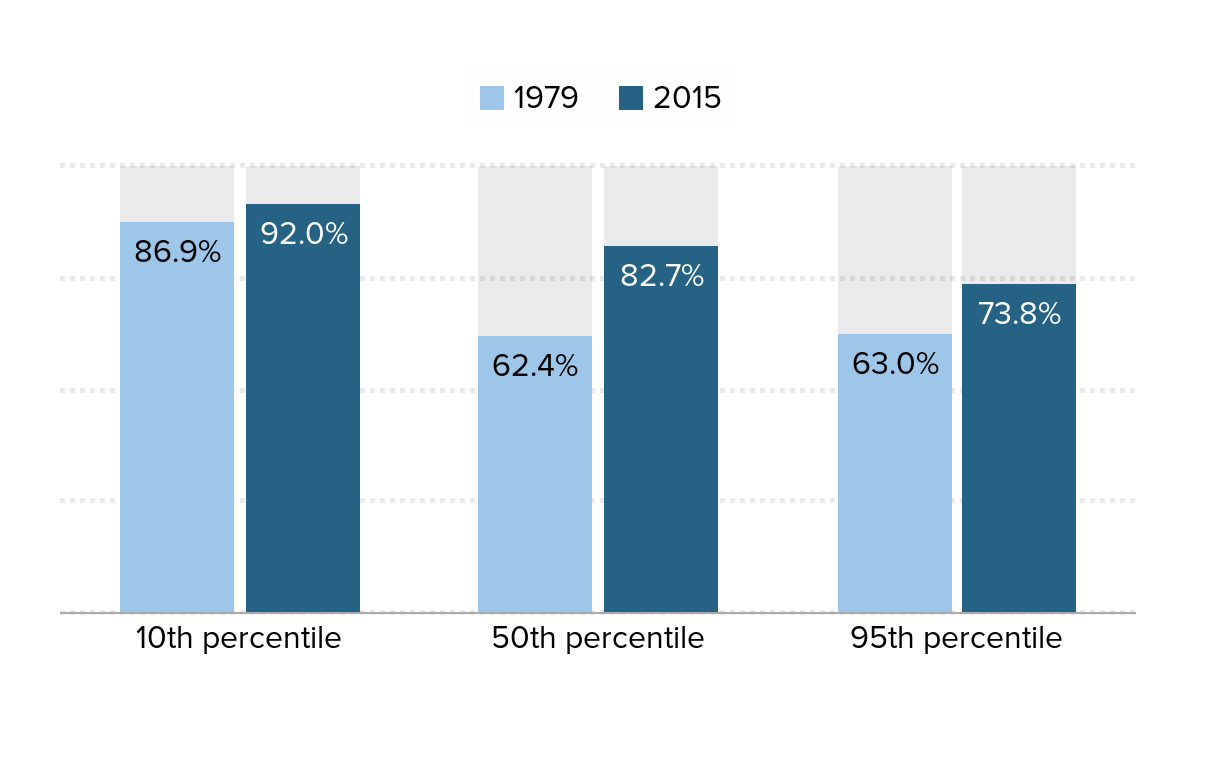
Notes: The xth-percentile wage is the wage at which x% of wage earners earn less and (100-x)% earn more.
Source: EPI analysis of Current Population Survey Outgoing Rotation group microdata
Black and Hispanic women experience the biggest pay gaps: Women's median hourly wages as a share of white men's and their per hour wage penalties, by race and ethnicity, 2015
| Gender Wage Gap as Compared to White Men | Median | Gap |
|---|---|---|
| White women | 81.00% | 19.00% |
| Black women | 65.26% | 34.74% |
| Hispanic women | 57.64% | 42.36% |
| Asian women | 89.79% | 10.21% |
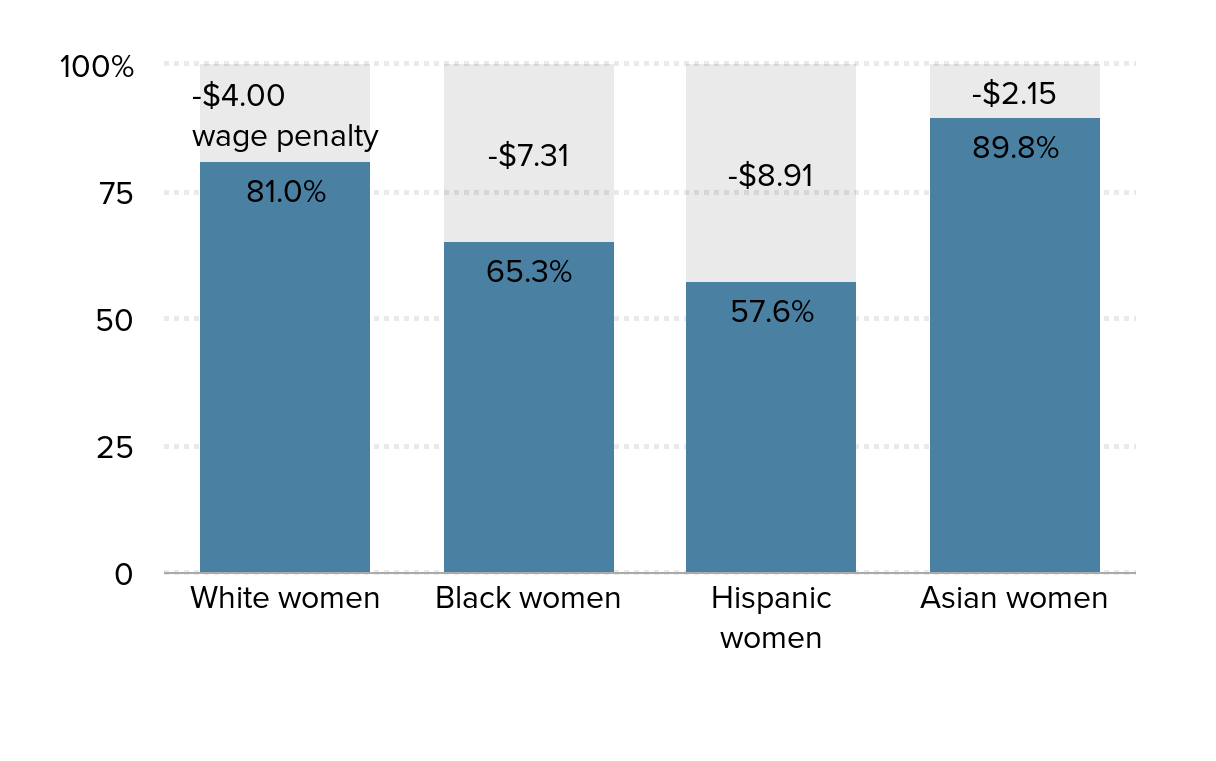
Notes: Values displayed above columns represent the difference between women's median hourly wages and median hourly wages of white men.
Source: EPI analysis of Current Population Survey microdata, 2015
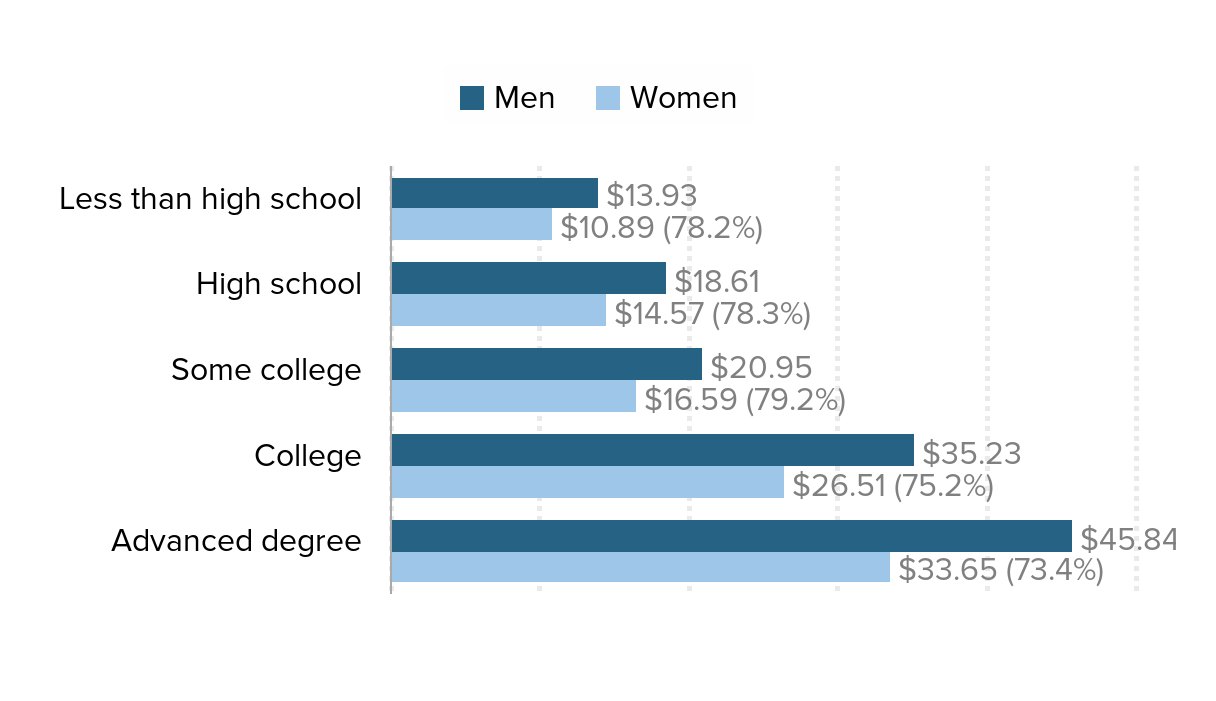
Women earn less than men at every education level: Average hourly wages, by gender and education, 2015
| Education level | Men | Women |
|---|---|---|
| Less than high school | $13.93 | $10.89 |
| High school | $18.61 | $14.57 |
| Some college | $20.95 | $16.59 |
| College | $35.23 | $26.51 |
| Advanced degree | $45.84 | $33.65 |
Source: EPI analysis of Current Population Survey Outgoing Rotation Group microdata. For more information on the data sample see EPI's State of Working America Data Library.
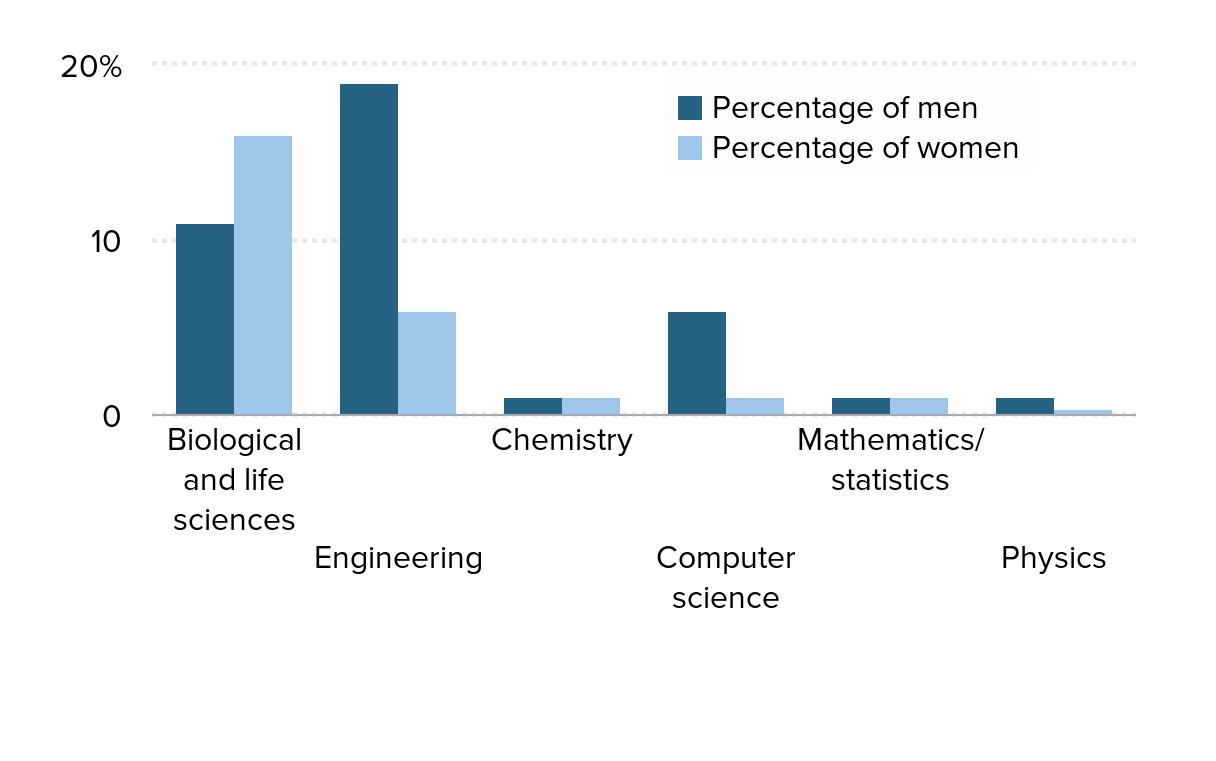
Women arrive at college less interested in STEM fields as compared with their male counterparts: Intent of first-year college students to major in select STEM fields, by gender, 2014
| Intended major | Percentage of men | Percentage of women |
|---|---|---|
| Biological and life sciences | 11% | 16% |
| Engineering | 19% | 6% |
| Chemistry | 1% | 1% |
| Computer science | 6% | 1% |
| Mathematics/ statistics | 1% | 1% |
| Physics | 1% | 0.3% |
Source: EPI adaptation of Corbett and Hill (2015) analysis of Eagan et al. (2014)
Undergraduate majors favored by women pay less 10 years after graduation: Undergraduate major by gender and salary 10 years after graduation
| Salary 10 years after graduation (2015 $’s) | Percent female | |
|---|---|---|
| Engineering | $90,196 | 13.8% |
| History | $60,560 | 38.9% |
| Math and science | $72,930 | 40.2% |
| Business and management | $70,868 | 46.2% |
| Biological sciences | $60,560 | 47.9% |
| Social science | $64,425 | 50.6% |
| Other | $59,014 | 57.2% |
| Humanities | $52,829 | 59.2% |
| Public affairs/social services | $52,829 | 59.4% |
| Psychology | $51,540 | 73.6% |
| Health professions | $68,291 | 74.7% |
| Education | $47,417 | 78.7% |
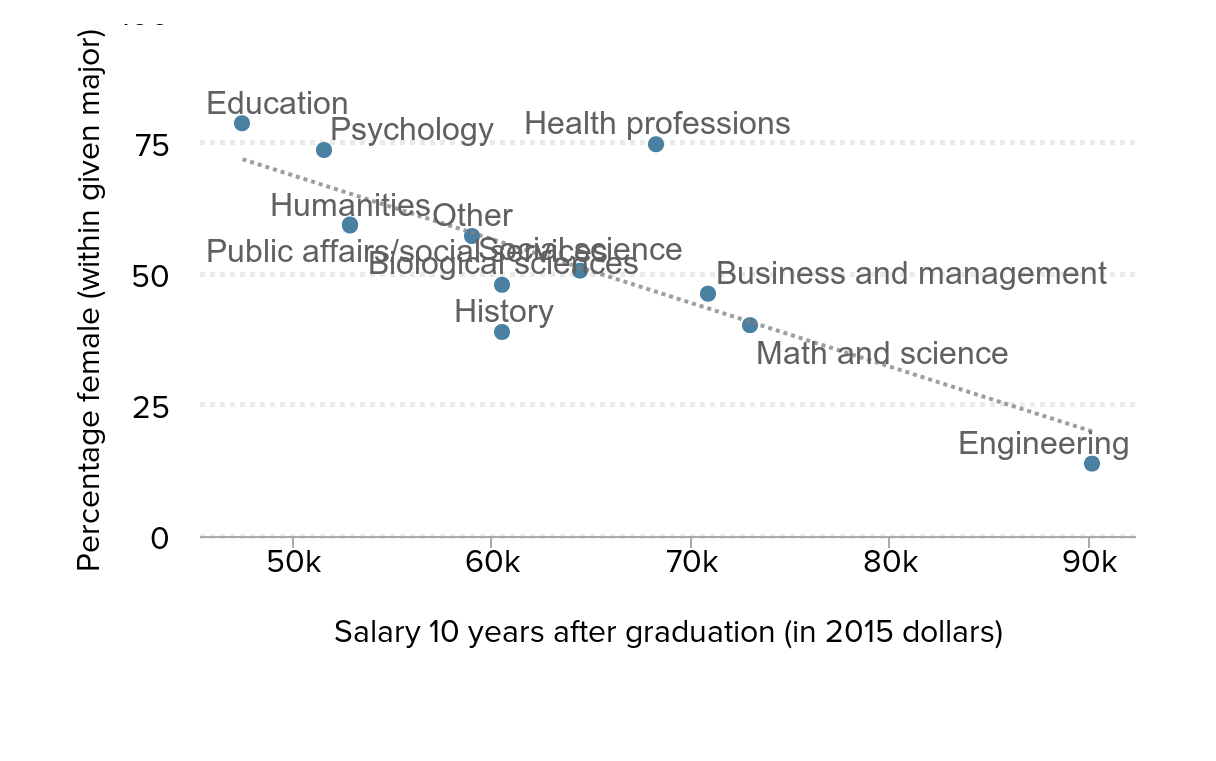
Notes: Salaries are based on the current or most recent salary of college graduates of the class of 1993 10 years after graduation in 2003. The salaries are then inflated to 2015 dollars using the CPI-U for easier comparison with today's wages. The percentage of graduates who are female by major is based on a survey of college students graduating in 1993 for consistency.
Source: U.S. Department of Education, National Center for Education Statistics, B&B: 93/03 Baccalaureate and Beyond Longitudinal Study
Women's hourly wages plateau and then begin to decline earlier than men's: Median hourly wage gap by age and gender, 2015
| Age | Men | Women |
|---|---|---|
| 16-24 | $10.09 | $9.85 |
| 25-34 | $16.78 | $15.39 |
| 35-44 | $21.72 | $18.04 |
| 45-54 | $22.98 | $18.03 |
| 55-64 | $22.97 | $17.63 |
| 65+ | $19.44 | $14.95 |
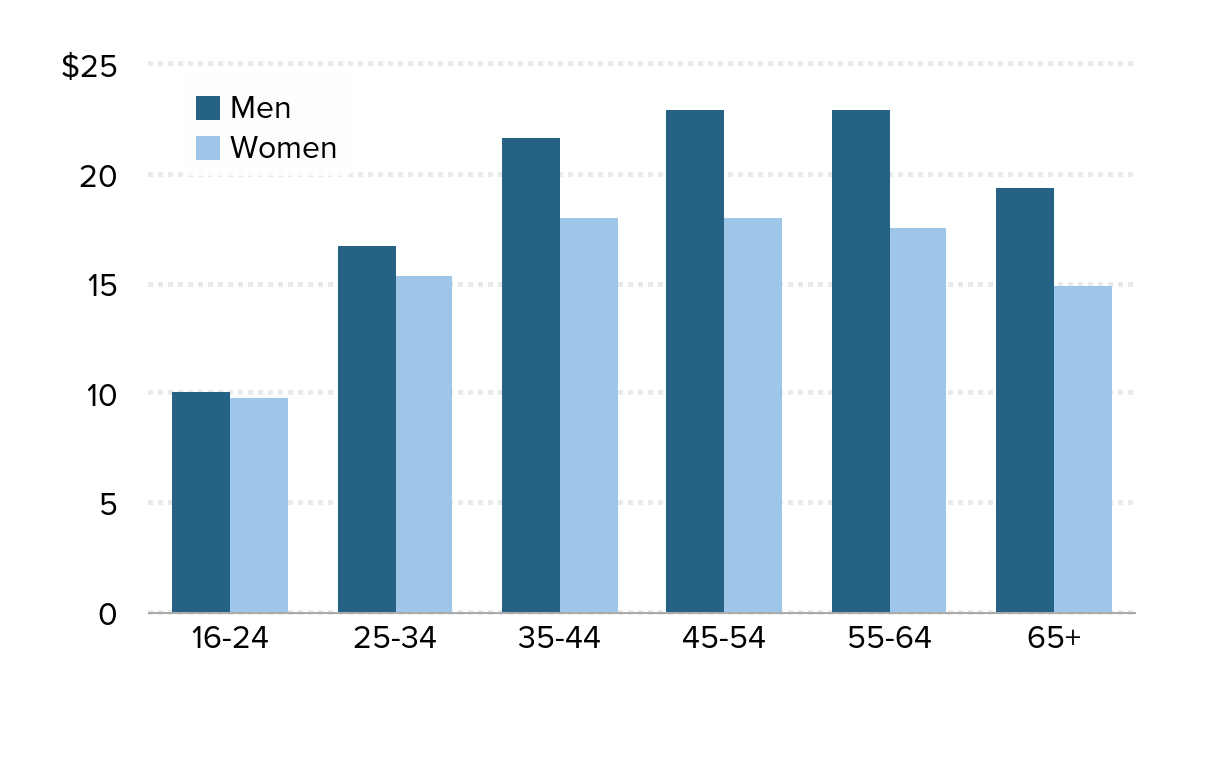
Source: EPI analysis of Current Population Survey microdata
The share of prime-age women with a job has fared worse in the U.S. than in peer countries: Employment-to-population ratio of women workers age 25–54, select countries, 1979–2014
| Year | Canada | Germany | Japan | Sweden | United States |
|---|---|---|---|---|---|
| 1979 | 53.7% | 53.3% | 55.2% | 79.8% | 59.0% |
| 1980 | 55.9% | 54.5% | 55.5% | 81.5% | 60.1% |
| 1981 | 58.1% | 54.9% | 56.0% | 83.2% | 61.2% |
| 1982 | 57.7% | 54.5% | 57.0% | 83.7% | 61.2% |
| 1983 | 58.7% | 53.7% | 58.1% | 84.9% | 62.0% |
| 1984 | 60.0% | 53.8% | 58.4% | 86.2% | 63.9% |
| 1985 | 62.0% | 54.8% | 58.9% | 87.2% | 65.3% |
| 1986 | 63.9% | 55.4% | 59.2% | 88.2% | 66.6% |
| 1987 | 65.4% | 55.6% | 59.8% | 88.5% | 68.2% |
| 1988 | 67.5% | 56.4% | 60.6% | 89.2% | 69.3% |
| 1989 | 68.9% | 57.7% | 61.9% | 89.4% | 70.4% |
| 1990 | 69.8% | 59.6% | 62.9% | 89.6% | 70.6% |
| 1991 | 69.0% | 67.0% | 63.7% | 88.2% | 70.1% |
| 1992 | 68.3% | 66.0% | 64.0% | 85.7% | 70.1% |
| 1993 | 68.1% | 65.5% | 63.6% | 82.6% | 70.4% |
| 1994 | 68.6% | 65.3% | 63.4% | 81.1% | 71.5% |
| 1995 | 69.4% | 66.4% | 63.2% | 81.1% | 72.2% |
| 1996 | 69.6% | 67.2% | 63.7% | 80.1% | 72.8% |
| 1997 | 71.0% | 67.4% | 64.6% | 78.7% | 73.5% |
| 1998 | 72.2% | 68.9% | 64.0% | 79.1% | 73.6% |
| 1999 | 73.2% | 70.3% | 63.6% | 80.5% | 74.1% |
| 2000 | 73.9% | 71.2% | 63.6% | 81.7% | 74.2% |
| 2001 | 74.3% | 71.6% | 64.1% | 82.4% | 73.4% |
| 2002 | 75.3% | 71.8% | 63.9% | 82.4% | 72.3% |
| 2003 | 76.0% | 72.0% | 64.4% | 81.7% | 72.0% |
| 2004 | 76.7% | 72.1% | 65.0% | 80.8% | 71.8% |
| 2005 | 76.5% | 71.0% | 65.7% | 81.1% | 72.0% |
| 2006 | 77.0% | 72.6% | 66.6% | 81.5% | 72.5% |
| 2007 | 78.2% | 74.0% | 67.4% | 83.0% | 72.5% |
| 2008 | 78.0% | 74.7% | 67.5% | 83.5% | 72.3% |
| 2009 | 77.1% | 75.4% | 67.6% | 81.9% | 70.2% |
| 2010 | 77.1% | 76.3% | 68.2% | 80.9% | 69.3% |
| 2011 | 77.2% | 77.9% | 68.5% | 82.2% | 69.0% |
| 2012 | 77.7% | 78.2% | 69.2% | 82.5% | 69.2% |
| 2013 | 78.1% | 78.6% | 70.8% | 82.7% | 69.3% |
| 2014 | 77.4% | 78.8% | 71.8% | 82.8% | 70.0% |
| 2015 | 77.5% | 79.2% | 72.7% | 83.2% | 70.3% |
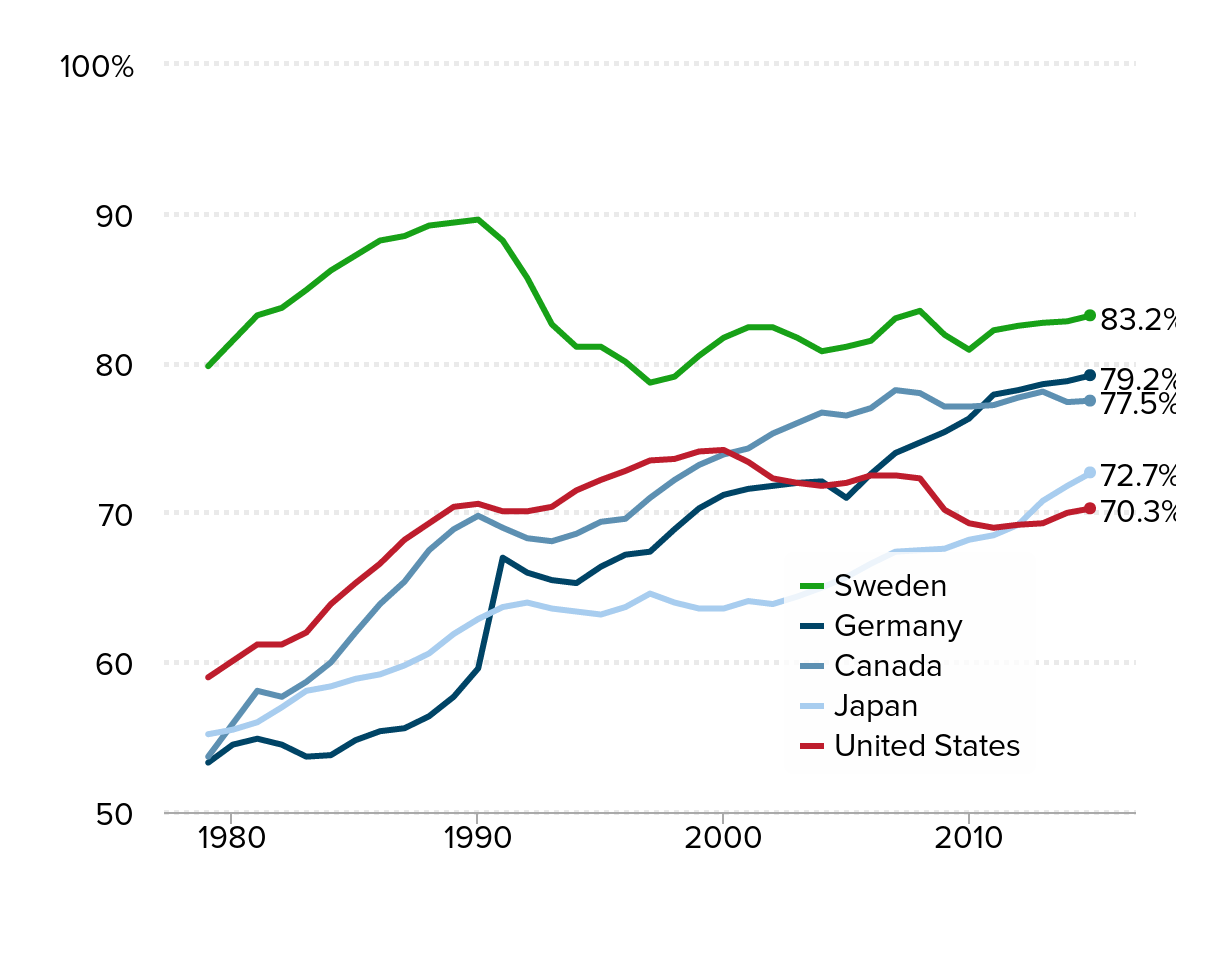
Source: EPI analysis of OECD Labour Force Statistics
After the birth of a child, fathers spend more time at the office, whereas mothers spend less: Average weekly hours worked, by gender and household type, 2014
| Gender | Men | Women |
|---|---|---|
| All | 40.9588 | 36.1858 |
| No children | 40.4231 | 36.8106 |
| At least one child less than 6 years old | 43.1141 | 35.4717 |
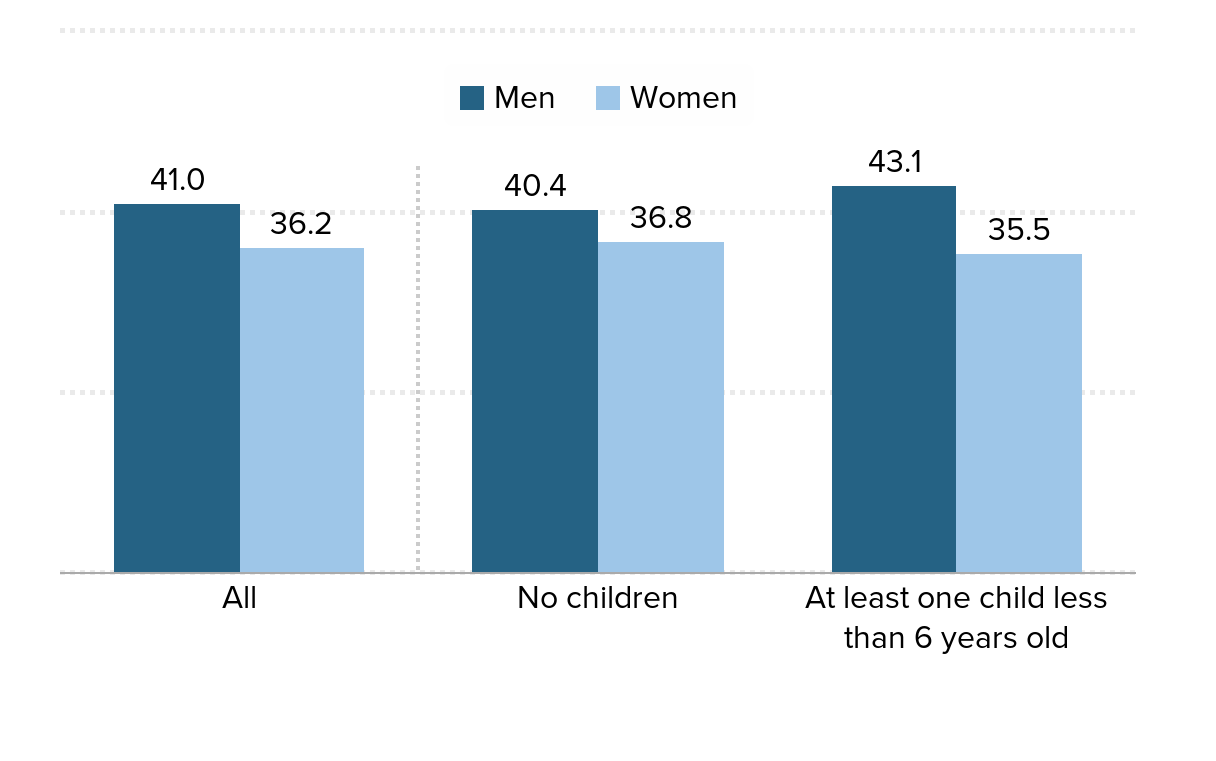
Notes: Sample is limited to prime-age workers (workers age 25–54) with positive average weekly hours worked.
Source: EPI analysis of the March Current Population Survey
Parenthood has opposite effects on mothers' and fathers' labor force participation: Labor force participation by gender and parental status, 2013–2015
| Men | Women | |
|---|---|---|
| All | 88.30% | 73.8% |
| Workers with no children | 84.20% | 76.80% |
| Workers with children | 93.90% | 71.00% |
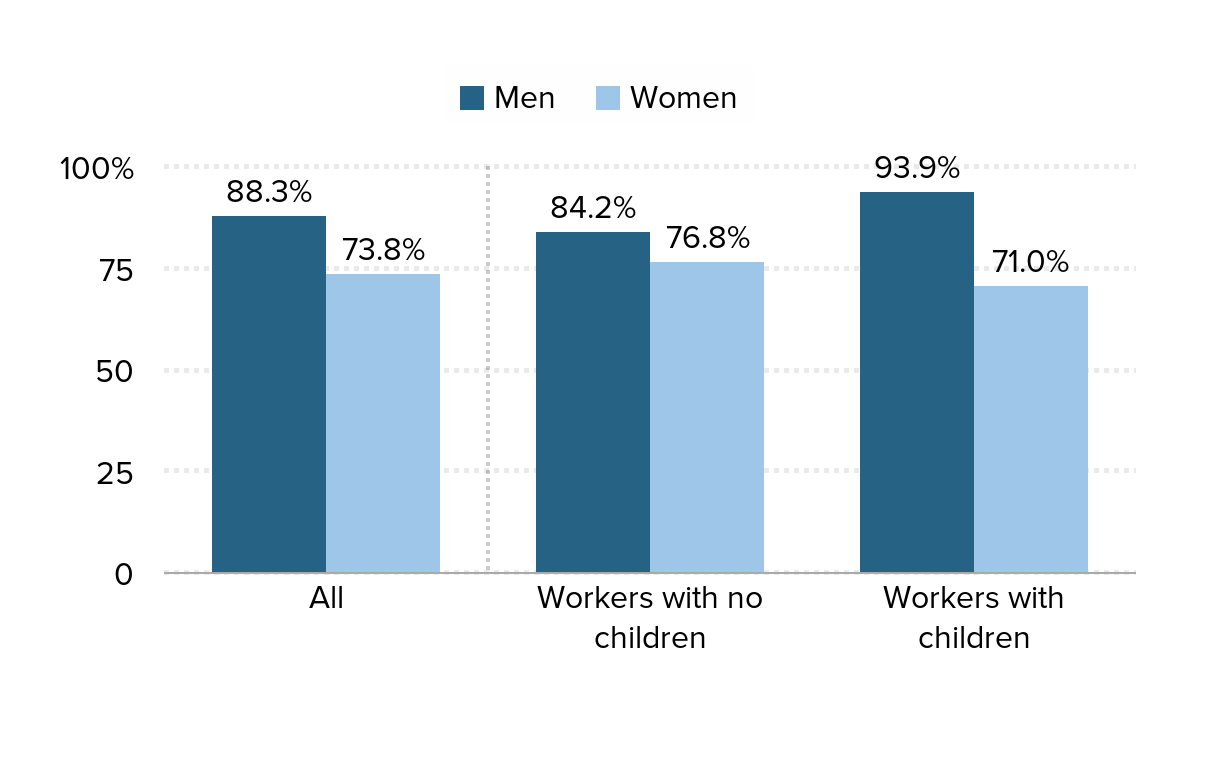
Note: Sample limited to people ages 25–54. Children are defined as being less than 18 years old. The labor force participation rate is the percentage of people who either have a job or are actively looking for a job, and are not on active duty in the Armed Forces or living in institutions (such as correctional facilities or nursing homes).
30 percent of the reduction of the gender wage gap between the median male and female worker since 1979 is due to the decline in men’s wages: Median hourly wages, by gender, 1979–2015
| Year | Men’s median hourly wages | Women’s median hourly wages |
|---|---|---|
| 1979 | $20.30 | $12.66 |
| 1980 | $19.98 | $12.60 |
| 1981 | $19.52 | $12.53 |
| 1982 | $19.30 | $12.61 |
| 1983 | $19.18 | $12.76 |
| 1984 | $19.15 | $12.93 |
| 1985 | $19.10 | $12.98 |
| 1986 | $19.70 | $13.26 |
| 1987 | $19.75 | $13.64 |
| 1988 | $19.23 | $13.64 |
| 1989 | $18.57 | $13.71 |
| 1990 | $18.12 | $13.62 |
| 1991 | $18.06 | $13.68 |
| 1992 | $18.10 | $13.82 |
| 1993 | $17.87 | $14.02 |
| 1994 | $17.67 | $13.98 |
| 1995 | $17.91 | $13.85 |
| 1996 | $17.93 | $13.87 |
| 1997 | $17.85 | $14.14 |
| 1998 | $18.65 | $14.54 |
| 1999 | $19.10 | $14.73 |
| 2000 | $19.20 | $15.03 |
| 2001 | $19.44 | $15.31 |
| 2002 | $19.64 | $15.72 |
| 2003 | $19.35 | $15.61 |
| 2004 | $19.17 | $15.69 |
| 2005 | $18.95 | $15.63 |
| 2006 | $18.91 | $15.58 |
| 2007 | $19.21 | $15.70 |
| 2008 | $19.06 | $15.85 |
| 2009 | $19.75 | $16.06 |
| 2010 | $19.09 | $15.92 |
| 2011 | $18.60 | $15.74 |
| 2012 | $18.59 | $15.44 |
| 2013 | $18.38 | $15.32 |
| 2014 | $18.41 | $15.14 |
| 2015 | $18.94 | $15.67 |
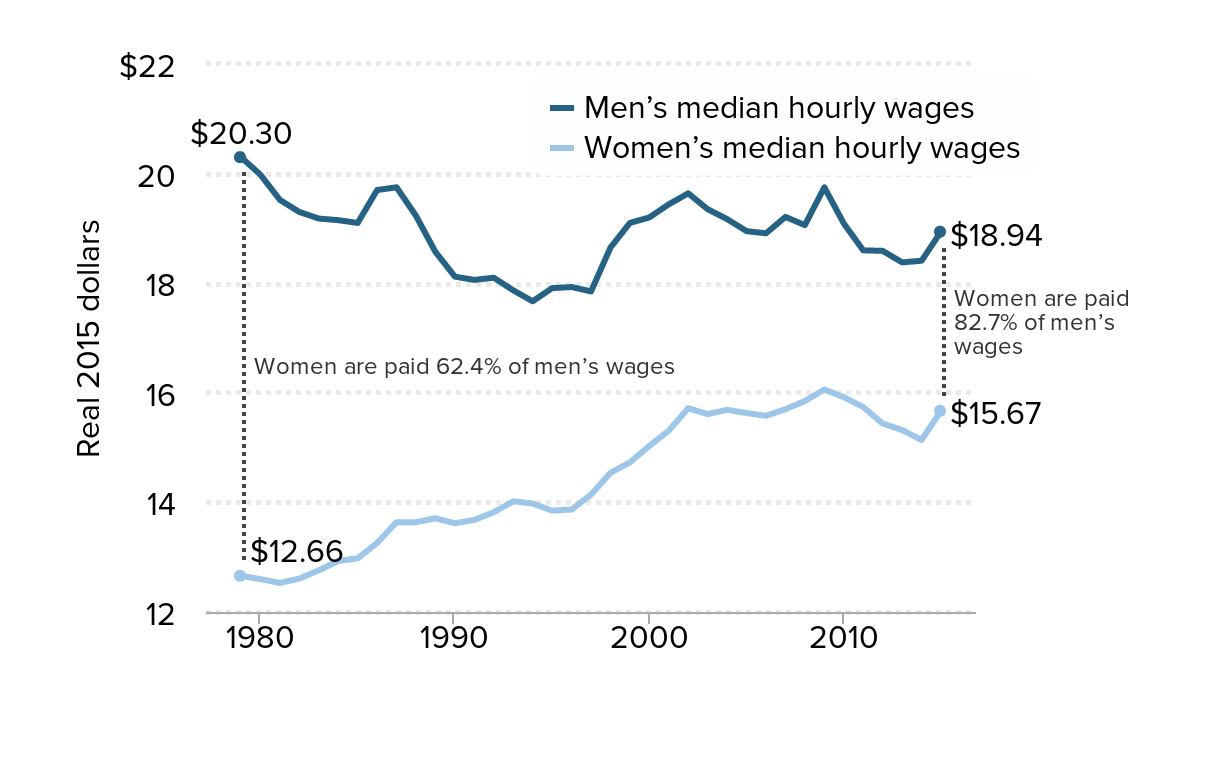
Source: EPI analysis of Current Population Survey Outgoing Rotation Group microdata. For more information on the data sample see EPI's State of Working America Data Library.
Eliminating the gender and inequality wage gap could raise women’s wages by 69%: Median hourly wages for men and women, compared with wages for all workers had they increased in tandem with productivity, 1979–2015
| Year | Wages for all workers | Men’s wages | Women’s wages | Wages for all workers had they grown in tandem with productivity |
|---|---|---|---|---|
| 1979 | $16.15 | $20.30 | $12.66 | $16.15 |
| 1980 | $16.07 | $19.98 | $12.60 | $16.03 |
| 1981 | $15.66 | $19.52 | $12.53 | $16.38 |
| 1982 | $15.75 | $19.30 | $12.61 | $16.13 |
| 1983 | $15.71 | $19.18 | $12.76 | $16.62 |
| 1984 | $15.71 | $19.15 | $12.93 | $17.05 |
| 1985 | $15.80 | $19.10 | $12.98 | $17.34 |
| 1986 | $16.27 | $19.70 | $13.26 | $17.70 |
| 1987 | $16.12 | $19.75 | $13.64 | $17.78 |
| 1988 | $16.10 | $19.23 | $13.64 | $17.99 |
| 1989 | $16.06 | $18.57 | $13.71 | $18.13 |
| 1990 | $15.85 | $18.12 | $13.62 | $18.39 |
| 1991 | $15.94 | $18.06 | $13.68 | $18.54 |
| 1992 | $15.98 | $18.10 | $13.82 | $19.21 |
| 1993 | $16.06 | $17.87 | $14.02 | $19.28 |
| 1994 | $15.80 | $17.67 | $13.98 | $19.46 |
| 1995 | $15.58 | $17.91 | $13.85 | $19.47 |
| 1996 | $15.65 | $17.93 | $13.87 | $19.94 |
| 1997 | $16.04 | $17.85 | $14.14 | $20.22 |
| 1998 | $16.49 | $18.65 | $14.54 | $20.62 |
| 1999 | $16.97 | $19.10 | $14.73 | $21.12 |
| 2000 | $16.83 | $19.20 | $15.03 | $21.61 |
| 2001 | $17.27 | $19.44 | $15.31 | $21.95 |
| 2002 | $17.27 | $19.64 | $15.72 | $22.56 |
| 2003 | $17.56 | $19.35 | $15.61 | $23.30 |
| 2004 | $17.55 | $19.17 | $15.69 | $23.92 |
| 2005 | $17.40 | $18.95 | $15.63 | $24.34 |
| 2006 | $17.51 | $18.91 | $15.58 | $24.49 |
| 2007 | $17.21 | $19.21 | $15.70 | $24.66 |
| 2008 | $17.30 | $19.06 | $15.85 | $24.70 |
| 2009 | $17.65 | $19.75 | $16.06 | $25.20 |
| 2010 | $17.40 | $19.09 | $15.92 | $25.94 |
| 2011 | $16.92 | $18.60 | $15.74 | $25.97 |
| 2012 | $16.83 | $18.59 | $15.44 | $26.12 |
| 2013 | $16.95 | $18.38 | $15.32 | $26.20 |
| 2014 | $16.90 | $18.41 | $15.14 | $26.33 |
| 2015 | 17.11 | 18.94 | 15.67 | 26.47 |
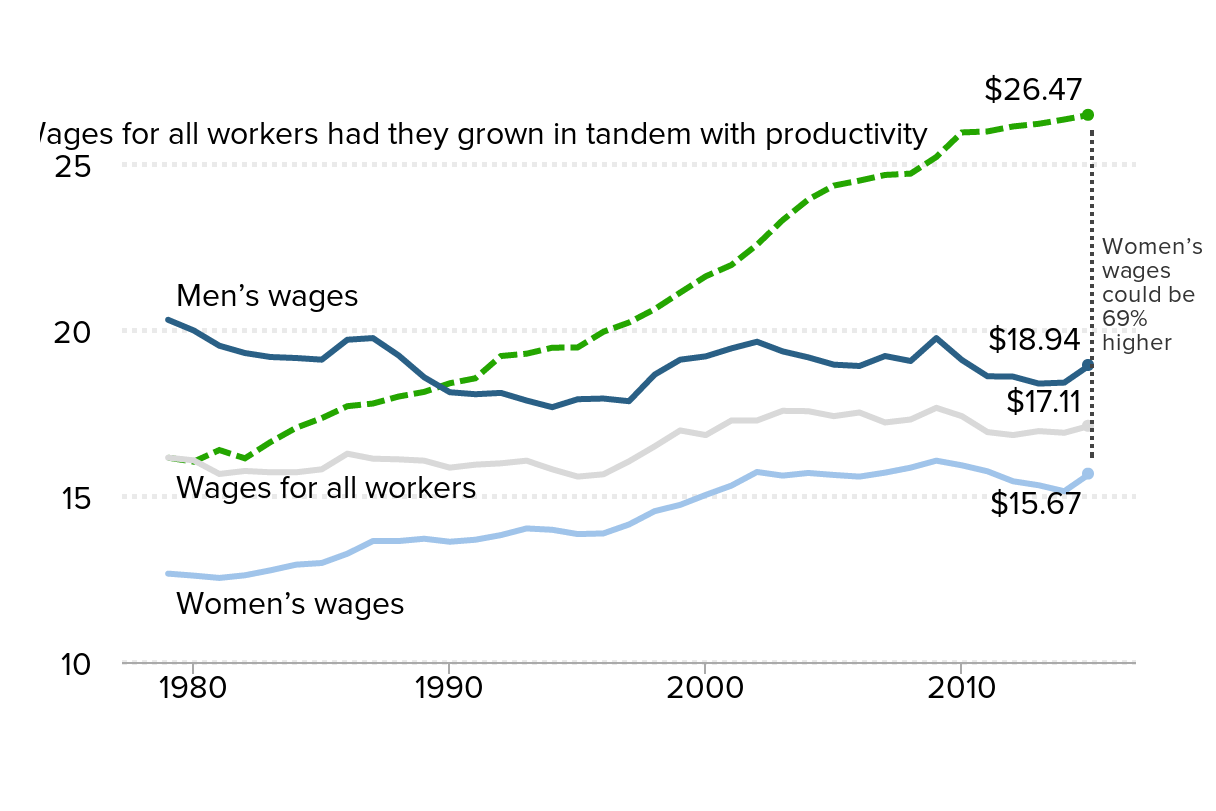
Source: Reproduced from Figure G in Alyssa Davis and Elise Gould, Closing the Pay Gap and Beyond:
A Comprehensive Strategy for Improving Economic Security for Women and Families, EPI Briefing Paper #412, November 18, 2015
Thank you!
Economic Policy Institute: epi.org
Women’s Economic Agenda: epi.org/womens-agenda
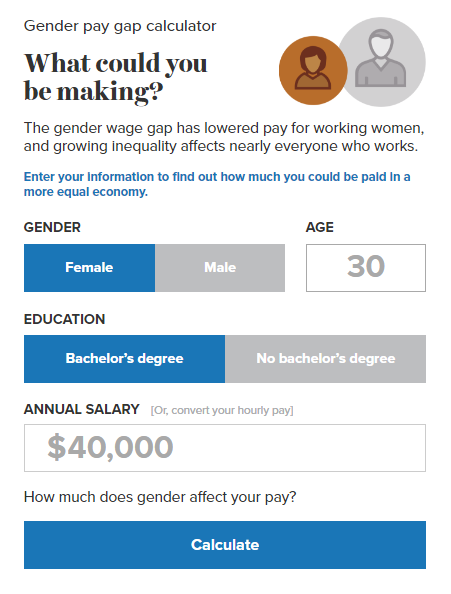
Pay Calculator: epi.org/paygapcalc
