Slow wage growth and rising inequality for most of the last four decades
APPAM Fall Research Conference
Denver, Colorado
November 8, 2019
Elise Gould
Senior Institute Economist
Economic Policy Institute
Slow wage growth and rising inequality is the norm
- Wages for the vast majority have grown slower than their potential and much slower than those at the top
- Except for the late 1990s and the last couple of years, wage growth would be zero over the last four decades
- Slow wage growth cannot be explained away by including benefits or looking at total compensation
- Slow wage growth cannot be explained away by changing the price deflator
- Slow wage growth cannot be explained away by shortages of skills or education
Wages for the vast majority have grown slower than their potential and much slower than those at the top
The gap between productivity and a typical worker's compensation has increased dramatically since 1979: Productivity growth and hourly compensation growth, 1948–2018
| Year | Hourly compensation | Net productivity |
|---|---|---|
| 1948 | 0.00% | 0.00% |
| 1949 | 6.24% | 1.55% |
| 1950 | 10.46% | 9.34% |
| 1951 | 11.74% | 12.25% |
| 1952 | 15.02% | 15.49% |
| 1953 | 20.82% | 19.41% |
| 1954 | 23.48% | 21.44% |
| 1955 | 28.70% | 26.38% |
| 1956 | 33.89% | 26.59% |
| 1957 | 37.08% | 30.04% |
| 1958 | 38.08% | 32.72% |
| 1959 | 42.46% | 37.64% |
| 1960 | 45.38% | 40.07% |
| 1961 | 47.84% | 44.37% |
| 1962 | 52.32% | 49.81% |
| 1963 | 54.86% | 55.03% |
| 1964 | 58.32% | 59.95% |
| 1965 | 62.27% | 64.92% |
| 1966 | 64.70% | 69.96% |
| 1967 | 66.68% | 71.98% |
| 1968 | 71.05% | 77.13% |
| 1969 | 74.39% | 77.85% |
| 1970 | 76.81% | 80.35% |
| 1971 | 81.66% | 87.11% |
| 1972 | 91.34% | 92.21% |
| 1973 | 90.96% | 96.96% |
| 1974 | 87.05% | 93.83% |
| 1975 | 86.86% | 98.11% |
| 1976 | 89.35% | 103.60% |
| 1977 | 92.82% | 106.06% |
| 1978 | 95.66% | 108.27% |
| 1979 | 93.25% | 108.12% |
| 1980 | 88.05% | 106.78% |
| 1981 | 87.36% | 110.50% |
| 1982 | 87.70% | 108.38% |
| 1983 | 88.49% | 114.51% |
| 1984 | 87.03% | 120.22% |
| 1985 | 86.18% | 123.65% |
| 1986 | 87.25% | 128.28% |
| 1987 | 84.67% | 128.81% |
| 1988 | 84.02% | 132.01% |
| 1989 | 83.93% | 134.12% |
| 1990 | 82.37% | 136.96% |
| 1991 | 82.02% | 138.50% |
| 1992 | 83.20% | 147.48% |
| 1993 | 83.46% | 148.51% |
| 1994 | 83.89% | 150.54% |
| 1995 | 82.76% | 151.60% |
| 1996 | 82.87% | 156.24% |
| 1997 | 84.87% | 160.72% |
| 1998 | 89.27% | 166.22% |
| 1999 | 91.98% | 173.47% |
| 2000 | 92.96% | 179.47% |
| 2001 | 95.60% | 183.72% |
| 2002 | 99.49% | 191.51% |
| 2003 | 101.58% | 201.22% |
| 2004 | 100.56% | 209.30% |
| 2005 | 99.73% | 215.31% |
| 2006 | 99.88% | 217.62% |
| 2007 | 101.45% | 219.79% |
| 2008 | 101.39% | 221.21% |
| 2009 | 109.30% | 228.49% |
| 2010 | 111.00% | 237.94% |
| 2011 | 108.47% | 237.91% |
| 2012 | 106.50% | 239.28% |
| 2013 | 108.40% | 240.69% |
| 2014 | 109.08% | 242.65% |
| 2015 | 112.41% | 245.44% |
| 2016 | 114.39% | 246.00% |
| 2017 | 114.67% | 249.34% |
| 2018 | 115.62% | 252.39% |
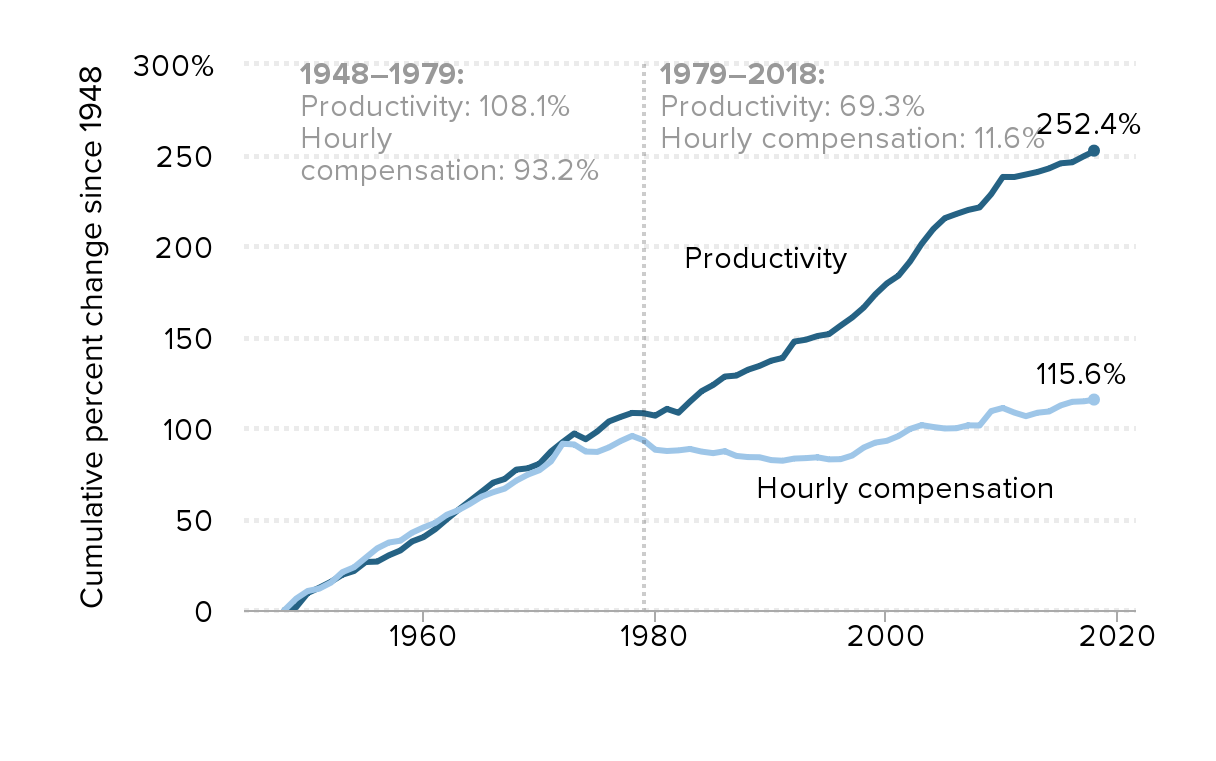
Notes: Data are for compensation (wages and benefits) of production/nonsupervisory workers in the private sector and net productivity of the total economy. “Net productivity” is the growth of output of goods and services less depreciation per hour worked.
Source: EPI analysis of unpublished Total Economy Productivity data from Bureau of Labor Statistics (BLS) Labor Productivity and Costs program, wage data from the BLS Current Employment Statistics, BLS Employment Cost Trends, BLS Consumer Price Index, and Bureau of Economic Analysis National Income and Product Accounts
Updated from Figure A in Raising America’s Pay: Why It’s Our Central Economic Policy Challenge (Bivens et al. 2014)
Top 0.1 percent earnings grew fifteen times faster than bottom 90 percent earnings: Cumulative percent change in real annual earnings, by earnings group, 1979–2018
| Year | Bottom 90% | Top 1% | Top .1% |
|---|---|---|---|
| 1979 | 0.0% | 0.0% | 0.0% |
| 1980 | -2.2% | 3.4% | 5.8% |
| 1981 | -2.6% | 3.1% | 7.3% |
| 1982 | -3.9% | 9.5% | 17.4% |
| 1983 | -3.7% | 13.6% | 28.7% |
| 1984 | -1.8% | 20.7% | 44.0% |
| 1985 | -1.0% | 23.0% | 45.8% |
| 1986 | 1.1% | 32.6% | 60.9% |
| 1987 | 2.1% | 53.5% | 106.6% |
| 1988 | 2.2% | 68.7% | 140.2% |
| 1989 | 1.8% | 63.3% | 123.9% |
| 1990 | 1.1% | 64.8% | 129.8% |
| 1991 | 0.0% | 53.6% | 104.6% |
| 1992 | 1.5% | 74.3% | 156.0% |
| 1993 | 0.9% | 67.9% | 140.2% |
| 1994 | 2.0% | 63.4% | 126.9% |
| 1995 | 2.8% | 70.2% | 137.0% |
| 1996 | 4.1% | 79.0% | 157.3% |
| 1997 | 7.0% | 100.6% | 225.6% |
| 1998 | 11.0% | 113.1% | 254.9% |
| 1999 | 13.2% | 129.7% | 300.5% |
| 2000 | 15.3% | 144.8% | 337.6% |
| 2001 | 15.7% | 130.4% | 300.5% |
| 2002 | 15.6% | 109.3% | 239.5% |
| 2003 | 15.7% | 113.9% | 250.1% |
| 2004 | 15.6% | 127.2% | 287.6% |
| 2005 | 15.0% | 135.3% | 306.9% |
| 2006 | 15.7% | 143.4% | 324.9% |
| 2007 | 16.7% | 156.2% | 362.5% |
| 2008 | 16.0% | 137.5% | 309.0% |
| 2009 | 16.0% | 116.2% | 241.6% |
| 2010 | 15.2% | 130.8% | 278.0% |
| 2011 | 14.5% | 134.0% | 279.0% |
| 2012 | 14.6% | 148.3% | 327.9% |
| 2013 | 15.1% | 137.5% | 289.3% |
| 2014 | 16.6% | 149.0% | 323.7% |
| 2015 | 20.5% | 156.2% | 337.9% |
| 2016 | 21.0% | 148.1% | 310.3% |
| 2017 | 22.2% | 157.3% | 343.2% |
| 2018 | 23.9% | 157.8% | 340.7% |
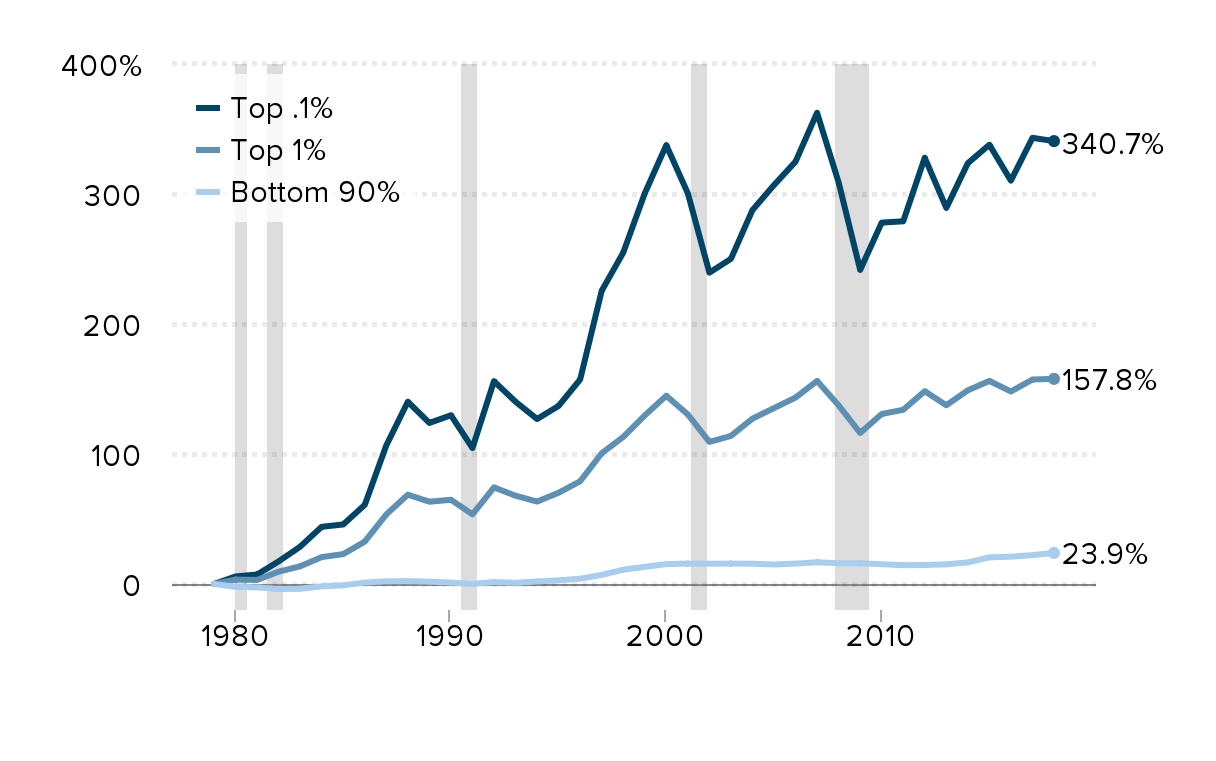
Source: EPI analysis of Kopczuk, Saez, and Song (2010, Table A3) and Social Security Administration wage statistics
The 95th percentile continues to pull away from middle- and low-wage workers: Cumulative change in real hourly wages of all workers, by wage percentile, 1979–2018
| 10th percentile | 50th percentile | 95th percentile | |
|---|---|---|---|
| 1979 | 0.0% | 0.0% | 0.0% |
| 1980 | -6.7% | -0.6% | -1.8% |
| 1981 | -8.1% | -1.7% | -1.5% |
| 1982 | -11.8% | -2.1% | 0.5% |
| 1983 | -14.7% | -1.9% | 3.5% |
| 1984 | -16.4% | -1.4% | 3.9% |
| 1985 | -17.5% | 0.1% | 6.1% |
| 1986 | -17.2% | 0.8% | 8.6% |
| 1987 | -17.3% | 1.9% | 11.6% |
| 1988 | -16.5% | 0.5% | 14.3% |
| 1989 | -17.1% | 0.3% | 7.7% |
| 1990 | -16.5% | 0.2% | 9.1% |
| 1991 | -15.1% | -0.6% | 10.6% |
| 1992 | -14.4% | 0.4% | 8.8% |
| 1993 | -13.1% | 1.9% | 6.6% |
| 1994 | -13.8% | 0.8% | 12.4% |
| 1995 | -14.7% | -0.6% | 12.7% |
| 1996 | -15.7% | -2.3% | 13.4% |
| 1997 | -13.2% | -0.3% | 14.8% |
| 1998 | -7.8% | 3.3% | 18.3% |
| 1999 | -6.1% | 5.9% | 21.5% |
| 2000 | -6.7% | 6.5% | 24.9% |
| 2001 | -3.8% | 8.2% | 27.0% |
| 2002 | -0.8% | 9.8% | 31.6% |
| 2003 | -1.2% | 9.9% | 30.5% |
| 2004 | -3.0% | 11.1% | 31.7% |
| 2005 | -5.3% | 9.5% | 32.0% |
| 2006 | -5.9% | 9.9% | 33.2% |
| 2007 | -4.3% | 10.1% | 35.5% |
| 2008 | -3.2% | 9.3% | 36.3% |
| 2009 | -2.4% | 11.7% | 39.4% |
| 2010 | -3.2% | 11.0% | 38.6% |
| 2011 | -5.7% | 8.2% | 37.3% |
| 2012 | -7.3% | 6.9% | 39.0% |
| 2013 | -6.7% | 7.4% | 41.4% |
| 2014 | -5.9% | 7.5% | 39.4% |
| 2015 | -1.4% | 9.3% | 48.3% |
| 2016 | -0.6% | 11.2% | 49.8% |
| 2017 | 3.5% | 12.2% | 52.0% |
| 2018 | 4.1% | 14.0% | 56.1% |
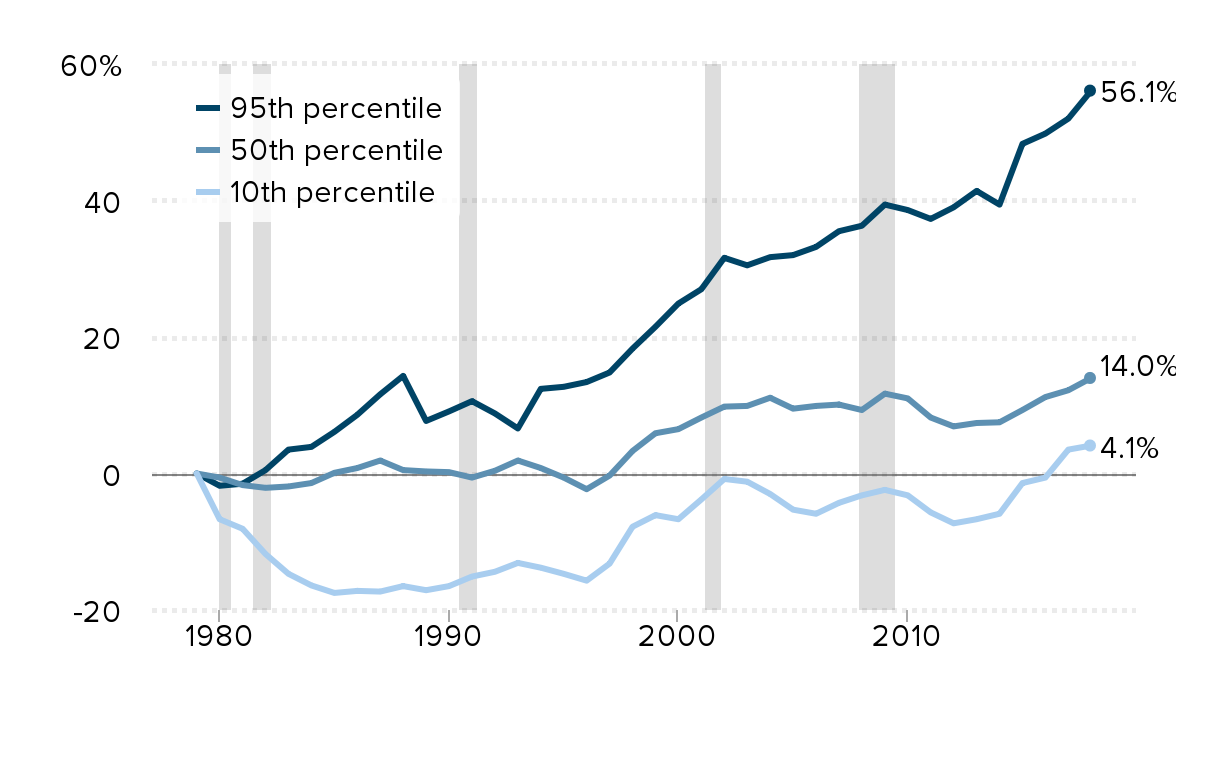
Notes: Shaded areas denote recessions. The xth-percentile wage is the wage at which x% of wage earners earn less and (100−x)% earn more.
Source: EPI analysis of Current Population Survey Outgoing Rotation Group microdata
Wages for the vast majority have grown slower than their potential and much slower than those at the top
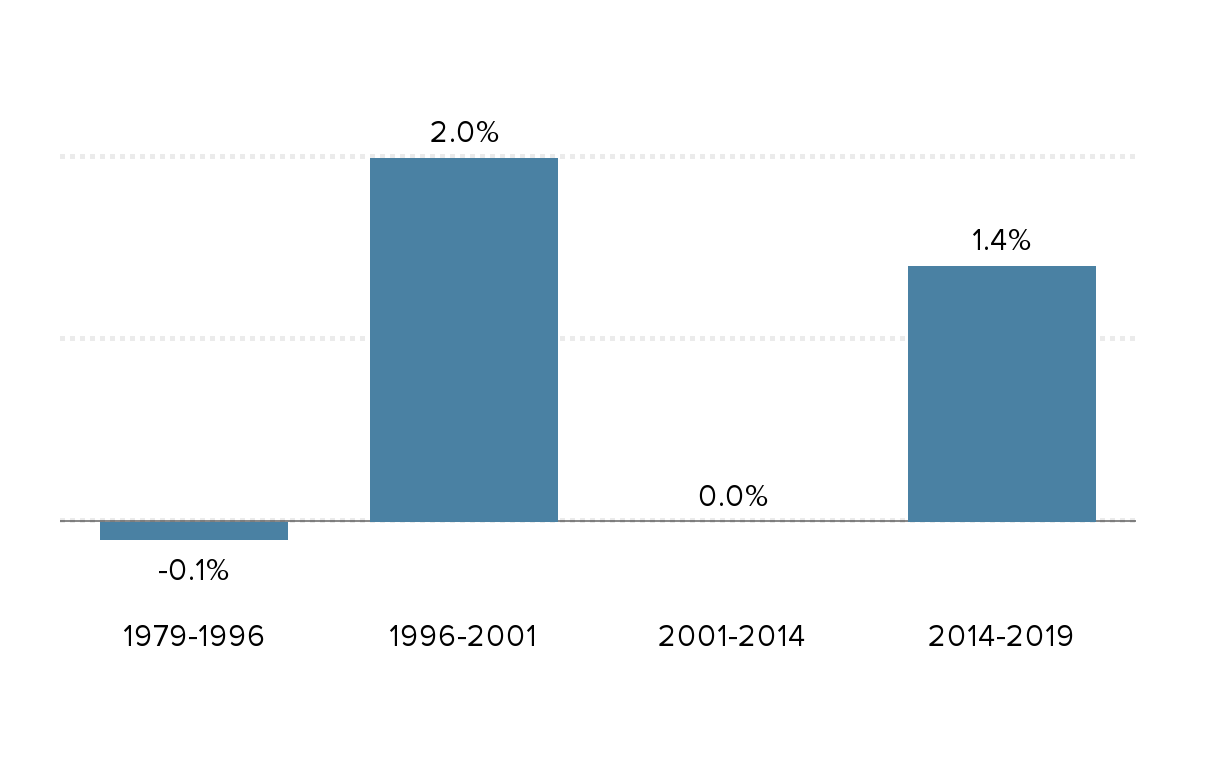
Except for the late 1990s and the last couple of years, wage growth would be zero over the last four decades
Consistent positive growth in only 9 of the last 39 years: Annualized real median hourly wage growth in each period
| 50th percentile | 50th percentile | 50th percentile | 50th percentile | |
|---|---|---|---|---|
| 1979 | 0.00% | |||
| 1980 | -0.60% | |||
| 1981 | -1.70% | |||
| 1982 | -2.10% | |||
| 1983 | -1.90% | |||
| 1984 | -1.40% | |||
| 1985 | 0.10% | |||
| 1986 | 0.80% | |||
| 1987 | 1.90% | |||
| 1988 | 0.50% | |||
| 1989 | 0.30% | |||
| 1990 | 0.20% | |||
| 1991 | -0.60% | |||
| 1992 | 0.40% | |||
| 1993 | 1.90% | |||
| 1994 | 0.80% | |||
| 1995 | -0.60% | |||
| 1996 | -2.30% | -2.30% | ||
| 1997 | -0.30% | |||
| 1998 | 3.30% | |||
| 1999 | 5.90% | |||
| 2000 | 6.50% | |||
| 2001 | 8.20% | 8.20% | ||
| 2002 | 9.80% | |||
| 2003 | 9.90% | |||
| 2004 | 11.10% | |||
| 2005 | 9.50% | |||
| 2006 | 9.90% | |||
| 2007 | 10.10% | |||
| 2008 | 9.30% | |||
| 2009 | 11.70% | |||
| 2010 | 11.00% | |||
| 2011 | 8.20% | |||
| 2012 | 6.90% | |||
| 2013 | 7.40% | |||
| 2014 | 7.50% | 7.50% | ||
| 2015 | 9.30% | |||
| 2016 | 11.20% | |||
| 2017 | 12.20% | |||
| 2018 | 14.0% | |||
| 2019 | 15.1% |
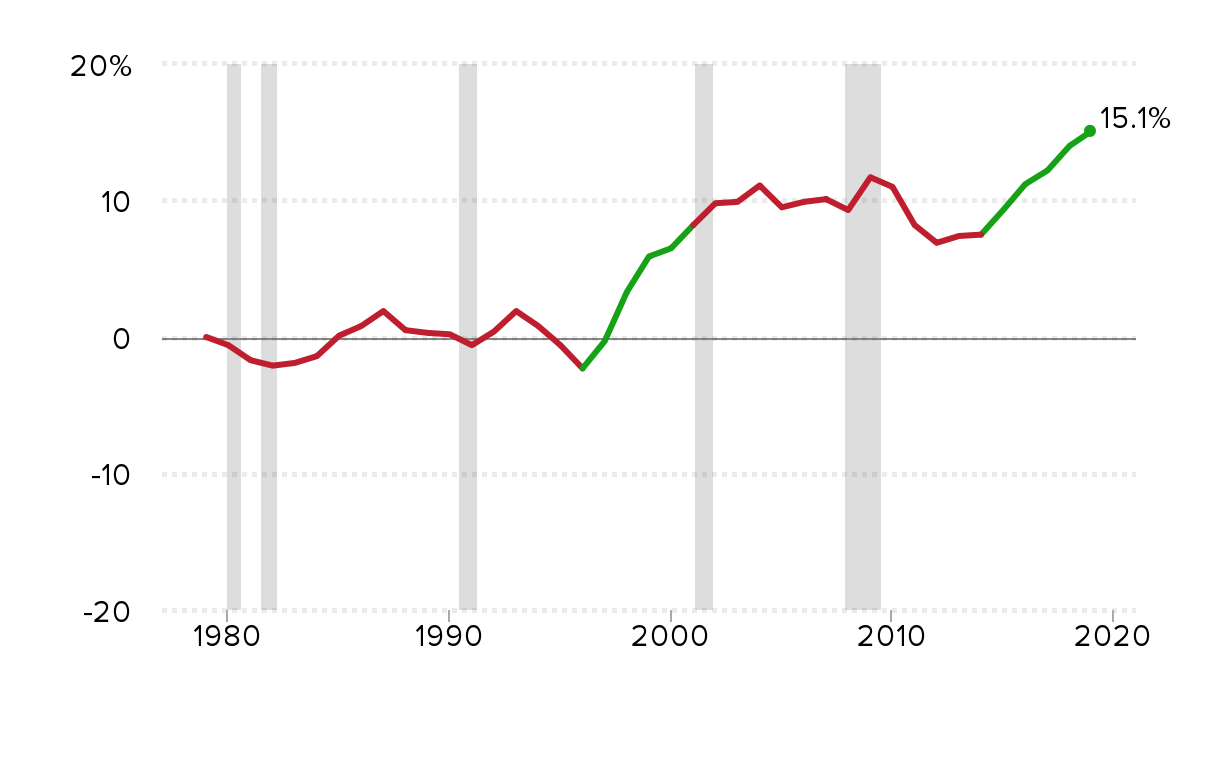
| Years | Real median hourly wage growth |
|---|---|
| 1979-1996 | -0.1% |
| 1996-2001 | 2.0% |
| 2001-2014 | 0.0% |
| 2014-2019 | 1.4% |
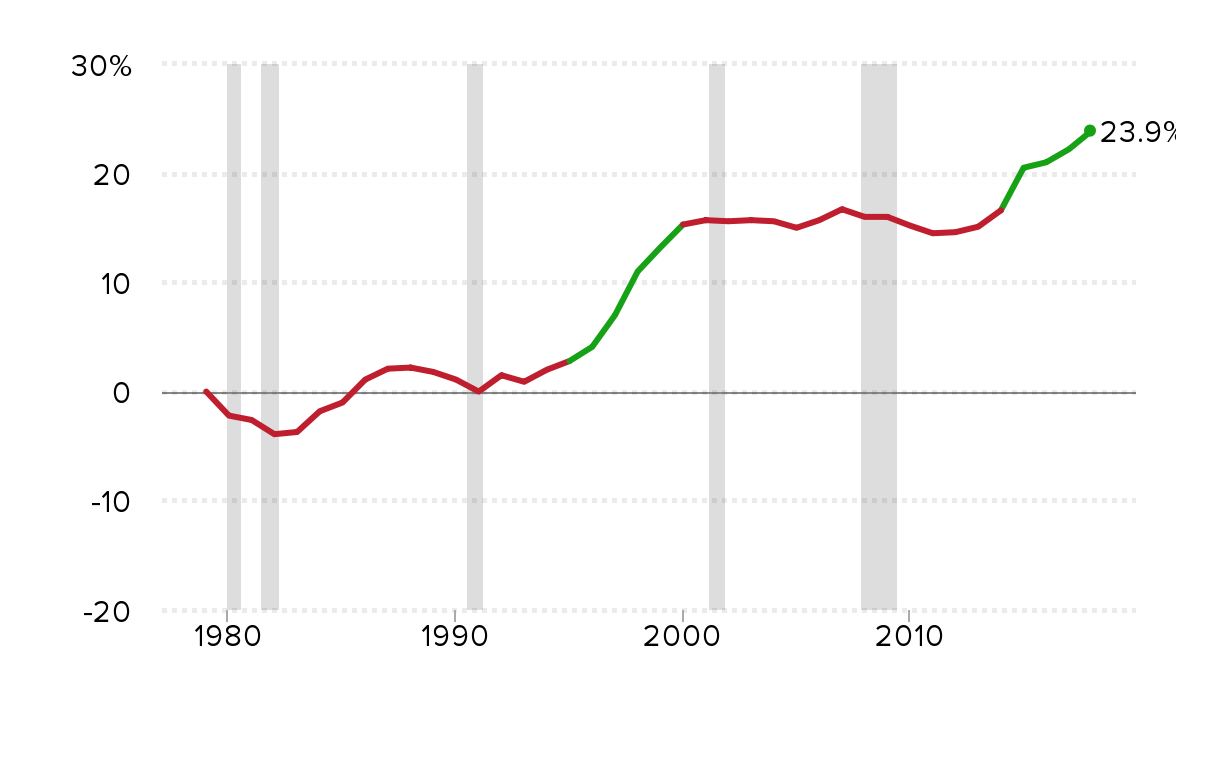
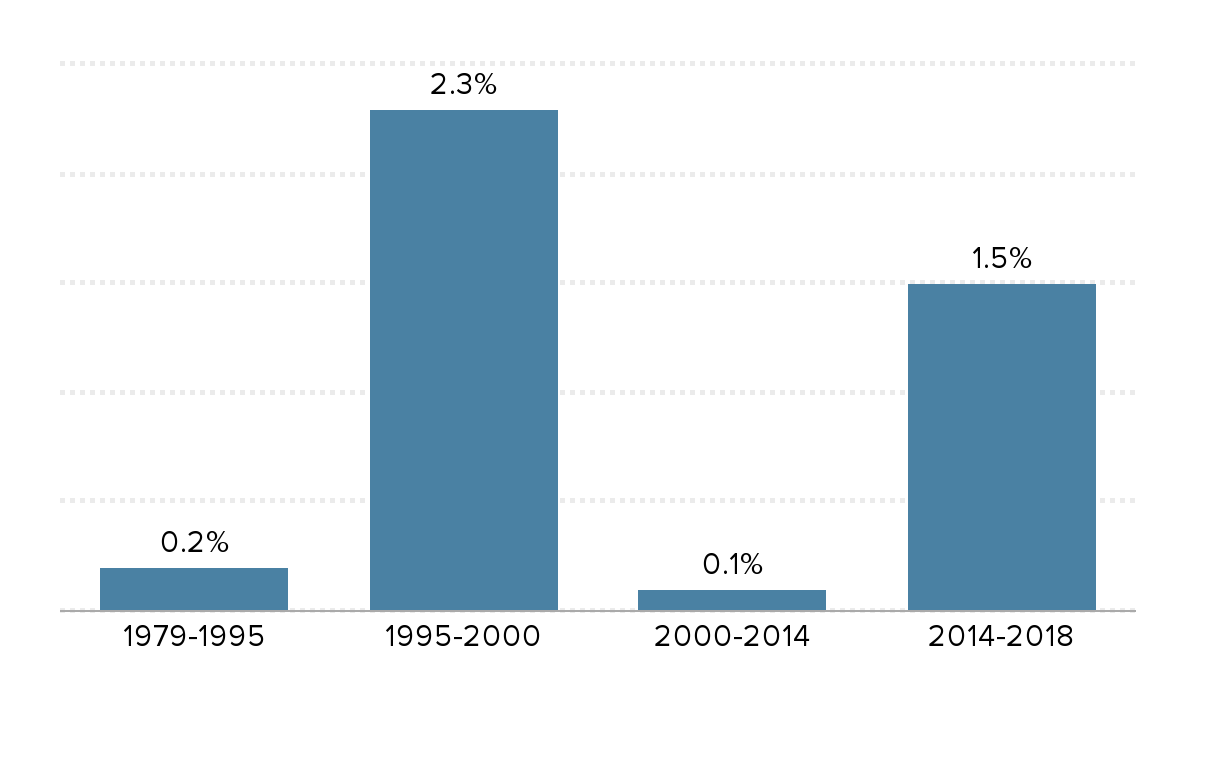
Real annual earnings of the bottom 90% only saw consistent gains when the labor market was the tightest: Cumulative and annualized change in real annual earnings of the bottom 90% for various periods, 1979-2018
| Year | Bottom 90% | Bottom 90% | Bottom 90% | Bottom 90% |
|---|---|---|---|---|
| 1979 | 0.0% | |||
| 1980 | -2.2% | |||
| 1981 | -2.6% | |||
| 1982 | -3.9% | |||
| 1983 | -3.7% | |||
| 1984 | -1.8% | |||
| 1985 | -1.0% | |||
| 1986 | 1.1% | |||
| 1987 | 2.1% | |||
| 1988 | 2.2% | |||
| 1989 | 1.8% | |||
| 1990 | 1.1% | |||
| 1991 | 0.0% | |||
| 1992 | 1.5% | |||
| 1993 | 0.9% | |||
| 1994 | 2.0% | |||
| 1995 | 2.8% | 2.8% | ||
| 1996 | 4.1% | |||
| 1997 | 7.0% | |||
| 1998 | 11.0% | |||
| 1999 | 13.2% | |||
| 2000 | 15.3% | 15.3% | ||
| 2001 | 15.7% | |||
| 2002 | 15.6% | |||
| 2003 | 15.7% | |||
| 2004 | 15.6% | |||
| 2005 | 15.0% | |||
| 2006 | 15.7% | |||
| 2007 | 16.7% | |||
| 2008 | 16.0% | |||
| 2009 | 16.0% | |||
| 2010 | 15.2% | |||
| 2011 | 14.5% | |||
| 2012 | 14.6% | |||
| 2013 | 15.1% | |||
| 2014 | 16.6% | 16.6% | ||
| 2015 | 20.5% | |||
| 2016 | 21.0% | |||
| 2017 | 22.2% | |||
| 2018 | 23.9% |
| Years | Annual growth rate |
|---|---|
| 1979-1995 | 0.2% |
| 1995-2000 | 2.3% |
| 2000-2014 | 0.1% |
| 2014-2018 | 1.5% |
Wages for the vast majority have grown slower than their potential and much slower than those at the top
Except for the late 1990s and the last couple of years, wage growth would be zero over the last four decades
Slow wage growth cannot be explained away by including benefits or looking at total compensation
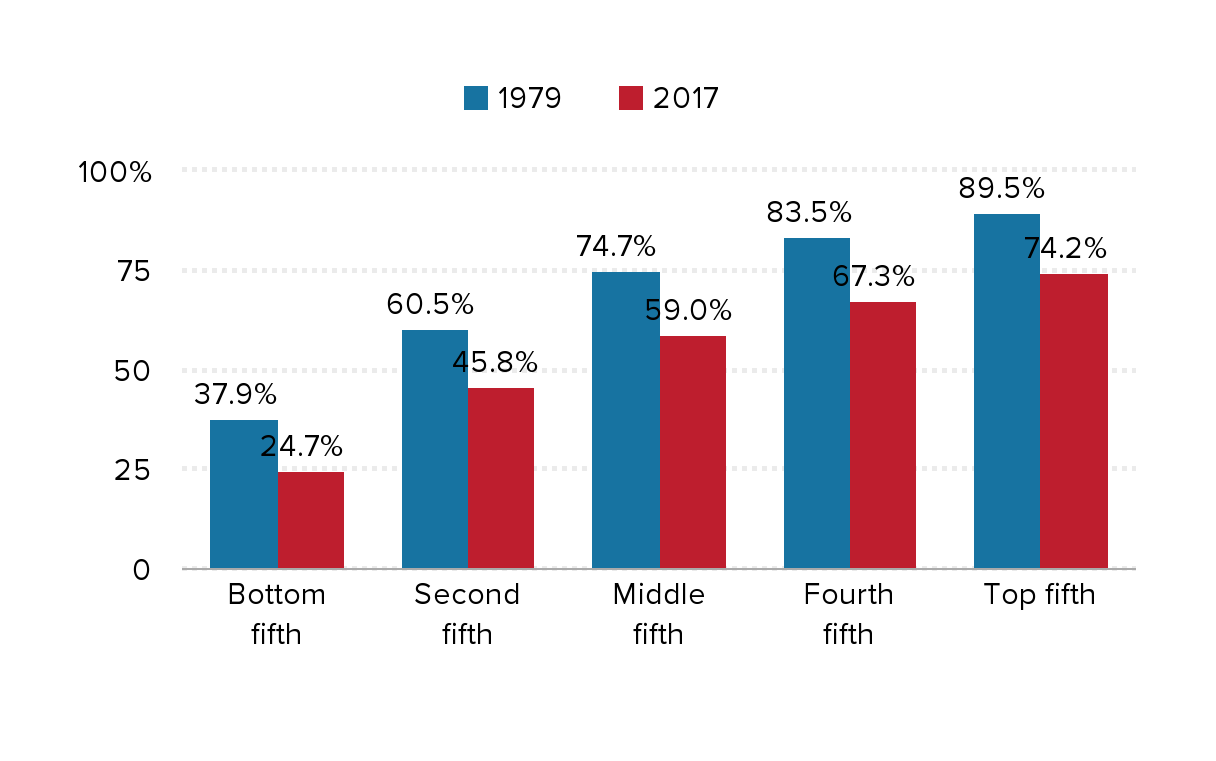
Declining incidence of employer-sponsored health insurance coverage, 1979-2017
| Date | 1979 | 2017 |
|---|---|---|
| Bottom fifth | 37.90% | 24.7% |
| Second fifth | 60.50% | 45.8% |
| Middle fifth | 74.70% | 59.0% |
| Fourth fifth | 83.50% | 67.3% |
| Top fifth | 89.50% | 74.2% |
Source: The Economic Policy Institute’s State of Working America Data Library
Growth of productivity, real average compensation (consumer and producer), and real median compensation, 1979–2018
| Year | Real median hourly wage | Real median hourly compensation | Real consumer average hourly compensation | Real producer average hourly compensation | Net productivity |
|---|---|---|---|---|---|
| 1979 | 0.0% | 0.0% | 0.0% | 0.0% | 0.0% |
| 1980 | -0.7% | -0.4% | -0.8% | 1.3% | -0.6% |
| 1981 | -1.7% | -1.0% | -0.5% | 1.6% | 1.1% |
| 1982 | -2.1% | -1.0% | 1.2% | 3.1% | 0.1% |
| 1983 | -1.9% | -0.5% | 1.5% | 3.3% | 3.1% |
| 1984 | -1.4% | -0.1% | 2.1% | 4.2% | 5.8% |
| 1985 | 0.1% | 1.6% | 3.8% | 5.9% | 7.5% |
| 1986 | 0.8% | 2.4% | 7.5% | 9.4% | 9.7% |
| 1987 | 1.9% | 3.0% | 8.1% | 10.9% | 9.9% |
| 1988 | 0.5% | 1.7% | 10.0% | 12.8% | 11.5% |
| 1989 | 0.3% | 1.8% | 9.1% | 12.2% | 12.5% |
| 1990 | 0.2% | 1.7% | 10.4% | 14.4% | 13.9% |
| 1991 | -0.7% | 1.3% | 11.6% | 15.7% | 14.6% |
| 1992 | 0.4% | 3.0% | 15.4% | 19.6% | 18.9% |
| 1993 | 1.9% | 4.7% | 14.8% | 18.9% | 19.4% |
| 1994 | 0.8% | 3.2% | 14.0% | 17.9% | 20.4% |
| 1995 | -0.7% | 0.8% | 14.0% | 18.4% | 20.9% |
| 1996 | -2.2% | -1.4% | 14.8% | 19.9% | 23.1% |
| 1997 | -0.2% | 0.0% | 16.7% | 22.0% | 25.3% |
| 1998 | 3.3% | 3.3% | 21.1% | 26.7% | 27.9% |
| 1999 | 5.9% | 5.8% | 24.0% | 30.4% | 31.4% |
| 2000 | 6.5% | 6.4% | 27.5% | 35.5% | 34.3% |
| 2001 | 8.1% | 8.6% | 29.4% | 38.1% | 36.3% |
| 2002 | 9.8% | 11.1% | 30.9% | 39.4% | 40.1% |
| 2003 | 9.9% | 11.8% | 33.6% | 42.4% | 44.7% |
| 2004 | 11.1% | 13.2% | 36.1% | 45.0% | 48.6% |
| 2005 | 9.5% | 11.7% | 36.3% | 45.9% | 51.5% |
| 2006 | 9.9% | 11.5% | 37.1% | 47.1% | 52.6% |
| 2007 | 10.1% | 11.3% | 39.0% | 49.2% | 53.7% |
| 2008 | 9.3% | 10.6% | 38.0% | 50.8% | 54.4% |
| 2009 | 11.6% | 13.6% | 40.9% | 51.6% | 58.0% |
| 2010 | 11.0% | 13.0% | 41.4% | 52.5% | 62.5% |
| 2011 | 8.2% | 10.1% | 39.8% | 52.2% | 62.5% |
| 2012 | 6.9% | 8.3% | 40.2% | 52.7% | 63.2% |
| 2013 | 7.4% | 9.3% | 40.4% | 52.4% | 63.8% |
| 2014 | 7.5% | 9.0% | 41.7% | 53.7% | 64.8% |
| 2015 | 9.2% | 10.5% | 45.3% | 56.2% | 66.1% |
| 2016 | 11.2% | 12.2% | 45.4% | 56.4% | 66.4% |
| 2017 | 12.1% | 13.1% | 46.7% | 58.2% | 68.1% |
| 2018 | 14.0% | 14.9% | 47.4% | 59.0% | 69.6% |

Note: Data are for all workers. Net productivity is the growth of output of goods and services minus depreciation, per hour worked.
Source: EPI analysis of data from the BEA, BLS, and CPS ORG (see technical appendix for more detailed information)
Source: Economic Policy Institute analysis of data from the Bureau of Economic Analysis' National Income and Product Accounts, the Bureau of Labor Statistics' Consumer Price Indexes and Labor Productivity and Costs program, and Current Population Survey Outgoing Rotation Group microdata (see technical appendix for more detailed information)
Wages for the vast majority have grown slower than their potential and much slower than those at the top
Except for the late 1990s and the last couple of years, wage growth would be zero over the last four decades
Slow wage growth cannot be explained away by including benefits or looking at total compensation
Slow wage growth cannot be explained away by changing the price deflator
Using different deflectors still shows slow growth: Cumulative change in real median hourly wages of all workers, 1979–2018
| Date | Median, CPI-U-RS | Median, PCE |
|---|---|---|
| 1979 | 0.0% | 0.0% |
| 1980 | -0.6% | -0.3% |
| 1981 | -1.7% | -0.9% |
| 1982 | -2.1% | -0.9% |
| 1983 | -1.9% | -0.7% |
| 1984 | -1.4% | 0.3% |
| 1985 | 0.1% | 1.8% |
| 1986 | 0.8% | 2.0% |
| 1987 | 1.9% | 3.5% |
| 1988 | 0.5% | 1.8% |
| 1989 | 0.3% | 1.6% |
| 1990 | 0.2% | 2.0% |
| 1991 | -0.6% | 1.4% |
| 1992 | 0.4% | 2.3% |
| 1993 | 1.9% | 3.9% |
| 1994 | 0.8% | 2.8% |
| 1995 | -0.6% | 1.6% |
| 1996 | -2.3% | 0.5% |
| 1997 | -0.3% | 3.0% |
| 1998 | 3.3% | 7.2% |
| 1999 | 5.9% | 10.6% |
| 2000 | 6.5% | 12.3% |
| 2001 | 8.2% | 14.9% |
| 2002 | 9.8% | 17.0% |
| 2003 | 9.9% | 17.5% |
| 2004 | 11.1% | 19.0% |
| 2005 | 9.5% | 17.9% |
| 2006 | 9.9% | 19.0% |
| 2007 | 10.1% | 19.5% |
| 2008 | 9.3% | 19.6% |
| 2009 | 11.7% | 21.9% |
| 2010 | 11.0% | 21.1% |
| 2011 | 8.2% | 18.7% |
| 2012 | 6.9% | 17.5% |
| 2013 | 7.4% | 18.3% |
| 2014 | 7.5% | 18.6% |
| 2015 | 9.3% | 20.5% |
| 2016 | 11.2% | 23.0% |
| 2017 | 12.2% | 24.5% |
| 2018 | 14.0% (0.3%) | 27.1% (0.6%) |
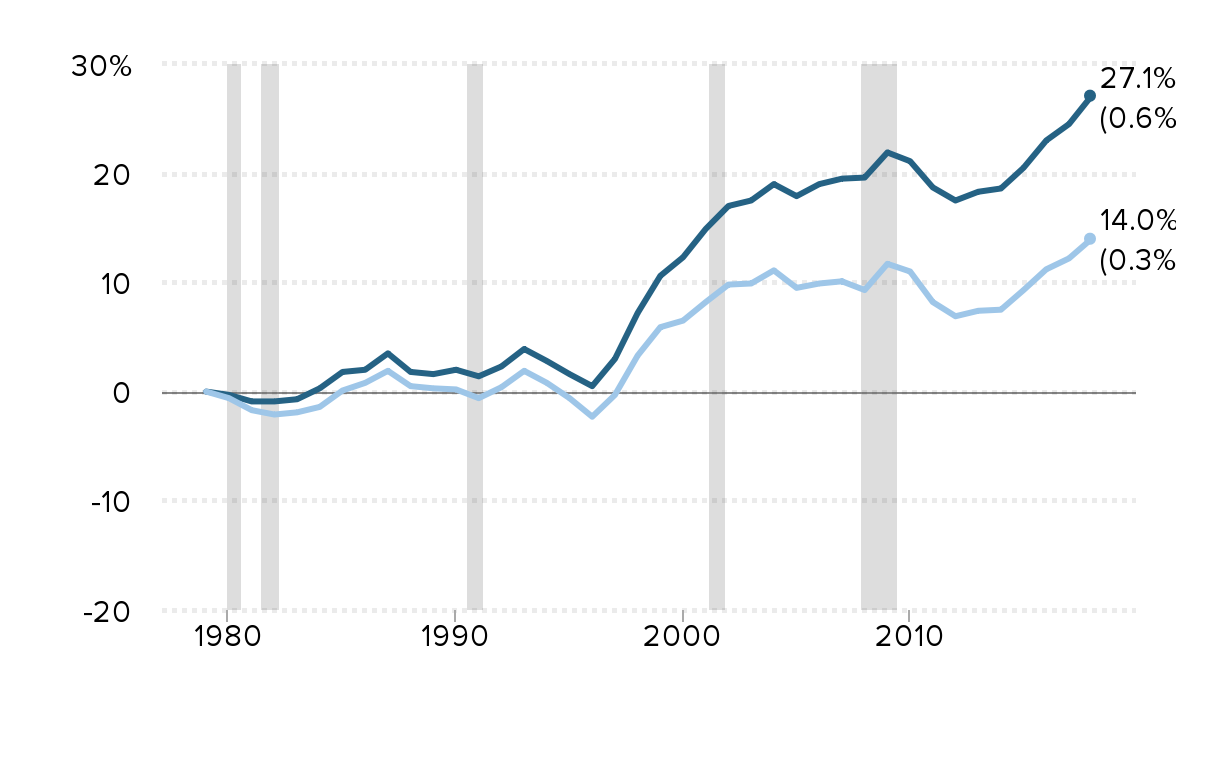
Notes: Shaded areas denote recessions.
Source: EPI analysis of Current Population Survey Outgoing Rotation Group microdata
Using a different deflator doesn't change the fact that most of the growth is at the top: Cumulative change in real hourly wages of all workers, by wage percentile, adjusted using PCE 1979–2018
| Date | 10th | Median | 95th |
|---|---|---|---|
| 1979 | 0.0% | 0.0% | 0.0% |
| 1980 | -6.4% | -0.3% | -1.4% |
| 1981 | -7.4% | -0.9% | -0.7% |
| 1982 | -10.7% | -0.9% | 1.8% |
| 1983 | -13.6% | -0.7% | 4.9% |
| 1984 | -15.0% | 0.3% | 5.7% |
| 1985 | -16.2% | 1.8% | 7.8% |
| 1986 | -16.2% | 2.0% | 9.9% |
| 1987 | -16.0% | 3.5% | 13.4% |
| 1988 | -15.4% | 1.8% | 15.8% |
| 1989 | -16.1% | 1.6% | 9.1% |
| 1990 | -15.0% | 2.0% | 11.1% |
| 1991 | -13.4% | 1.4% | 12.9% |
| 1992 | -12.8% | 2.3% | 10.9% |
| 1993 | -11.5% | 3.9% | 8.7% |
| 1994 | -12.2% | 2.8% | 14.6% |
| 1995 | -12.8% | 1.6% | 15.3% |
| 1996 | -13.4% | 0.5% | 16.6% |
| 1997 | -10.5% | 3.0% | 18.4% |
| 1998 | -4.4% | 7.2% | 22.8% |
| 1999 | -2.0% | 10.6% | 26.9% |
| 2000 | -1.8% | 12.3% | 31.5% |
| 2001 | 2.2% | 14.9% | 35.0% |
| 2002 | 5.7% | 17.0% | 40.2% |
| 2003 | 5.6% | 17.5% | 39.5% |
| 2004 | 3.9% | 19.0% | 41.1% |
| 2005 | 1.9% | 17.9% | 42.2% |
| 2006 | 1.8% | 19.0% | 44.2% |
| 2007 | 3.9% | 19.5% | 47.1% |
| 2008 | 5.9% | 19.6% | 49.1% |
| 2009 | 6.6% | 21.9% | 52.1% |
| 2010 | 5.6% | 21.1% | 51.2% |
| 2011 | 3.5% | 18.7% | 50.7% |
| 2012 | 2.0% | 17.5% | 52.8% |
| 2013 | 2.7% | 18.3% | 55.7% |
| 2014 | 3.8% | 18.6% | 53.8% |
| 2015 | 8.7% | 20.5% | 63.6% |
| 2016 | 10.0% | 23.0% | 65.8% |
| 2017 | 15.0% | 24.5% | 68.8% |
| 2018 | 16.0% | 27.1% | 74.0% |
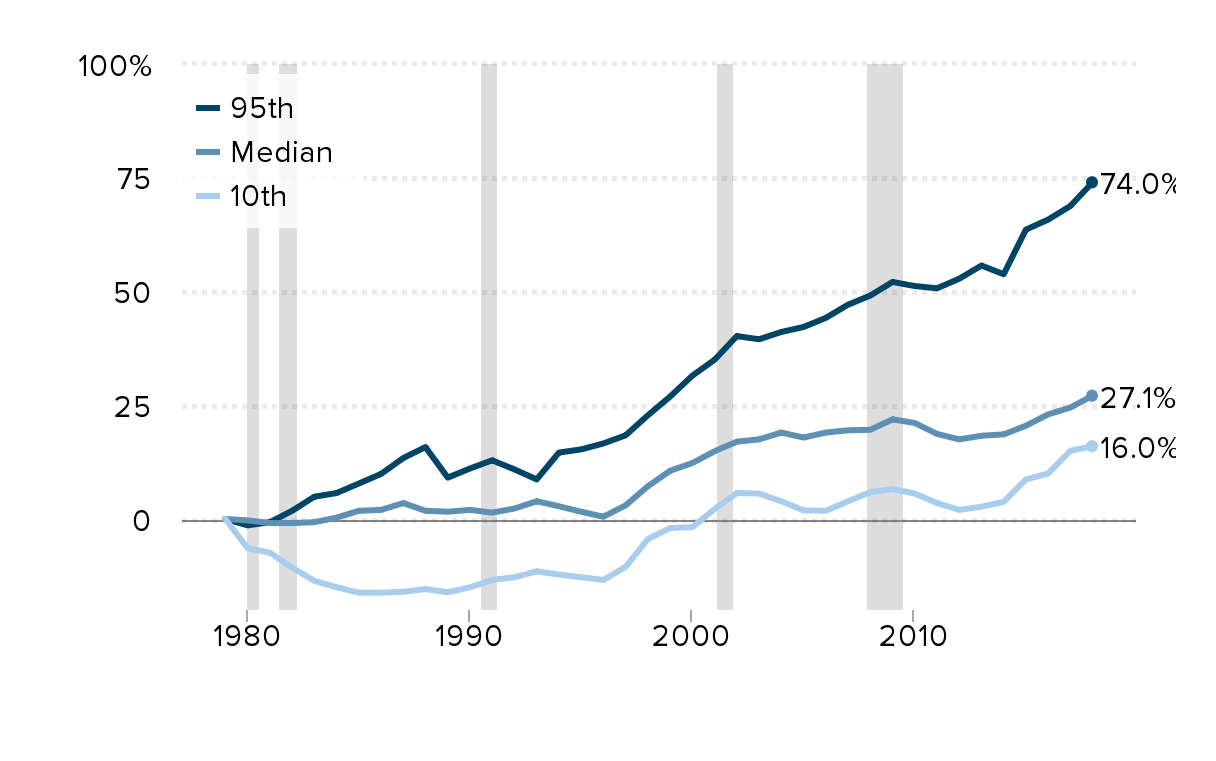
Notes: Shaded areas denote recessions. The xth-percentile wage is the wage at which x% of wage earners earn less and (100−x)% earn more.
Source: EPI analysis of Current Population Survey Outgoing Rotation Group microdata
Using a different deflator doesn’t change the fact that most of the growth is at the very top, 1979–2018
| Year | Bottom 90% | Top 1% | Top 0.1% |
|---|---|---|---|
| 1979 | 0.0% | 0.0% | 0.0% |
| 1980 | -1.8% | 3.8% | 6.2% |
| 1981 | -1.8% | 4.0% | 8.2% |
| 1982 | -2.7% | 10.9% | 18.9% |
| 1983 | -2.4% | 15.1% | 30.3% |
| 1984 | -0.2% | 22.7% | 46.5% |
| 1985 | 0.7% | 25.0% | 48.1% |
| 1986 | 2.3% | 34.3% | 62.8% |
| 1987 | 3.7% | 55.9% | 109.8% |
| 1988 | 3.5% | 70.9% | 143.3% |
| 1989 | 3.1% | 65.4% | 126.8% |
| 1990 | 2.9% | 67.7% | 134.0% |
| 1991 | 2.1% | 56.8% | 108.9% |
| 1992 | 3.5% | 77.6% | 160.9% |
| 1993 | 2.9% | 71.2% | 144.9% |
| 1994 | 4.0% | 66.6% | 131.3% |
| 1995 | 5.1% | 74.0% | 142.3% |
| 1996 | 7.0% | 84.0% | 164.4% |
| 1997 | 10.4% | 107.0% | 236.0% |
| 1998 | 15.2% | 121.1% | 268.3% |
| 1999 | 18.2% | 139.9% | 318.2% |
| 2000 | 21.4% | 157.9% | 361.0% |
| 2001 | 23.0% | 145.0% | 325.7% |
| 2002 | 23.2% | 123.0% | 261.9% |
| 2003 | 23.7% | 128.8% | 274.3% |
| 2004 | 23.9% | 143.4% | 315.3% |
| 2005 | 23.8% | 153.4% | 338.2% |
| 2006 | 25.3% | 163.5% | 360.0% |
| 2007 | 26.7% | 178.1% | 402.1% |
| 2008 | 27.0% | 160.0% | 347.7% |
| 2009 | 26.6% | 136.0% | 272.9% |
| 2010 | 25.7% | 151.9% | 312.4% |
| 2011 | 25.7% | 156.9% | 316.1% |
| 2012 | 26.1% | 173.1% | 370.6% |
| 2013 | 26.8% | 161.5% | 328.8% |
| 2014 | 28.7% | 174.9% | 367.7% |
| 2015 | 33.0% | 182.7% | 383.2% |
| 2016 | 33.9% | 174.5% | 354.0% |
| 2017 | 35.7% | 185.8% | 392.3% |
| 2018 | 38.1% | 187.3% | 391.1% |
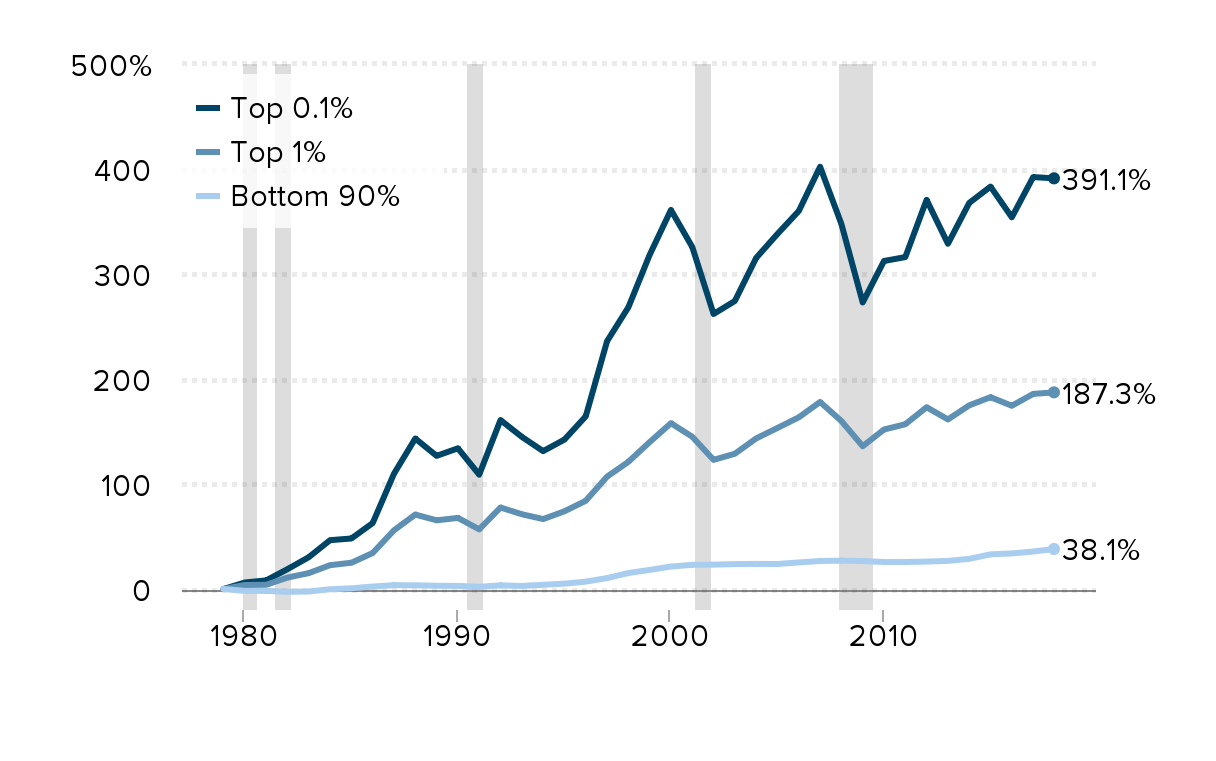
Source: EPI analysis of Kopczuk, Saez, and Song (2010, Table A3) and Social Security Administration wage statistics
Wages for the vast majority have grown slower than their potential and much slower than those at the top
Except for the late 1990s and the last couple of years, wage growth would be zero over the last four decades
Slow wage growth cannot be explained away by including benefits or looking at total compensation
Slow wage growth cannot be explained away by changing the price deflator
Slow wage growth cannot be explained away by shortages of skills or education
The median worker has more experience and education than they did four decades ago: Average age and share of workers with a college degree or more in the middle fifth, 1979-2018
| year | College or more | Average age |
|---|---|---|
| 1979 | 15.65%[labelx=20] | 36.05 |
| 1980 | 16.89% | 36.04 |
| 1981 | 16.17% | 36.18 |
| 1982 | 17.97% | 36.6 |
| 1983 | 18.33% | 36.66 |
| 1984 | 18.02% | 36.47 |
| 1985 | 17.39% | 36.45 |
| 1986 | 17.75% | 36.48 |
| 1987 | 17.77% | 36.67 |
| 1988 | 17.32% | 36.52 |
| 1989 | 17.20% | 36.91 |
| 1990 | 17.89% | 36.91 |
| 1991 | 17.80% | 37.17 |
| 1992 | 17.27% | 37.34 |
| 1993 | 18.05% | 37.77 |
| 1994 | 17.91% | 37.87 |
| 1995 | 18.67% | 37.97 |
| 1996 | 19.47% | 38.23 |
| 1997 | 19.47% | 38.48 |
| 1998 | 20.17% | 38.5 |
| 1999 | 19.53% | 38.32 |
| 2000 | 19.87% | 38.92 |
| 2001 | 20.15% | 39.15 |
| 2002 | 21.57% | 39.8 |
| 2003 | 21.76% | 39.98 |
| 2004 | 21.74% | 40.17 |
| 2005 | 21.69% | 40.12 |
| 2006 | 23.45% | 40.46 |
| 2007 | 23.94% | 40.64 |
| 2008 | 24.77% | 40.77 |
| 2009 | 25.77% | 41.55 |
| 2010 | 26.34% | 41.82 |
| 2011 | 26.51% | 41.9 |
| 2012 | 28.02% | 42.12 |
| 2013 | 28.62% | 42.25 |
| 2014 | 29.80% | 41.97 |
| 2015 | 29.99% | 42.06 |
| 2016 | 29.30% | 42.02 |
| 2017 | 31.03% | 41.87 |
| 2018 | 31.32% | 41.83 |
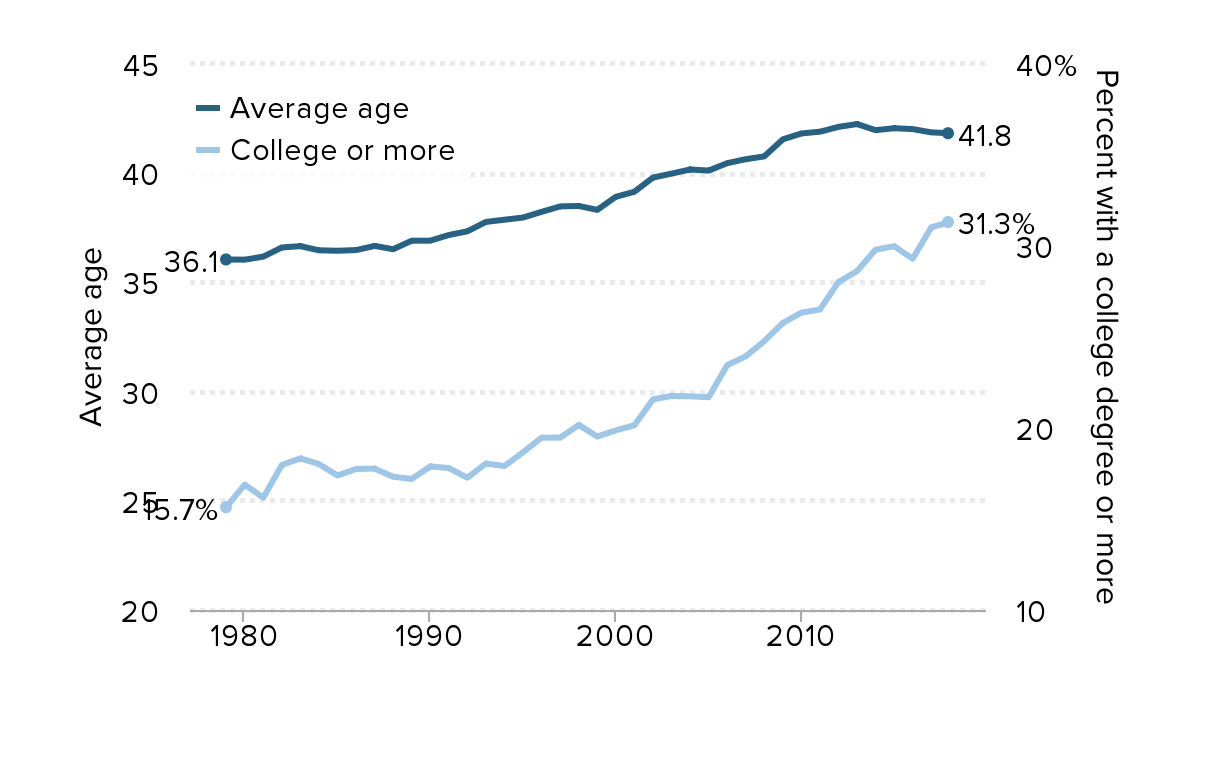
Source: EPI's State of Working America data library.
Wages of the bottom 60 percent of college graduates are lower today than in 2000: Cumulative percent change in real hourly wages of workers with a college degree, by wage percentile, 2000–2018
| year | 50th | 60th | 90th |
|---|---|---|---|
| 2000 | 0.0% | 0.0% | 0.0% |
| 2001 | 2.3% | 1.2% | 3.6% |
| 2002 | 1.5% | 1.4% | 2.4% |
| 2003 | 1.3% | 2.1% | 3.3% |
| 2004 | 0.1% | 0.4% | 2.8% |
| 2005 | -1.4% | 1.1% | 5.5% |
| 2006 | -1.0% | 0.4% | 4.5% |
| 2007 | -0.3% | -0.3% | 6.4% |
| 2008 | -1.1% | -1.1% | 5.9% |
| 2009 | -0.6% | -0.1% | 6.6% |
| 2010 | -1.3% | -0.8% | 5.3% |
| 2011 | -3.1% | -2.6% | 2.0% |
| 2012 | -4.5% | -3.0% | 3.9% |
| 2013 | -2.9% | -1.4% | 4.7% |
| 2014 | -4.5% | -3.1% | 3.9% |
| 2015 | -3.1% | -0.2% | 8.2% |
| 2016 | -1.7% | -0.5% | 14.5% |
| 2017 | -3.2% | 0.7% | 12.2% |
| 2018 | -2.4% | -1.2% | 9.8% |
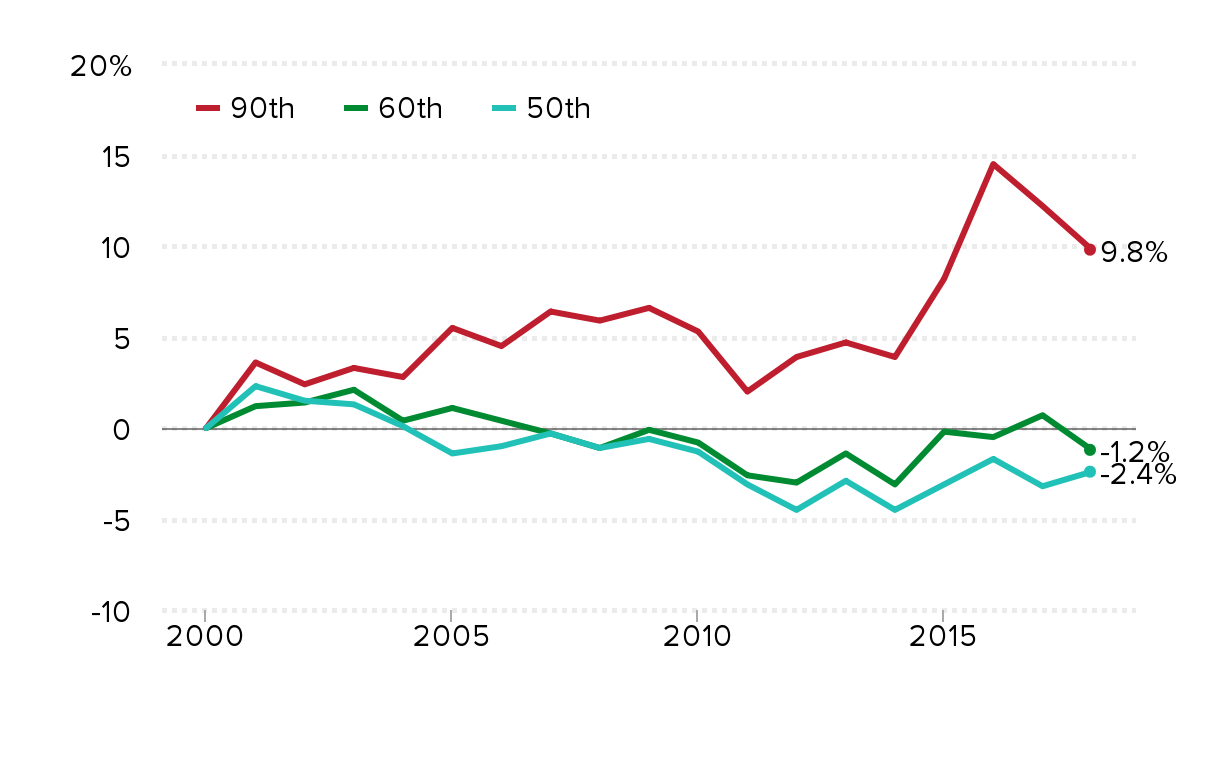
Note: Sample based on all workers ages 16 and older. Education groups are mutually exclusive, so "college" here refers to those with only a four-year college degree.
Source: EPI analysis of Current Population Survey Outgoing Rotation Group microdata from the U.S. Census Bureau
Change in log occupation wage by change in log employment share, 2000–2007

Note: The regression line is from a simple linear regression of change in log occupation wage on change in log employment share. Observations are the 100 occupation percentiles. Standard errors are in parentheses.
Source: Authors’ analysis of Current Population Survey Outgoing Rotation Group microdata
Change in log occupation wage by change in log employment share, 1989–2000
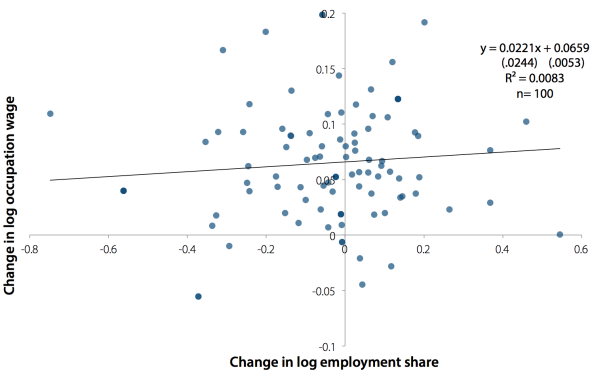
Note: The regression line is from a simple linear regression of change in log occupation wage on change in log employment share. Observations are the 100 occupation percentiles. Standard errors are in parentheses.
Source: Authors’ analysis of Current Population Survey Outgoing Rotation Group microdata
Change in log occupation wage by change in log employment share, 1979–1989
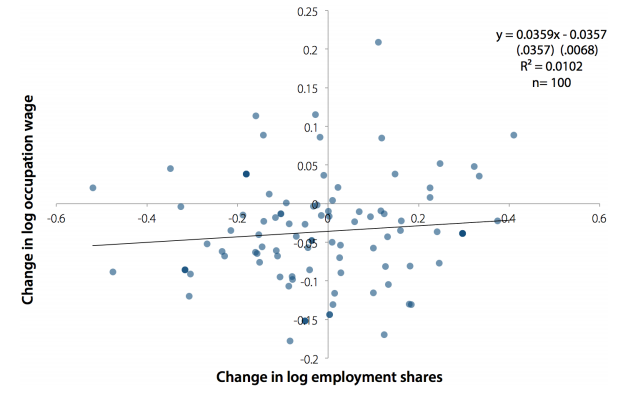
Note: The regression line is from a simple linear regression of change in log occupation wage on change in log employment share. Observations are the 100 occupation percentiles. Standard errors are in parentheses.
Source: Authors’ analysis of Current Population Survey Outgoing Rotation Group microdata
Wages for the vast majority have grown slower than their potential and much slower than those at the top
Except for the late 1990s and the last couple of years, wage growth would be zero over the last four decades
Slow wage growth cannot be explained away by including benefits or looking at total compensation
Slow wage growth cannot be explained away by changing the price deflator
Slow wage growth cannot be explained away by shortages of skills or education
So . . . why is wage growth so slow and unequal?
Supply and demand factors seem to be playing a very little role
Rules were rigged against most workers and in favor of capital owners and high-paid managers
Strengthening labor market institutions can reverse this imbalance of power
Policy matters
CEOs make 312 times more than typical workers: CEO-to-worker compensation ratio, 1965–2017
| Year | CEO-to-worker compensation ratio based on options realized |
|---|---|
| 1965 | 20.0 |
| 1966 | 21.1 |
| 1967 | 22.3 |
| 1968 | 23.6 |
| 1969 | 23.3 |
| 1970 | 23.0 |
| 1971 | 22.8 |
| 1972 | 22.5 |
| 1973 | 22.2 |
| 1974 | 23.5 |
| 1975 | 25.0 |
| 1976 | 26.5 |
| 1977 | 28.1 |
| 1978 | 29.7 |
| 1979 | 31.6 |
| 1980 | 33.6 |
| 1981 | 35.7 |
| 1982 | 38.0 |
| 1983 | 40.4 |
| 1984 | 42.9 |
| 1985 | 45.6 |
| 1986 | 48.5 |
| 1987 | 51.5 |
| 1988 | 54.8 |
| 1989 | 58.2 |
| 1990 | 70.5 |
| 1991 | 85.3 |
| 1992 | 103.2 |
| 1993 | 106.1 |
| 1994 | 81.9 |
| 1995 | 112.3 |
| 1996 | 141.4 |
| 1997 | 207.5 |
| 1998 | 277.0 |
| 1999 | 248.1 |
| 2000 | 343.5 |
| 2001 | 194.1 |
| 2002 | 176.5 |
| 2003 | 219.2 |
| 2004 | 251.6 |
| 2005 | 299.0 |
| 2006 | 318.6 |
| 2007 | 327.4 |
| 2008 | 227.3 |
| 2009 | 187.8 |
| 2010 | 219.3 |
| 2011 | 225.6 |
| 2012 | 266.2 |
| 2013 | 278.6 |
| 2014 | 284.0 |
| 2015 | 271.6 |
| 2016 | 270.1 |
| 2017 | 311.7 |
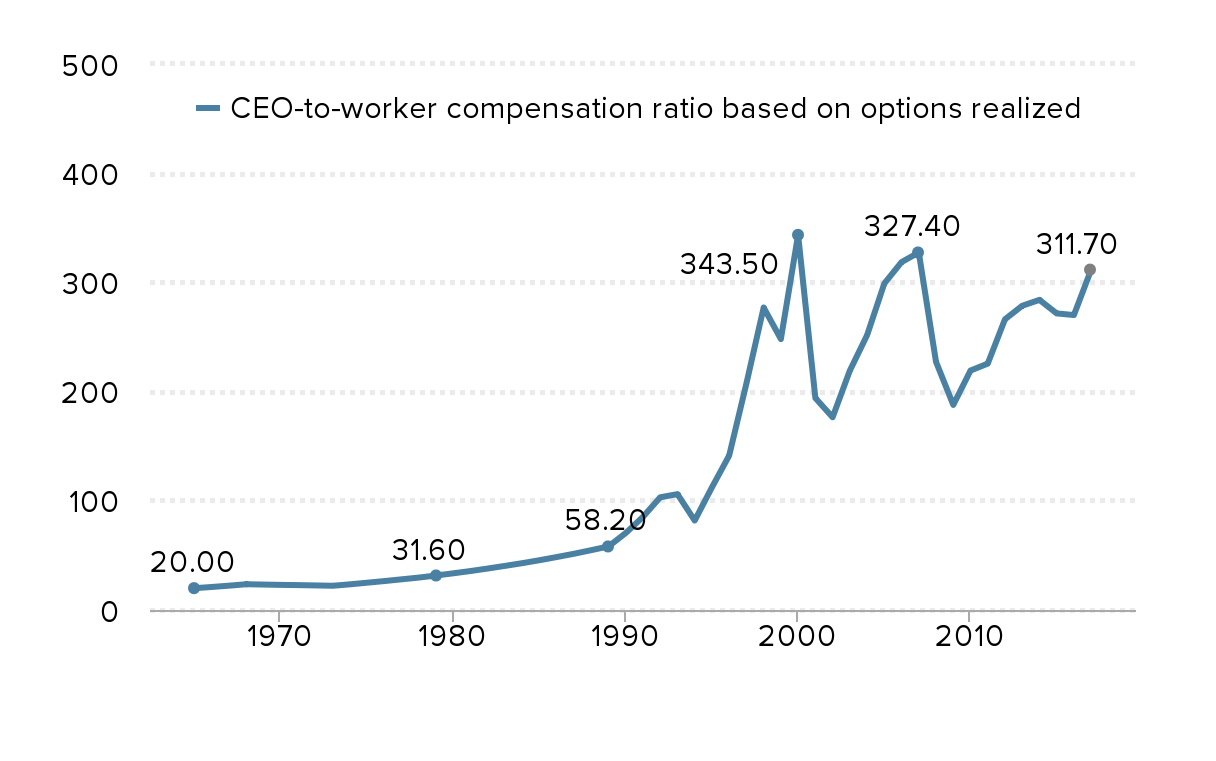
Notes: CEO annual compensation is computed using the “options realized” and “options granted” compensation series for CEOs at the top 350 U.S. firms ranked by sales. The “options realized” series includes salary, bonus, restricted stock grants, options realized, and long-term incentive payouts. Projected value for 2017 is based on the change in CEO pay as measured from June 2016 to June 2017 applied to the full-year 2016 value. “Typical worker” compensation is the average annual compensation of the workers in the key industry of the firms in the sample.
Source: Authors’ analysis of data from Compustat’s ExecuComp database, the Bureau of Labor Statistics’ Current Employment Statistics data series, and the Bureau of Economic Analysis NIPA tables
As union membership declines, income inequality rises: Union membership and share of income going to the top 10%, 1917–2017
| Year | Union membership | Share of income going to the top 10% |
|---|---|---|
| 1917 | 11.0% | 40.3% |
| 1918 | 12.1% | 39.9% |
| 1919 | 14.3% | 39.5% |
| 1920 | 17.5% | 38.1% |
| 1921 | 17.6% | 42.9% |
| 1922 | 14.0% | 42.9% |
| 1923 | 11.7% | 40.6% |
| 1924 | 11.3% | 43.3% |
| 1925 | 11.0% | 44.2% |
| 1926 | 10.7% | 44.1% |
| 1927 | 10.6% | 44.7% |
| 1928 | 10.4% | 46.1% |
| 1929 | 10.1% | 43.8% |
| 1930 | 10.7% | 43.1% |
| 1931 | 11.2% | 44.4% |
| 1932 | 11.3% | 46.3% |
| 1933 | 9.5% | 45.0% |
| 1934 | 9.8% | 45.2% |
| 1935 | 10.8% | 43.4% |
| 1936 | 11.1% | 44.8% |
| 1937 | 18.6% | 43.3% |
| 1938 | 23.9% | 43.0% |
| 1939 | 24.8% | 44.6% |
| 1940 | 23.5% | 44.4% |
| 1941 | 25.4% | 41.0% |
| 1942 | 24.2% | 35.5% |
| 1943 | 30.1% | 32.7% |
| 1944 | 32.5% | 31.5% |
| 1945 | 33.4% | 32.6% |
| 1946 | 31.9% | 34.6% |
| 1947 | 31.1% | 33.0% |
| 1948 | 30.5% | 33.7% |
| 1949 | 29.6% | 33.8% |
| 1950 | 30.0% | 33.9% |
| 1951 | 32.4% | 32.8% |
| 1952 | 31.5% | 32.1% |
| 1953 | 33.2% | 31.4% |
| 1954 | 32.7% | 32.1% |
| 1955 | 32.9% | 31.8% |
| 1956 | 33.2% | 31.8% |
| 1957 | 32.0% | 31.7% |
| 1958 | 31.1% | 32.1% |
| 1959 | 31.6% | 32.0% |
| 1960 | 30.7% | 31.7% |
| 1961 | 28.7% | 31.9% |
| 1962 | 29.1% | 32.0% |
| 1963 | 28.5% | 32.0% |
| 1964 | 28.5% | 31.6% |
| 1965 | 28.6% | 31.5% |
| 1966 | 28.7% | 32.0% |
| 1967 | 28.6% | 32.0% |
| 1968 | 28.7% | 32.0% |
| 1969 | 28.3% | 31.8% |
| 1970 | 27.9% | 31.5% |
| 1971 | 27.4% | 31.8% |
| 1972 | 27.5% | 31.6% |
| 1973 | 27.1% | 31.9% |
| 1974 | 26.5% | 32.4% |
| 1975 | 25.7% | 32.6% |
| 1976 | 25.7% | 32.4% |
| 1977 | 25.2% | 32.4% |
| 1978 | 24.7% | 32.4% |
| 1979 | 25.4% | 32.3% |
| 1980 | 23.6% | 32.9% |
| 1981 | 22.3% | 32.7% |
| 1982 | 21.6% | 33.2% |
| 1983 | 21.4% | 33.7% |
| 1984 | 20.5% | 33.9% |
| 1985 | 19.0% | 34.3% |
| 1986 | 18.5% | 34.6% |
| 1987 | 17.9% | 36.5% |
| 1988 | 17.6% | 38.6% |
| 1989 | 17.2% | 38.5% |
| 1990 | 16.7% | 38.8% |
| 1991 | 16.2% | 38.4% |
| 1992 | 16.2% | 39.8% |
| 1993 | 16.2% | 39.5% |
| 1994 | 16.1% | 39.6% |
| 1995 | 15.3% | 40.5% |
| 1996 | 14.9% | 41.2% |
| 1997 | 14.7% | 41.7% |
| 1998 | 14.2% | 42.1% |
| 1999 | 13.9% | 42.7% |
| 2000 | 13.5% | 43.1% |
| 2001 | 13.5% | 42.2% |
| 2002 | 13.3% | 42.4% |
| 2003 | 12.9% | 42.8% |
| 2004 | 12.5% | 43.6% |
| 2005 | 12.5% | 44.9% |
| 2006 | 12.0% | 45.5% |
| 2007 | 12.1% | 45.7% |
| 2008 | 12.4% | 46.0% |
| 2009 | 12.3% | 45.5% |
| 2010 | 11.9% | 46.4% |
| 2011 | 11.8% | 46.6% |
| 2012 | 11.2% | 47.8% |
| 2013 | 11.2% | 46.7% |
| 2014 | 11.1% | 46.9% |
| 2015 | 11.1% | 47.2% |
| 2016 | 10.7% | 47.4% |
| 2017 | 10.7% | 47.9% |
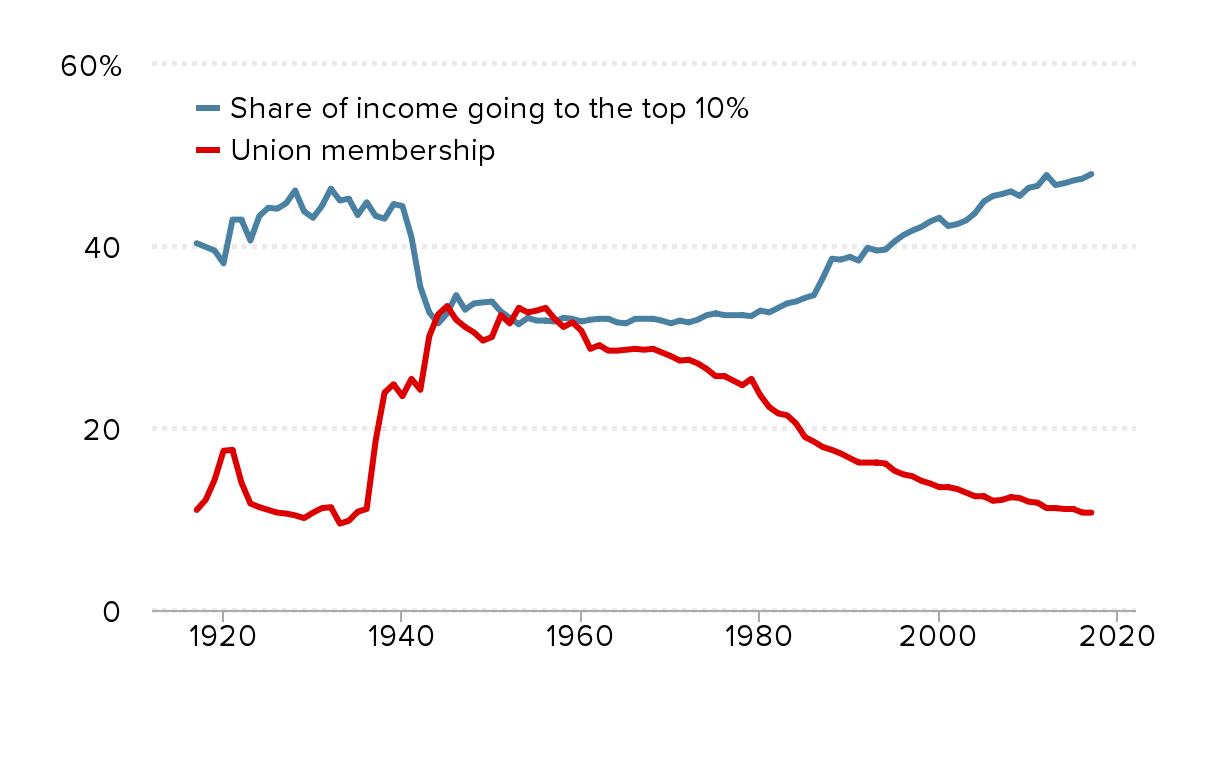
Sources: Data on union density follows the composite series found in Historical Statistics of the United States; updated to 2017 from unionstats.com. Income inequality (share of income to top 10%) data are from Thomas Piketty and Emmanuel Saez, “Income Inequality in the United States, 1913–1998,” Quarterly Journal of Economics 118, no. 1 (2003) and updated data from the Top Income Database, updated March 2019.
A large share of workers do not have the union representation they want and need: Share of workers who are either covered by a union contract or would vote for a union in their workplace, and share of workers who are covered by a union contract, 1977 and 2017
| Share of workers either covered by a union contract or who would vote for a union | Share of workers covered by a union contract | |
|---|---|---|
| 1977 | 59.5% | 26.5% |
| 2017 | 59.9% | 11.9% |
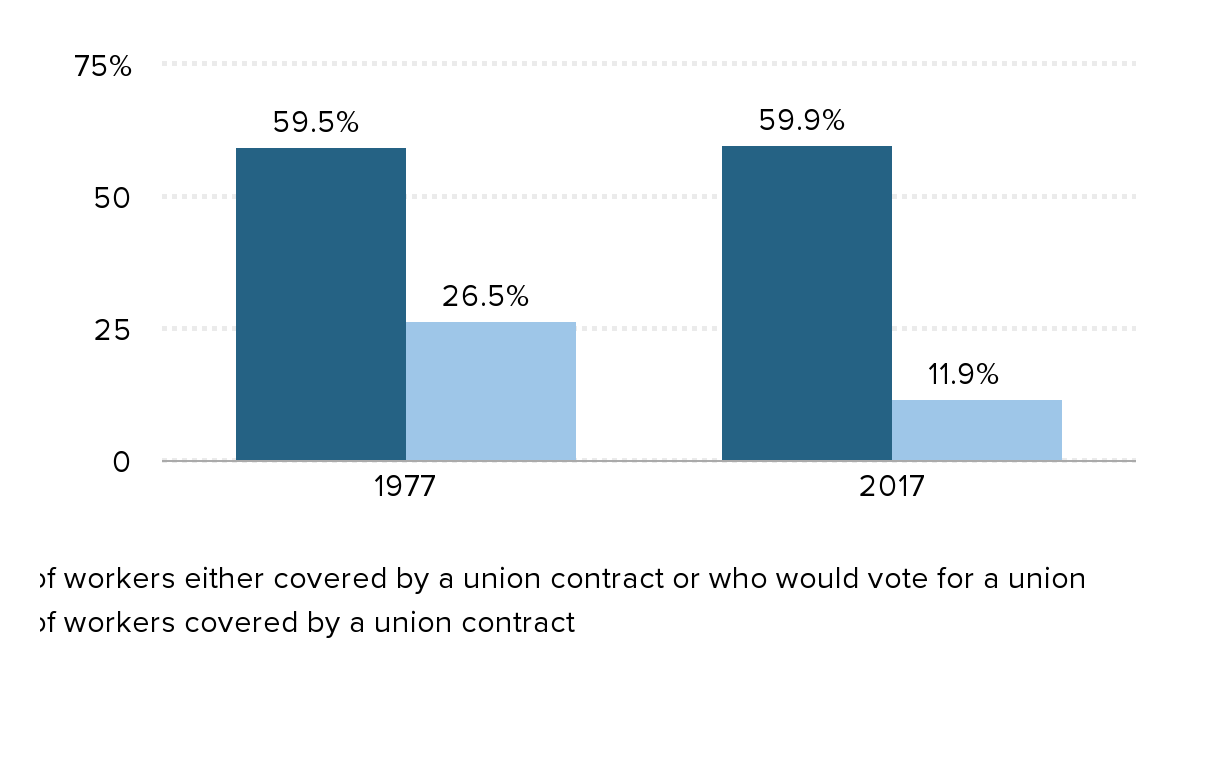
Source: Author’s analysis of Thomas A. Kochan et al., “Worker Voice in America: Is There a Gap between What Workers Expect and What They Experience?” ILR Review 72, no. 1 (2019) and Bureau of Labor Statistics’ Current Population Survey public data series
Supplemental charts
The 10 occupations with the largest projected job growth
| The 10 occupations with the largest projected job growth | Employment (in thousands) | Projected growth (in thousands) | Median annual wage, 2018 | ||
|---|---|---|---|---|---|
| 2018 | 2028 | ||||
| 1 | Personal care aides | 2,421 | 3,302 | 881 | $24,020 |
| 2 | Combined food preparation and serving workers, incl. fast food | 3,704 | 4,344 | 640 | $21,250 |
| 3 | Registered nurses | 3,060 | 3,431 | 372 | $71,730 |
| 4 | Home health aides | 832 | 1,137 | 305 | $24,200 |
| 5 | Cooks, restaurant | 1,362 | 1,661 | 299 | $26,530 |
| 6 | Software developers, applications | 944 | 1,186 | 242 | $103,620 |
| 7 | Waiters and waitresses | 2,635 | 2,805 | 170 | $21,780 |
| 8 | General and operations managers | 2,376 | 2,541 | 165 | $100,930 |
| 9 | Janitors and cleaners, except maids & housekeeping cleaners | 2,404 | 2,564 | 160 | $26,110 |
| 10 | Medical assistants | 687 | 842 | 155 | $33,610 |
Source: EPI analysis of Bureau of Labor Statistics data
Wage growth was stronger in the late 1990s than the current expansion: Real median wage growth, 1996–2000 and 2015–2019
| 1996-2000 | 2015-2019 | |
|---|---|---|
| White men | 9.9% | 6.6% |
| Black men | 10.3% | 5.0% |
| White women | 9.4% | 6.4% |
| Black women | 9.2% | 4.7% |
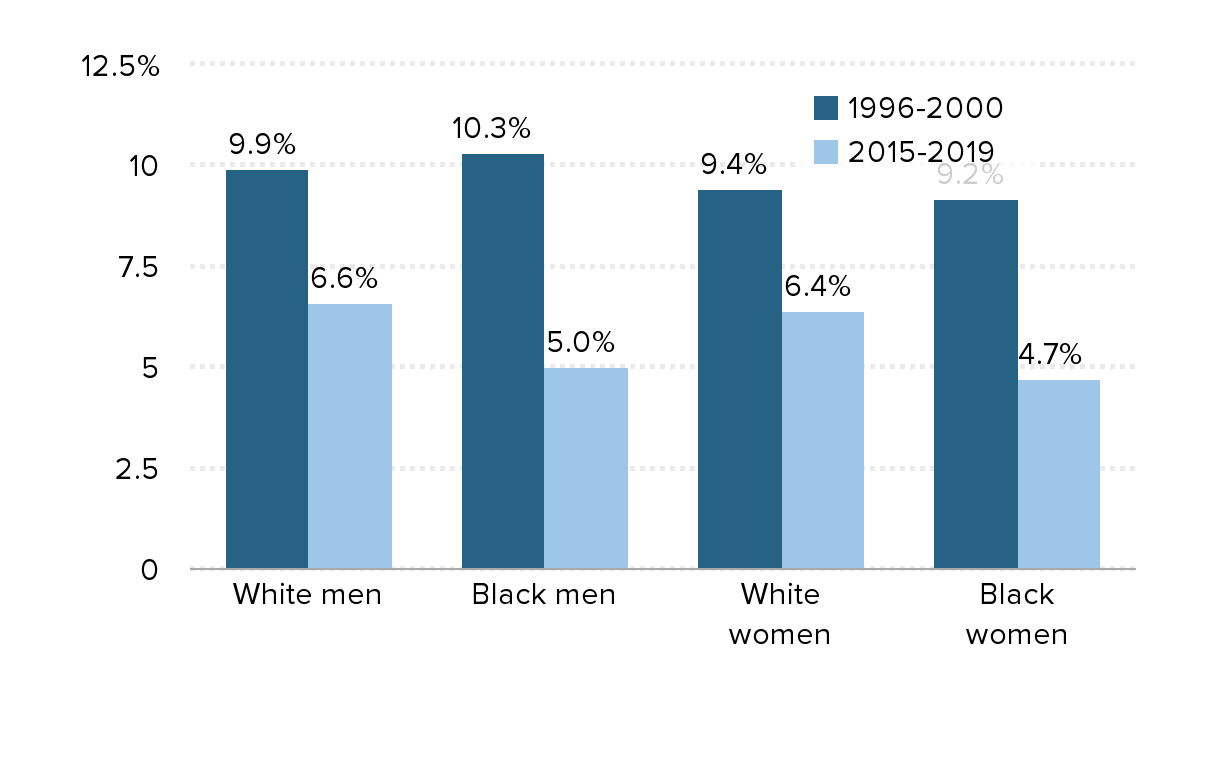
Note: In order to include data from the first half of 2019, all years refer to the 12 month period ending in June.
Source: Authors' analysis of Current Population Survey basic monthly microdata from the U.S. Census Bureau
Wage growth stronger among workers with a college degree in the late 1990s than the current expansion: Real average wage growth, workers with a bachelors degree, 1996–2000 and 2015–2019
| 1996-2000 | 2015-2019 | |
|---|---|---|
| Men | 10.9% | 7.8% |
| Women | 9.8% | 3.0% |
| White | 10.6% | 6.6% |
| Black | 11.5% | -0.3% |
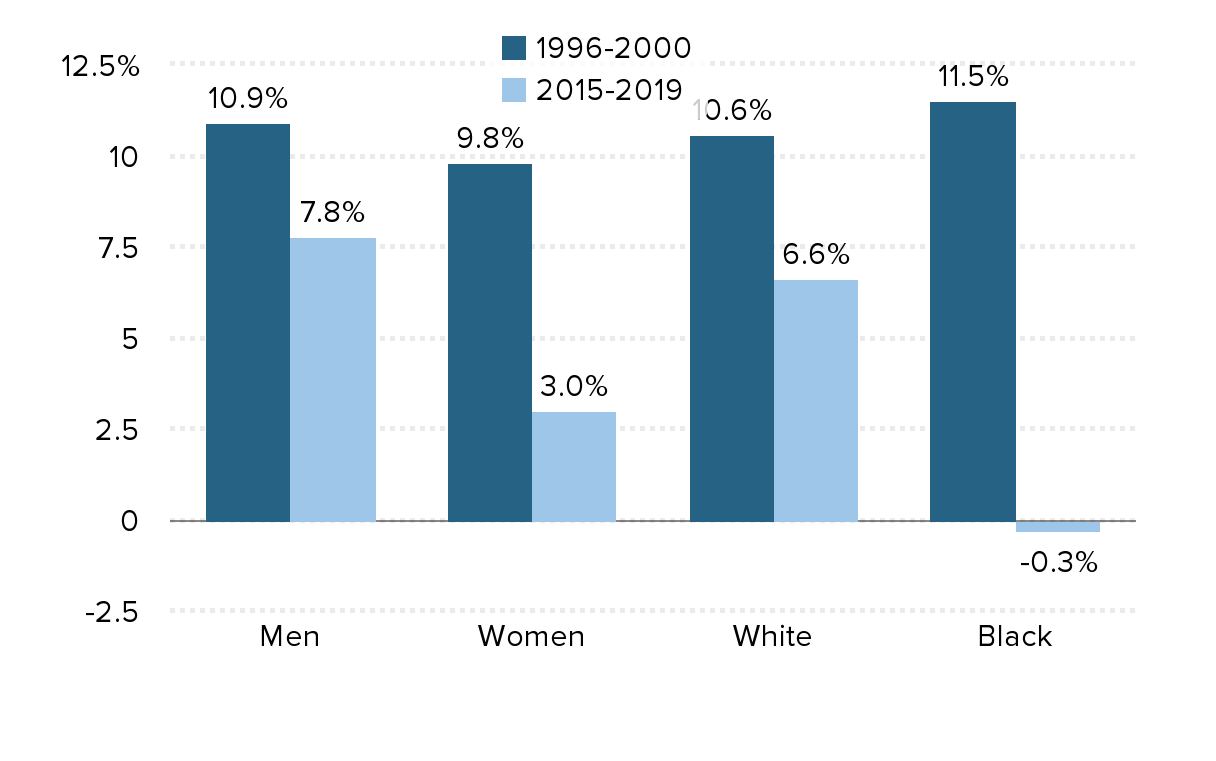
Note: In order to include data from the first half of 2019, all years refer to the 12 month period ending in June.
Source: Authors' analysis of Current Population Survey basic monthly microdata from the U.S. Census Bureau