Full Employment
Josh Bivens, Director of Research
Economic Policy Institute
Rayburn House Office Building, Room 2237
Monday, March 20, 2017
Disconnect between productivity and a typical worker's compensation, 1948–2015
| Year | Hourly compensation | Net productivity |
|---|---|---|
| 1948 | 0.00% | 0.00% |
| 1949 | 6.25% | 1.55% |
| 1950 | 10.48% | 9.33% |
| 1951 | 11.75% | 12.35% |
| 1952 | 15.04% | 15.63% |
| 1953 | 20.84% | 19.55% |
| 1954 | 23.52% | 21.56% |
| 1955 | 28.74% | 26.46% |
| 1956 | 33.94% | 26.66% |
| 1957 | 37.14% | 30.09% |
| 1958 | 38.16% | 32.78% |
| 1959 | 42.55% | 37.64% |
| 1960 | 45.49% | 40.05% |
| 1961 | 47.99% | 44.36% |
| 1962 | 52.47% | 49.79% |
| 1963 | 55.02% | 55.01% |
| 1964 | 58.50% | 59.99% |
| 1965 | 62.46% | 64.94% |
| 1966 | 64.89% | 70.00% |
| 1967 | 66.89% | 72.05% |
| 1968 | 70.73% | 77.16% |
| 1969 | 74.66% | 77.88% |
| 1970 | 76.59% | 80.37% |
| 1971 | 82.01% | 87.10% |
| 1972 | 91.24% | 92.05% |
| 1973 | 91.29% | 96.75% |
| 1974 | 86.96% | 93.66% |
| 1975 | 86.84% | 97.92% |
| 1976 | 89.66% | 103.44% |
| 1977 | 93.13% | 105.79% |
| 1978 | 95.96% | 107.79% |
| 1979 | 93.43% | 108.14% |
| 1980 | 88.56% | 106.57% |
| 1981 | 87.59% | 111.02% |
| 1982 | 87.76% | 107.88% |
| 1983 | 88.35% | 114.13% |
| 1984 | 86.94% | 119.73% |
| 1985 | 86.31% | 123.43% |
| 1986 | 87.32% | 127.99% |
| 1987 | 84.59% | 129.12% |
| 1988 | 83.85% | 131.78% |
| 1989 | 83.70% | 133.65% |
| 1990 | 82.22% | 136.98% |
| 1991 | 81.87% | 138.89% |
| 1992 | 83.04% | 147.56% |
| 1993 | 83.38% | 148.37% |
| 1994 | 83.82% | 150.75% |
| 1995 | 82.70% | 150.86% |
| 1996 | 82.79% | 156.92% |
| 1997 | 84.80% | 160.50% |
| 1998 | 89.17% | 165.71% |
| 1999 | 91.92% | 172.08% |
| 2000 | 92.90% | 178.50% |
| 2001 | 95.56% | 182.84% |
| 2002 | 99.38% | 190.72% |
| 2003 | 101.63% | 200.17% |
| 2004 | 100.84% | 208.21% |
| 2005 | 100.05% | 213.58% |
| 2006 | 100.21% | 215.48% |
| 2007 | 101.70% | 217.70% |
| 2008 | 101.71% | 218.24% |
| 2009 | 109.69% | 224.75% |
| 2010 | 111.53% | 234.28% |
| 2011 | 109.06% | 234.67% |
| 2012 | 107.27% | 236.51% |
| 2013 | 108.32% | 237.57% |
| 2014 | 109.13% | 239.30% |
| 2015 | 112.53% | 241.08% |

Note: Data are for average hourly compensation of production/nonsupervisory workers in the private sector and net productivity of the total economy. "Net productivity" is the growth of output of goods and services minus depreciation per hour worked.
Source: EPI analysis of data from the BEA and BLS (see technical appendix of Understanding the Historic Divergence Between Productivity and a Typical Worker's Pay for more detailed information)
Source: Economic Policy Institute analysis of data from the Bureau of Economic Analysis' National Income and Product Accounts and the Bureau of Labor Statistics' Consumer Price Indexes and Labor Productivity and Costs programs (see technical appendix of Understanding the Historic Divergence Between Productivity and a Typical Worker's Pay for more detailed information)
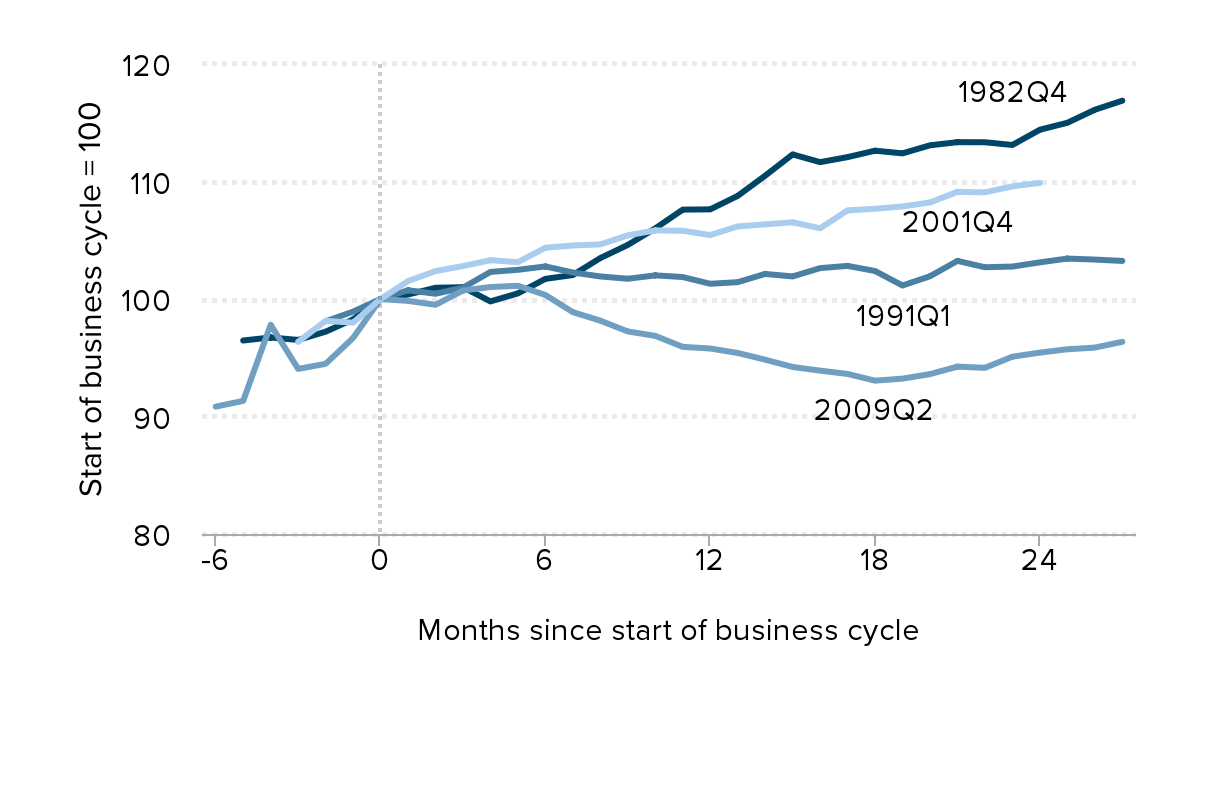
Fiscal austerity explains why recovery has been so long in coming: Change in per capita government spending over last four business cycles
| 1982Q4 | 1991Q1 | 2001Q4 | 2009Q2 | |
|---|---|---|---|---|
| -6 | 90.83817 | |||
| -5 | 96.46779 | 91.33168 | ||
| -4 | 96.72548 | 97.80345 | ||
| -3 | 96.51523 | 96.35624 | 94.05089 | |
| -2 | 97.21731 | 98.09825 | 98.14218 | 94.4813 |
| -1 | 98.26435 | 98.92533 | 97.98324 | 96.68474 |
| 0 | 100 | 100 | 100 | 100 |
| 1 | 100.3829 | 100.7468 | 101.5275 | 99.84022 |
| 2 | 100.9558 | 100.4456 | 102.3723 | 99.50632 |
| 3 | 101.005 | 100.9653 | 102.8023 | 100.7222 |
| 4 | 99.79553 | 102.3054 | 103.3013 | 101.0192 |
| 5 | 100.4771 | 102.4831 | 103.1351 | 101.1242 |
| 6 | 101.715 | 102.7714 | 104.3665 | 100.3432 |
| 7 | 102.037 | 102.2554 | 104.5556 | 98.88213 |
| 8 | 103.485 | 101.9195 | 104.6451 | 98.15822 |
| 9 | 104.602 | 101.724 | 105.4192 | 97.23836 |
| 10 | 106.0107 | 102.011 | 105.8382 | 96.86414 |
| 11 | 107.6073 | 101.868 | 105.804 | 95.9267 |
| 12 | 107.6288 | 101.2959 | 105.4445 | 95.78736 |
| 13 | 108.7749 | 101.4328 | 106.1767 | 95.40735 |
| 14 | 110.4932 | 102.1325 | 106.3521 | 94.83589 |
| 15 | 112.3029 | 101.9209 | 106.5289 | 94.21625 |
| 16 | 111.6476 | 102.6275 | 106.0185 | 93.90439 |
| 17 | 112.0741 | 102.8173 | 107.5423 | 93.62299 |
| 18 | 112.6221 | 102.3836 | 107.6773 | 93.04895 |
| 19 | 112.3952 | 101.1486 | 107.8776 | 93.22292 |
| 20 | 113.0807 | 101.9359 | 108.2144 | 93.60604 |
| 21 | 113.3476 | 103.2437 | 109.1187 | 94.245 |
| 22 | 113.3408 | 102.7047 | 109.0787 | 94.14226 |
| 23 | 113.108 | 102.7598 | 109.5846 | 95.09063 |
| 24 | 114.405 | 103.1194 | 109.8789 | 95.43504 |
| 25 | 114.9973 | 103.4402 | 95.722 | |
| 26 | 116.1049 | 103.3562 | 95.86387 | |
| 27 | 116.8758 | 103.2392 | 96.35498 |

Note: For total government spending, government consumption and investment expenditures deflated with the NIPA price deflator. Government transfer payments deflated with the price deflator for personal consumption expenditures. This figure includes state and local government spending.
Source: EPI analysis of data from Tables 1.1.4, 3.1, and 3.9.4 from the Bureau of Economic Analysis (BEA), "National Data: National Income and Product Accounts" (data series), n.d., accessed December 2022.
Economic Policy Institute: epi.org

