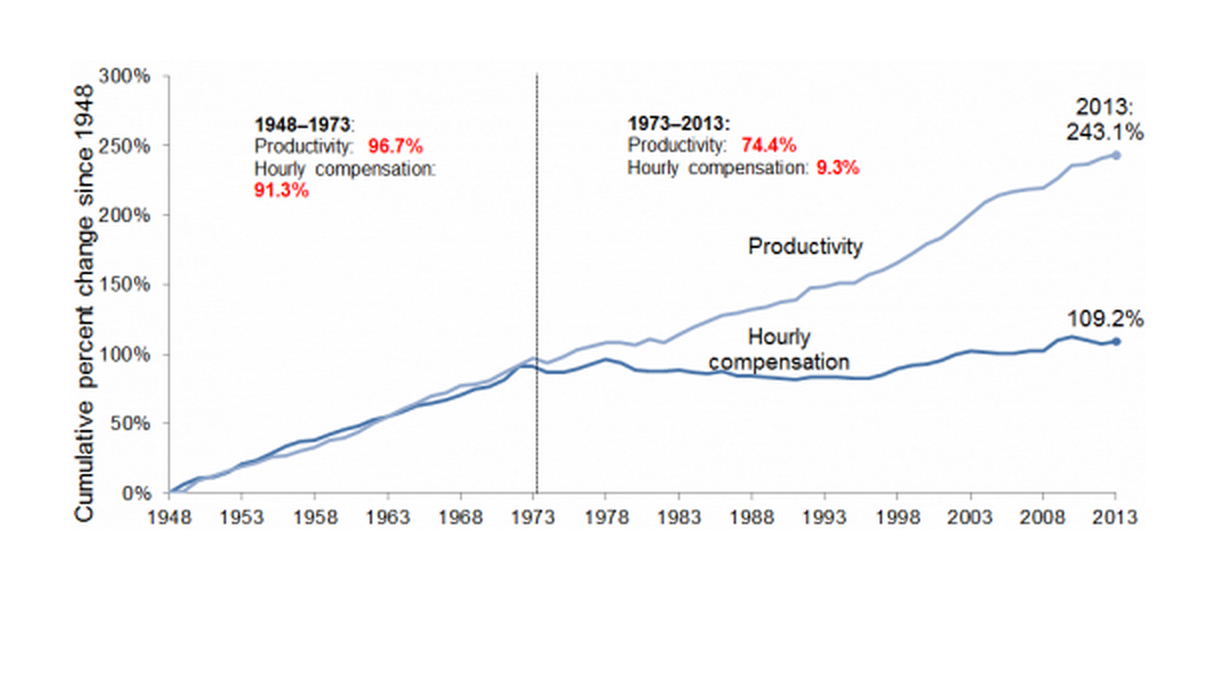
Cumulative change in productivity and real hourly compensation, 1948–2013
| Year | % Cumulative growth in real hourly compensation since 1948 | % Cumulative growth in net productivity since 1948 |
|---|---|---|
| 1947 | ||
| 1948 | 0.0% | 0.0% |
| 1949 | 6.3% | 1.5% |
| 1950 | 10.5% | 9.3% |
| 1951 | 11.8% | 12.4% |
| 1952 | 15.0% | 15.6% |
| 1953 | 20.8% | 19.5% |
| 1954 | 23.5% | 21.6% |
| 1955 | 28.7% | 26.5% |
| 1956 | 33.9% | 26.7% |
| 1957 | 37.1% | 30.1% |
| 1958 | 38.2% | 32.8% |
| 1959 | 42.6% | 37.6% |
| 1960 | 45.5% | 40.0% |
| 1961 | 48.0% | 44.4% |
| 1962 | 52.5% | 49.8% |
| 1963 | 55.0% | 55.0% |
| 1964 | 58.5% | 60.0% |
| 1965 | 62.5% | 64.9% |
| 1966 | 64.9% | 70.0% |
| 1967 | 66.9% | 72.1% |
| 1968 | 70.7% | 77.2% |
| 1969 | 74.7% | 77.9% |
| 1970 | 76.6% | 80.4% |
| 1971 | 82.0% | 87.1% |
| 1972 | 91.3% | 92.0% |
| 1973 | 91.3% | 96.7% |
| 1974 | 87.0% | 93.6% |
| 1975 | 86.9% | 97.9% |
| 1976 | 89.7% | 103.4% |
| 1977 | 93.2% | 105.8% |
| 1978 | 96.0% | 107.8% |
| 1979 | 93.4% | 108.1% |
| 1980 | 88.6% | 106.5% |
| 1981 | 87.6% | 111.0% |
| 1982 | 87.8% | 107.9% |
| 1983 | 88.3% | 114.1% |
| 1984 | 87.0% | 119.7% |
| 1985 | 86.4% | 123.4% |
| 1986 | 87.3% | 128.0% |
| 1987 | 84.6% | 129.1% |
| 1988 | 83.9% | 131.8% |
| 1989 | 83.7% | 133.7% |
| 1990 | 82.2% | 137.0% |
| 1991 | 82.1% | 138.9% |
| 1992 | 83.1% | 147.6% |
| 1993 | 83.4% | 148.4% |
| 1994 | 83.8% | 150.8% |
| 1995 | 82.7% | 150.9% |
| 1996 | 82.8% | 157.0% |
| 1997 | 84.8% | 160.6% |
| 1998 | 89.2% | 165.9% |
| 1999 | 92.0% | 172.8% |
| 2000 | 93.0% | 179.2% |
| 2001 | 95.7% | 183.5% |
| 2002 | 99.6% | 191.4% |
| 2003 | 101.8% | 200.9% |
| 2004 | 101.1% | 209.1% |
| 2005 | 100.3% | 214.5% |
| 2006 | 100.4% | 216.5% |
| 2007 | 101.9% | 218.8% |
| 2008 | 102.1% | 219.4% |
| 2009 | 110.1% | 226.0% |
| 2010 | 112.1% | 235.4% |
| 2011 | 109.6% | 236.7% |
| 2012 | 107.7% | 240.9% |
| 2013 | 109.2% | 243.1% |

Note: Hourly compensation is based on the wage data for production/nonsupervisory workers from the Current Employment Statistics. Wages are coverted to hourly compensation by scaling by the real compensation/wage ratio from NIPA data. Compensation from that ratio is defined as the sum of wages and salaries (wage and salary accruals divided by hours worked of full-time and part-time workers) and benefits (payroll taxes; and health, pension, and other nonwage benefits). These data were deflated using the NIPA personal consumption expenditure (PCE, chain-weighted) index, with health insurance adjusted by the PCE medical care (chained) index. Productivity reflects total economy productivity net capital depreciation.
Source: Economic Policy Institute analysis of unpublished Total Economy Productivity data from Bureau of Labor Statistics (BLS) Labor Productivity and Costs program, BLS Current Employment Statistics, and Bureau of Economic Analysis National Income and Product Account (NIPA)
UPDATED FROM: Figure 4U in The State of Working America, 12th Edition, an Economic Policy Institute book published by Cornell University Press in 2012.
Previous chart: « Trends in Apple suppliers’ compliance with health and safety benchmarks (as reported by Apple)
Next chart: Cumulative change in real annual wages, by wage group, 1979–2012 »